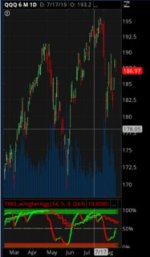
Thanks Markos. Good advice. I'll be watching the 3 grid chart for a few weeks to try and gain a better understanding of how to use this indicator. I think part of why I am struggling a bit is because it seems as though most of the traders here are day traders, trade futures, or trade options. I do not trade intraday nor do I trade futures or options. I've been swing trading for about 10 years using various PCFs and East Scans I created using TeleChart. I was trading individual stocks and focused mainly on momentum breakouts using various parameters of trend intensity.@David45 Let me say this again. Please load this 3 Grid Chart into ThinkorSwim and Observe. Watch if for a week.
Notice the difference between actual moves & counter trend moves. Please look at the indicator and the price chart and see what is happening.
If you need some assistance with reading charts, ask after you've done your due diligence.
Did you read all of the Tutorials that mention both TMO and RSI Laguerre? I have written on both in either the TMO or RSI Laguerre Threads.
Please use the search bar to find all instances.
I have written extensively on both topics in the Indicator and Tutorial Sections. If you have read them, please do it again.
There is even a video on the Slim Ribbon. Please find it and review it several times. The Ribbon is for Trend, the other 2 are similar for Momentum.
If your intention is to "mess" with Triple Levered ETF's, someone braver than I will have to tell you how they would go about trading them. Thanks.
My day job and family commitments are now so demanding that I have very little time to devote to trading. So I have switched to an ETF based swing trading method to catch the major trends long and short on the Nasdaq 100. So basically 5 or 6 signals total from October 2018 to present. I'm not tied to using triple ETFs but they move more like stocks in terms of how much they move up and down.
Unfortunately, trend intensity does not work very well for trading ETFs. Since I already have a TDA account I thought I would try TOS. I have been trying various settings of the Detrended Price Oscillator, Ray Bear Power, and Qstick. Simply going long and short when they break above or below the zero mid line. But they all tend to get me into the trend a bit late on both the long and short side and are prone to false signals and whipsaws, especially using the shorter periods.
The True Momentum Oscillator seems like it might work a bit better for what I am trying to achieve. I read the tutorials but all I can conclude in terms of trying to keep things simple is to go short when it crosses below the +10 line and go long when it crosses above the -10 line. I have no idea what to do when it changes color in between these two signal lines. Like the other oscillators I have been trying, the TMO also seems prone to some false signals and whipsaws albeit to a lesser degree and it seems to get you into the trend earlier both long and short. I can easily see the difference between the actual moves and the counter trend moves. What I cannot see is how I would know the signal is false and not to take it. Getting in the trend early and avoiding false signals/whipsaws at all costs are my primary objectives. Maybe I will have an aha moment the more I look at it.
I really appreciate all of your help and insights. If there are any other indicators or oscillators that you think would also be useful for what I am trying to achieve I would love to hear about them. Horserider's Ultimate RSI looks very promising as well.

