
These are the archived posts for the RSI. The current thread can be found:
This indicator for ThinkorSwim will help you detect bullish and bearish RSI divergences on your chart.
The header of this script also detailed how to set up the scanner that looks for RSI divergences, which often signal possible reversals.
There are a couple of versions for you to check out. The first by Mobius, the other by @cos251
thinkScript Code
Rich (BB code):
# RSI_With_Divergence
# Mobius
# V01.01.2013
# 4.15.2019
#hint:<b>RSI with Divergence</b>

# Note: Install this as a new study. Save this study using the name above (the first line of code RSI_With_Divergence).

# To use this study as a scan; DO NOT TRY TO LOAD IT DIRECTLY IN THE SCANNER, IT WILL THROW AN ERROR MESSAGE. Go to the scan tab. Delete any existing scan criteria. Click Add Study Filter. Click the window under Criteria. In that drop down menu click Custom. Delete the existing study. Click Add Condition. Click the down arrow in the Select A Condition window. Click Study. Scroll down the List till you find RSI_With_Divergence and click it. Click on the Plot window and you can choose Dhigh or Dlow in addition to the default plot RSI. If you choose either of the divergence siganls choose is True from the center column. Click on the aggregation period at the top left and set the aggregation period you want scaned. Then click Save and when the popup window shows the warning that this is a custom scan chose OK. Now put the list of stocks you wish to scan in the Scan In box and chose any list you want that to intersect with. If you wish to make this a Dynamic WatchList, save this scan with a name such as RSI_With_Div_WL then in your Gadgets box click the little gear icon, locate the name of the scan you just saved and click it. As equities match the scan criteria they will populate the list.

declare lower;

input n = 14;        #hint nRSI: Periods or length for RSI

input Over_Bought = 70; #hint Over_Bought: Over Bought line

input Over_Sold = 30;   #hint Over_Sold: Over Sold line

def o = open;

def h = high;

def l = low;

def c = close;

def x = BarNumber();

def MidLine = 50;

def NetChgAvg = ExpAverage(c - c[1], n);

def TotChgAvg = ExpAverage(AbsValue(c - c[1]), n);

def ChgRatio = if TotChgAvg != 0

                  then NetChgAvg / TotChgAvg

                  else 0;

plot RSI = 50 * (ChgRatio + 1);

RSI.AssignValueColor(if RSI < Over_Sold

                     then color.yellow

                     else if RSI > Over_Bought

                     then color.yellow

                     else createColor(25, 75, 250));

plot OverSold = Over_Sold;

plot OverBought = Over_Bought;

def bar = BarNumber();

def Currh = if RSI > OverBought

                then fold i = 1 to Floor(n / 2)

                with p = 1

                while p

                do RSI > getValue(RSI, -i)

                else 0;

def CurrPivotH = if (bar > n and

                         RSI == highest(RSI, Floor(n/2)) and

                         Currh)

                     then RSI

                     else double.NaN;

def Currl = if RSI < OverSold

                then fold j = 1 to Floor(n / 2)

                with q = 1

                while q

                do RSI < getValue(RSI, -j)

                else 0;

def CurrPivotL = if (bar > n and

                         RSI == lowest(RSI, Floor(n/2)) and

                         Currl)

                     then RSI

                     else double.NaN;

def CurrPHBar = if !isNaN(CurrPivotH)

                then bar

                else CurrPHBar[1];

def CurrPLBar = if !isNaN(CurrPivotL)

                then bar

                else CurrPLBar[1];

def PHpoint = if !isNaN(CurrPivotH)

              then CurrPivotH

              else PHpoint[1];

def priorPHBar = if PHpoint != PHpoint[1]

                 then CurrPHBar[1]

                 else priorPHBar[1];

def PLpoint = if !isNaN(CurrPivotL)

              then CurrPivotL

              else PLpoint[1];

def priorPLBar = if PLpoint != PLpoint[1]

                 then CurrPLBar[1]

                 else priorPLBar[1];

def HighPivots = bar >= highestAll(priorPHBar);

def LowPivots = bar >= highestAll(priorPLBar);

def pivotHigh = if HighPivots

                then CurrPivotH

                else double.NaN;

plot PlotHline = pivotHigh;

    PlotHline.enableApproximation();

    PlotHline.SetDefaultColor(GetColor(7));

    PlotHline.SetStyle(Curve.Short_DASH);

plot pivotLow = if LowPivots

                then CurrPivotL

                else double.NaN;

    pivotLow.enableApproximation();

    pivotLow.SetDefaultColor(GetColor(7));

    pivotLow.SetStyle(Curve.Short_DASH);

plot PivotDot = if !isNaN(pivotHigh)

                then pivotHigh

                else if !isNaN(pivotLow)

                     then pivotLow

                     else double.NaN;

    pivotDot.SetDefaultColor(GetColor(7));

    pivotDot.SetPaintingStrategy(PaintingStrategy.POINTS);

    pivotDot.SetLineWeight(3);

# End Code RSI with Divergence
Another version created by Drew Griffith:
Code:
# RSIDIVERGENCE
declare lower;
input nRSI = 2;
input OverBought = 95;
input OverSold = 5;
input MidLine = 50;
input nTrend = 100;
input TrendLine = {EMA, SMA, default LRL, WMA};
# Global definitions
def h = high;
def l = low;
def c = close;
def cond1 = CompoundValue(1, if IsNaN(c)
then cond1[1]
else c, c);
# RSI Wilder with Divergence Markers
def NetChgAvg = WildersAverage(c - c[1], nRSI);
def TotChgAvg = WildersAverage(AbsValue(c - c[1]), nRSI);
def ChgRatio = if TotChgAvg != 0 then NetChgAvg / TotChgAvg else 0;
plot RSI = round(50 * (ChgRatio + 1),0);
RSI.SetLineWeight(3);
RSI.AssignValueColor(if RSI < OverSold then Color.Green else if RSI > OverBought then Color.Red else Color.Gray);
plot RSItrend;
switch (TrendLine) {
case EMA:
RSItrend = ExpAverage(RSI, nTrend);
case SMA:
RSItrend = Average(RSI, nTrend);
case LRL:
RSItrend = InertiaAll(RSI, nTrend);
case WMA:
RSItrend = WMA(RSI, nTrend);
}
RSItrend.SetLineWeight(1);
RSItrend.SetDefaultColor(Color.RED);
plot RSIOB = OverBought;
RSIOB.SetLineWeight(1);
RSIOB.SetDefaultColor(Color.Blue);
plot RSIOS = OverSold;
RSIOS.SetLineWeight(1);
RSIOS.SetDefaultColor(Color.Blue);
def lowestLow = if RSI > OverSold
then l
else if RSI < OverSold and
l < lowestLow[1]
then l
else lowestLow[1];
def lowestRSI = if RSI > MidLine
then RSI
else if RSI < MidLine and
RSI < lowestRSI[1]
then RSI
else lowestRSI[1];
def divergentLow = if RSI < OverSold and
l <= lowestLow[1] and
RSI > lowestRSI[1]
then OverSold
else Double.NaN;
plot DLow = divergentLow;
DLow.SetPaintingStrategy(PaintingStrategy.POINTS);
DLow.SetLineWeight(3);
DLow.SetDefaultColor(Color.YELLOW);
def highestHigh = if RSI < OverBought
then h
else if RSI > OverBought and
h > highestHigh[1]
then h
else highestHigh[1];
def highestRSI = if RSI < MidLine
then RSI
else if RSI > MidLine and
RSI > highestRSI[1]
then RSI
else highestRSI[1];
def divergentHigh = if RSI > OverBought and
h >= highestHigh[1] and
RSI < highestRSI[1] and
cond1 within 3 bars
then OverBought
else Double.NaN;
plot DHigh = divergentHigh;
DHigh.SetPaintingStrategy(PaintingStrategy.POINTS);
DHigh.SetLineWeight(3);
DHigh.SetDefaultColor(Color.YELLOW);
def AlertCond1 = DHigh == OverBought;
def AlertCond2 = DLow == OverSold;
#Alert(AlertCond1, "Divergent High", Alert.Bar, Sound.Bell);
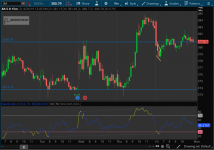
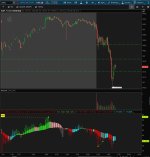
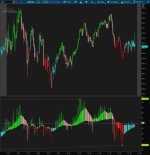
#Alert(AlertCond1, "Divergent Low", Alert.Bar, Sound.Bell);RSI Divergence Candles
Version 1.1 of RSI_Div_Candles per @High_Velocity request.
(Thx @germanburrito for AddChart() logic)
Fixed/Added the following:
- Fixed hollow UP Candles - fix provided by @SleepyZ
- Adjusted OB/OS option to turn on/off
- Added Visual Divergence Lines - credit @SuryaKiranC
Ruby:
## RSI_DIV_CANDLES
##
##
## CREDITS
## Requested by @High_Velocity from orignal source https://www.tradingview.com/v/4VKd87zy/
##
##
## Removing the header Credit credits and description is not permitted, any modification needs to be shared.
##
## V 1.1 :    @cos251 - @SleepyZ provided fix for hollow UP candles.  @SuryaKiranC provided Divergence line identifier
##                      Added option to turn on/off OB/OS lines.
##
## V 1.0 :    @cos251 - Initial release per request from usethinkscript forum.  Logic appears to match, Candle wicks may need additional
##       :    tweaking; thanks to @germanburrito for sharing AddChart() logic

declare lower;

input useHL          = no;
input price          = close;
input fastLength     = 8;
input slowLength     = 55;
input smooth         = 10;
input overBought     = 70;
input overSold       = 30;
input showOBOS       = no;
input showDivergence = yes;

def fastRSI = reference RSI(length = fastLength, price = price);
def slowRSI = reference RSI(length = slowLength, price = price);

def smoothFastRSI = MovingAverage(AverageType.WILDERS,fastRSI,smooth);
def smoothSlowRSI = MovingAverage(AverageType.WILDERS,slowRSI,smooth);

def rsiHigh = if useHL then Max(RSI(length = fastLength, price = high),RSI(length=slowLength,price = high)) else MAX(fastRSI,slowRSI);
def rsiLow = if useHL then MIN(RSI(length=fastLength,price=low),RSI(length=slowLength,price=low)) else MIN(fastRSI,slowRSI);

def isBull = smoothFastRSI >= smoothSlowRSI;
def isExp = AbsValue(smoothFastRSI-smoothSlowRSI) >= AbsValue(smoothFastRSI[1]-smoothSlowRSI[1]);

def o = smoothSlowRSI;
def h = rsiHigh;
def l = rsiLow;
def c = smoothFastRSI;

# Plot UP candle with isBull only
def UpO1;
def UpH1;
def UpL1;
def UpC1;
if o < c and isBull
then {
    UpO1 = o;
    UpH1 = h;
    UpL1 = l;
    UpC1 = c;
} else {
    UpO1 = Double.NaN;
    UpH1 = Double.NaN;
    UpL1 = Double.NaN;
    UpC1 = Double.NaN;
}

# Plot UP candle with isBull and isExp
def UpO;
def UpH;
def UpL;
def UpC;
if o < c and isBull and isExp
then {
    UpO = o;
    UpH = h;
    UpL = l;
    UpC = c;
} else {
    UpO = Double.NaN;
    UpH = Double.NaN;
    UpL = Double.NaN;
    UpC = Double.NaN;
}

# Plot DOWN candle
def DnO;
def DnH;
def DnL;
def DnC;
if o > c
then {
    DnO = o;
    DnH = h;
    DnL = l;
    DnC = c;
} else {
    DnO = Double.NaN;
    DnH = Double.NaN;
    DnL = Double.NaN;
    DnC = Double.NaN;
}


# Plot DOWN candle with !isBull and !isExp
def DnO1;
def DnH1;
def DnL1;
def DnC1;
if o > c and !isBull and !isExp
then {
    DnO1 = o;
    DnH1 = h;
    DnL1 = l;
    DnC1 = c;
} else {
    DnO1 = Double.NaN;
    DnH1 = Double.NaN;
    DnL1 = Double.NaN;
    DnC1 = Double.NaN;
}

# Plot the new Chart
#AddChart(high = UpH1, low = UpL1, open = UpO1, close = UpC1, type = ChartType.CANDLE, growcolor = Color.PINK);
#AddChart(high = UpH, low = UpL, open = UpO, close = UpC, type = ChartType.CANDLE, growcolor = Color.GREEN);
AddChart(high = UpH1, low = UpL1, open = Upc1, close = Upo1, type = ChartType.CANDLE, growcolor = Color.PINK);
AddChart(high = UpH, low = UpL, open = Upc, close = Upo, type = ChartType.CANDLE, growcolor = Color.GREEN);
AddChart(high = DnH, low = DnL, open = DnO, close = DnC, type = ChartType.CANDLE, growcolor = Color.RED);
AddChart(high = DnH1, low = DnL1, open = DnO1, close = DnC1, type = ChartType.CANDLE, growcolor = Color.CYAN);

plot ob = if showOBOS then overBought else Double.NaN;
ob.SetDefaultColor(COLOR.RED);
plot os = if showOBOS then overSold else Double.NaN;
os.SetDefaultColor(COLOR.GREEN);

def BN = barnumber();

#Divergence Code

def RSI_H = if fastRSI > overBought then fold Ri = 1 to Floor(fastLength / 2) with Rp = 1 while Rp do fastRSI > GetValue(fastRSI, -Ri) else 0;
def RSI_PivotH = if (BN > fastLength and fastRSI == Highest(fastRSI, Floor(fastLength / 2)) and RSI_H) then fastRSI else Double.NaN;
def RSI_L = if fastRSI < overSold then fold Rj = 1 to Floor(fastLength / 2) with Rq = 1 while Rq do fastRSI < GetValue(fastRSI, -Rj) else 0;
def RSI_PivotL = if (BN > fastLength and fastRSI == Lowest(fastRSI, Floor(fastLength / 2)) and RSI_L) then fastRSI else Double.NaN;
def RSI_PHBar = if !IsNaN(RSI_PivotH) then BN else RSI_PHBar[1];
def RSI_PLBar = if !IsNaN(RSI_PivotL) then BN else RSI_PLBar[1];
def RSI_PHPoint = if !IsNaN(RSI_PivotH) then RSI_PivotH else RSI_PHPoint[1];
def RSI_LastPHBar = if RSI_PHPoint != RSI_PHPoint[1] then RSI_PHBar[1] else RSI_LastPHBar[1];
def RSI_PLPoint = if !IsNaN(RSI_PivotL) then RSI_PivotL else RSI_PLPoint[1];
def RSI_LastPLBar = if RSI_PLPoint != RSI_PLPoint[1] then RSI_PLBar[1] else RSI_LastPLBar[1];

def RSI_HighPivots = BN >= HighestAll(RSI_LastPHBar);
def RSI_LowPivots = BN >= HighestAll(RSI_LastPLBar);
def RSI_pivotHigh = if RSI_HighPivots then RSI_PivotH else Double.NaN;

plot RSI_plotHline = if showDivergence then RSI_pivotHigh else Double.NaN;
RSI_plotHline.EnableApproximation();
RSI_plotHline.SetDefaultColor(Color.LIME);
RSI_plotHline.SetStyle(Curve.SHORT_DASH);

plot RSI_pivotLow = if showDivergence and RSI_LowPivots then RSI_PivotL else Double.NaN;
RSI_pivotLow.EnableApproximation();
RSI_pivotLow.SetDefaultColor(Color.LIME);
RSI_pivotLow.SetStyle(Curve.SHORT_DASH);

plot RSI_pivotDot = if !IsNaN(RSI_pivotHigh) then RSI_pivo[ATTACH=full]4435[/ATTACH]tHigh else if !IsNaN(RSI_pivotLow) then RSI_pivotLow else Double.NaN;
RSI_pivotDot.SetDefaultColor(Color.LIME);
RSI_pivotDot.SetPaintingStrategy(PaintingStrategy.POINTS);
RSI_pivotDot.SetLineWeight(3);

AddLabel(yes,"RSI:",Color.YELLOW);
UPPER STUDY VERSION 1.0 (per request from @TradeUp)
This is the upper version as requested (pretty lean on code too).
For now only includes the candle coloring, will have to work on plotting the Divergence Lines.
Code:
## RSI_DIV_CANDLES_Upper
##
##
## CREDITS
## Requested by @High_Velocity from orignal source https://www.tradingview.com/v/4VKd87zy/
## Upper Study requested by @TradeUp
##
##
##
## V 1.0 :    @cos251 - Initial release of UPPER version per request from usethinkscript forum. Logic adopted from lower study
##       :    tweaking; thanks to @germanburrito for sharing AddChart() logic

declare upper;

input useHL          = no;
input price          = close;
input fastLength     = 14;
input slowLength     = 55;
input smooth         = 10;
#input showDivergence = yes;
input paintBars      = yes;


def fastRSI = reference RSI(length = fastLength, price = price);
def slowRSI = reference RSI(length = slowLength, price = price);

def smoothFastRSI = MovingAverage(AverageType.WILDERS,fastRSI,smooth);
def smoothSlowRSI = MovingAverage(AverageType.WILDERS,slowRSI,smooth);

def rsiHigh = if useHL then Max(RSI(length = fastLength, price = high),RSI(length=slowLength,price = high)) else MAX(fastRSI,slowRSI);
def rsiLow = if useHL then MIN(RSI(length=fastLength,price=low),RSI(length=slowLength,price=low)) else MIN(fastRSI,slowRSI);

def isBull = smoothFastRSI >= smoothSlowRSI;
def isExp = AbsValue(smoothFastRSI-smoothSlowRSI) >= AbsValue(smoothFastRSI[1]-smoothSlowRSI[1]);

def o = smoothSlowRSI;
def h = rsiHigh;
def l = rsiLow;
def c = smoothFastRSI;

AssignPriceColor(if paintBars and o < c and isBull and isExp then Color.GREEN else if paintBars and o > c and !isBull and !isExp then Color.CYAN else if paintBars and o > c and !isBull then Color.RED else if paintBars then Color.PINK else Color.CURRENT);
Video Tutorial
Attachments

Last edited by a moderator:
")