Archived: TMO True Momentum Oscillator

Status
Not open for further replies.

Join useThinkScript to post your question to a community of 21,000+ developers and traders.

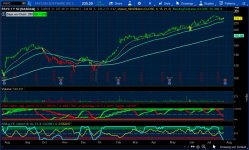
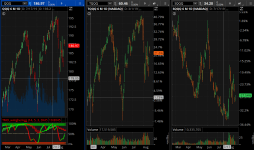
My longer term chart…

Shareable Code: https://tos.mx/bc1Hwy
3JmURbUh.jpg

Hello Markos,
Your chart layout looks incredible! You had replied to a previous question I had as to which indicators/oscillators might be the most useful to swing trade index ETFs long and short on the daily timeframe. Thank you! I'm just trying to catch the major trend moves up and down. With that said, if you were to pick RSI Laguerre or the True Momentum Oscillator, which would you pick? They appear to both be amazing indicators but I'm not sure which may be better for my intended purpose. I'm trying to make this as simple as possible.

There isn't really a tutorial on the TMO so I was hoping you could answer some questions using your chart as an example. Using the Aggregation set to (WEEK) but on a daily chart, is the idea to simply go long when it turns green and go short when it turns red? Or is there more to it than that? Same question but for the Aggregation set to (DAY) and also using a daily chart. For my purposes, would you suggest changing the settings to 21,5,3 for either the (WEEK) or (DAY) Aggregation?

I cannot thank you enough Markos for providing any insight into these questions. I am very grateful for your help!
 

Attachments

  • 3JmURbUh.jpg
    3JmURbUh.jpg
    128.2 KB · Views: 271
Hello Markos,
Your chart layout looks incredible! You had replied to a previous question I had as to which indicators/oscillators might be the most useful to swing trade index ETFs long and short on the daily timeframe. Thank you! I'm just trying to catch the major trend moves up and down. With that said, if you were to pick RSI Laguerre or the True Momentum Oscillator, which would you pick? They appear to both be amazing indicators but I'm not sure which may be better for my intended purpose. I'm trying to make this as simple as possible.

There isn't really a tutorial on the TMO so I was hoping you could answer some questions using your chart as an example. Using the Aggregation set to (WEEK) but on a daily chart, is the idea to simply go long when it turns green and go short when it turns red? Or is there more to it than that? Same question but for the Aggregation set to (DAY) and also using a daily chart. For my purposes, would you suggest changing the settings to 21,5,3 for either the (WEEK) or (DAY) Aggregation?

I cannot thank you enough Markos for providing any insight into these questions. I am very grateful for your help!
@David45 Please fill out your signature so all know how to help you. I don't understand how a person can swing trade on a daily chart; I invest for longer than a week at a time. Need to know the type of ETF's you are looking at.

I can tell you that I have never met a Day Trader that just looked at a chart after market close, only to put an order in to Buy in the morning. If that is the case, I would not want to enable what I see as a train wreck. Really! @BenTen please give your thoughts. I'll be back tonight or sometime this weekend. We cannot give investing advice, but we can steer you in an area that may suit you. Thanks, Markos
 
Last edited:
@David45 Someone in the chat recently shared this so I'm dropping it here just in case it could be helpful to you and everyone else.

When @hurricane5 was asked about using the TMO indicator for trading:

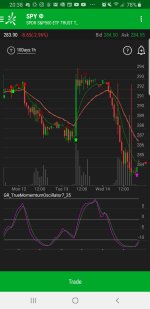
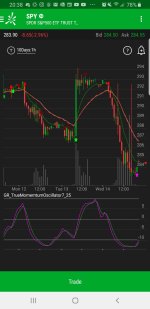
TMO... i just use the standard settings. Don't get the fancy color wedges, but once the lines cross, it's a pretty good indicator of trend reversal. The SMA cross is what triggers the alert, and if TMO is at the top or bottom of the scale, I'm confident jumping in. If only TW had trailing stops, I'd be set...

6d4pTlg.jpg
 

Attachments

  • 6d4pTlg.jpg
    6d4pTlg.jpg
    382.8 KB · Views: 226
Hi Markos,

Thank you for your reply and I'm sorry for the confusion. I am definitely not a day trader. Like you, when I take a position in an ETF it is usually for longer than a week at a time. I'm trying to capture the major moves up and down in the Nasdaq 100 using the triple ETFs TQQQ (long) and SQQQ (short/inverse). My current trading system is very simple. When the Fisher Transform (21 Period) is below zero I go short, when it's above zero I go long. So from early October 2018 to present I only had 5 trades total (short, long, short, long, short). The problem with the Fisher Transform (21) is that it gets me into the trend a bit late on both the short and long side and can sometimes gives false signals or whipsaws where it will pop above or below zero for just a few days.

I mention the daily time frame because I use the Fisher Transform (21) on the Nasdaq 100 daily chart. I check it daily when I come home from work in the evenings. So for example, when I come come from work, I open my daily chart of the Nasdaq 100 and check to see if the Fisher Transform is green (above zero) or red (below zero). If I am currently long and the Fisher Transform is green, I remain long via TQQQ. If I am currently short and the Fisher Transform is red, I remain short via SQQQ. But if it changes from the previous day from green to red for example, then the next day at the open I will sell my position in TQQQ and buy SQQQ which is the inverse.

So I am trying to find a better indicator/oscillator and strategy that will help me get into the trend earlier both long and short, and most importantly eliminate as many of the false signals and whipsaws as possible. It looks as though the TMO might be useful for this when the Aggregation is set to (WEEK) but used on the daily chart of the Nasdaq 100. Although I'm not sure if it's as simple as going/staying long when it's green or going/staying short when it's red? Are there any other nuances to using it for my intended strategy? Would the TMO with (DAY) Aggregation on the daily chart of the Nasdaq 100 also be useful for my intended strategy? It seems to be more prone to false signals and whipsaws if simply using it to go long when it's green and short when it's red.

Thanks very much in advance for any insights you can provide!
Take a look closely at the chart that @BenTen attached yesterday. Markets are Fractal, thus, if one could ignore the after hours showing, it could pass for a daily or weekly chart.

Notice that PRICE is the ULTIMATE indicator! When the fake crossover happened on early Tuesday morning, the trend of the stock was down.

Then before the market opened on Tuesday, the TMO crossed over again. This time it worked.
The little Nuance to see here is that the second divergence was with the 2nd bottom of the TMO cross higher, TMO moving up while the stock was still in a downtrend.

Keep daily on daily and put weekly on weekly aggregations and just observe. They will just jump out at you after a while.
Have you read all of the TMO AND RSI Laguerre information in the Tutorials section? Please do that.
There is discussion of TMO inside some of the RSILg info. Gotta run.
 
Thank you for this indicator! I use MTF analysis for all of my trading decisions. I day trade and don't usually hold overnight. I follow primarily the hourly trend and buy dips whichever way that may trending both long and short. So I buy the dips - but many times they are countertrend to the daily and weekly if the hourly or 30 min is moving strongly against the daily during a correction. This allows me to pick up a lot of short trades during corrective dips - and then switch back back long at the hourly trend reversal and go long and join in with the daily and weekly uptrend.

I usually use a simple MTF 9EMA chart indicator I created for all time frames plotted together onto my 1 minute and 5 minute charts (stairsteps lines of the higher timeframe 9 Ema's. But this true momentum study being a lower study and adding multiple instances as suggested gives me the same effect - actually better - and cleans up my charts. I have Daily, Hour, and 15 min aggregations combined as 1 lower indicator. This will be very useful and looking back it basically does the same thing I do with my chart, time aggregated, 9 ema line plots and strategy, but actually better and with less clutter.

Thanks again! Love the indicator!
 
Hi @leakywaders I'm happy that you like the indicator. If you haven't read the different Tutorials, please do. Add to it if you find you are able. :)
For those that don't know, the TMO follows the Delta of Price vs Price itself. Pretty cool. 😎

Please share your chart with a link so others may be inspired or encouraged to see yet another way to Day Trade. Thanks for the community @BenTen 👍
 
Take a look closely at the chart that @BenTen attached yesterday. Markets are Fractal, thus, if one could ignore the after hours showing, it could pass for a daily or weekly chart.

Notice that PRICE is the ULTIMATE indicator! When the fake crossover happened on early Tuesday morning, the trend of the stock was down.

Then before the market opened on Tuesday, the TMO crossed over again. This time it worked.
The little Nuance to see here is that the second divergence was with the 2nd bottom of the TMO cross higher, TMO moving up while the stock was still in a downtrend.

Keep daily on daily and put weekly on weekly aggregations and just observe. They will just jump out at you after a while.
Have you read all of the TMO AND RSI Laguerre information in the Tutorials section? Please do that.
There is discussion of TMO inside some of the RSILg info. Gotta run.
Hi Markos,
Thank you very much for your reply! You had mentioned on a previous post that the TMO is traded at the polarity change signal, not the zero line. I am a visual learner so I was wondering if you could post an image of what you mean by this? It would also be really helpful to see an image of how you determine if a signal is false as you mentioned above. Very much appreciated!
@David45 Give me a while, it may be a week. Just got my cpu back from HP repair. I have to rebuild everything.

In the mean time, please peruse the Tutorials Section. Also, put it on a 1 year daily chart and just observe. That's the best way. IMO, the TMO Daily can drop to -10 and still be valid if it then changes to green and the weekly TMO still looks healthy.

btw, put your triple levered tickers in and look what happened to them on August 24th, 2015. Then look at the whole time frame of the past 5 years.
3x and 2x funds reset at the end of each day. I trust you know what you're playing with... studies that can be googled have show some where both the bull and bear fund have each lost 50% over one year.
 
Just was answering an inquiry about Ultimate RSI and saw this discussion. @David45 As far as I know the polarity change is shown by the change from red to green or vice versa. Anyway I put the TMO standard settings on the example chart I made. Very similar studies. Just goes to show, the numbers can only be manipulated so far before it all becomes the same.

87X8wfB.png
 
@David45 Give me a while, it may be a week. Just got my cpu back from HP repair. I have to rebuild everything.

In the mean time, please peruse the Tutorials Section. Also, put it on a 1 year daily chart and just observe. That's the best way. IMO, the TMO Daily can drop to -10 and still be valid if it then changes to green and the weekly TMO still looks healthy.

btw, put your triple levered tickers in and look what happened to them on August 24th, 2015. Then look at the whole time frame of the past 5 years.
3x and 2x funds reset at the end of each day. I trust you know what you're playing with... studies that can be googled have show some where both the bull and bear fund have each lost 50% over one year.
Thank you Markos! I'm sorry you had to rebuild your computer. As a follow up question, I was wondering if you know what causes the TMO to change from red to green and green to red?
 
@David45 Someone in the chat recently shared this so I'm dropping it here just in case it could be helpful to you and everyone else.

When @hurricane5 was asked about using the TMO indicator for trading:


6d4pTlg.jpg
Thank you for posting this BenTen. My version of TMO has red and green colored wedges so I'm a bit confused as to what he's saying here. He says the SMA cross is what triggers the alert. So in the example above is the TMO the green line and the SMA the purple line? If so, any idea what time period he is using for the SMA? Thank you!
 

Attachments

  • 6d4pTlg.jpg
    6d4pTlg.jpg
    382.8 KB · Views: 221
@David45 I believe he is using the TMO as confirmation for his SMA crossover on the chart. I do not know which inputs he’s using. The reg/green you see on the TMO is also due to the crossover but from the TMO itself. If you use the indicator on the ToS app you won’t see the fancy red and green wedges.
 
@David45 I believe he is using the TMO as confirmation for his SMA crossover on the chart. I do not know which inputs he’s using. The reg/green you see on the TMO is also due to the crossover but from the TMO itself. If you use the indicator on the ToS app you won’t see the fancy red and green wedges.
Got it! Thank you BenTen.
 
Got it! Thank you BenTen.
@David45 Please use the Original codes on pages 1 & 2. There are NO wedges in the shared code and it's code has the EMA in it. My charts are mostly EMA as well.
Also, the Math for Delta of Price is above my pay grade. The author is a humble Phd Math Professor.
The "fold" expression in the code is where the "smarts" of the code also comes from. After that comes the EMA and the smoothing factors.
I don't want to figure out how the options market mathematically figures Delta of Price, so I just follow Mobius, the author.

I hope that helps! Good trading to you!
 
Hi Markos,
Thank you very much for your reply! You had mentioned on a previous post that the TMO is traded at the polarity change signal, not the zero line. I am a visual learner so I was wondering if you could post an image of what you mean by this? It would also be really helpful to see an image of how you determine if a signal is false as you mentioned above. Very much appreciated!
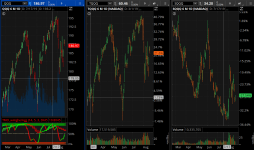
@David45 I'm a visual learner too. Please load this and save as a grid. Notice the difference between actual moves & counter trend moves.

https://tos.mx/iVv3Wy
MU0RphZ.png
 

Attachments

  • MU0RphZ.png
    MU0RphZ.png
    138.9 KB · Views: 212
@David45 I'm a visual learner too. Please load this and save as a grid. Notice the difference between actual moves & counter trend moves.

https://tos.mx/iVv3Wy
MU0RphZ.png
Thank you Markos for posting the pictures! It's easier for me to understand when I see it on a chart. I am going to try using the chart that you shared at the beginning of this thread minus the RSI Laguerre. So I'm just going to focus on TMO (Day), TMO (Week) and Slim Ribbon candlesticks to keep it simple. Would you mind explaining how you use them all together to decide whether or not to take a signal? For example, is it when the TMO (DAY), TMO (WEEK) and Slim Ribbon candlestick are all red that you would go short? I'm sure there is much more to it than that but just trying to understand better how you use these indicators collectively on you chart.

Also regarding the actual moves and counter trend moves shown above, how do you determine if the signal is false? I feel like there is some light at the end of the tunnel so thank you so much for your insights!
 

Attachments

  • MU0RphZ.png
    MU0RphZ.png
    138.9 KB · Views: 201
@David45 Let me say this again. Please load this 3 Grid Chart into ThinkorSwim and Observe. Watch if for a week.

Notice the difference between actual moves & counter trend moves. Please look at the indicator and the price chart and see what is happening.

If you need some assistance with reading charts, ask after you've done your due diligence.

Did you read all of the Tutorials that mention both TMO and RSI Laguerre? I have written on both in either the TMO or RSI Laguerre Threads.
Please use the search bar to find all instances.

I have written extensively on both topics in the Indicator and Tutorial Sections. If you have read them, please do it again.

There is even a video on the Slim Ribbon. Please find it and review it several times. The Ribbon is for Trend, the other 2 are similar for Momentum.

If your intention is to "mess" with Triple Levered ETF's, someone braver than I will have to tell you how they would go about trading them. Thanks.
 
Status
Not open for further replies.

Similar threads

Not the exact question you're looking for?

Start a new thread and receive assistance from our community.

87k+ Posts
687 Online
Create Post

Similar threads

Similar threads

The Market Trading Game Changer

Join 2,500+ subscribers inside the useThinkScript VIP Membership Club
  • Exclusive indicators
  • Proven strategies & setups
  • Private Discord community
  • ‘Buy The Dip’ signal alerts
  • Exclusive members-only content
  • Add-ons and resources
  • 1 full year of unlimited support

Frequently Asked Questions

What is useThinkScript?

useThinkScript is the #1 community of stock market investors using indicators and other tools to power their trading strategies. Traders of all skill levels use our forums to learn about scripting and indicators, help each other, and discover new ways to gain an edge in the markets.

How do I get started?

We get it. Our forum can be intimidating, if not overwhelming. With thousands of topics, tens of thousands of posts, our community has created an incredibly deep knowledge base for stock traders. No one can ever exhaust every resource provided on our site.

If you are new, or just looking for guidance, here are some helpful links to get you started.

What are the benefits of VIP Membership?
VIP members get exclusive access to these proven and tested premium indicators: Buy the Dip, Advanced Market Moves 2.0, Take Profit, and Volatility Trading Range. In addition, VIP members get access to over 50 VIP-only custom indicators, add-ons, and strategies, private VIP-only forums, private Discord channel to discuss trades and strategies in real-time, customer support, trade alerts, and much more. Learn all about VIP membership here.
How can I access the premium indicators?
To access the premium indicators, which are plug and play ready, sign up for VIP membership here.
Back
Top