Anchored VWAP Indicator for ThinkorSwim

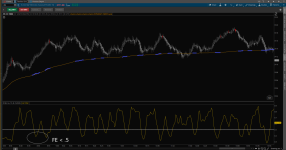
I know this sounds crazy but hear me out. I would like to color code the intraday VWAP according to Fractal Energy. When FE falls below .5, I would like the VWAP to be Color A and then Color B for all other levels. Essentially the same way a Hull MA shifts colors. I've attempted to recreate what I am searching for in the screenshot below. When FE falls below .5, VWAP changes to blue. Tried to do it myself but couldn't find a solution (I have no idea what I'm doing). I really hope this is possible. Any help is greatly appreciated🤙

I have already merged the two here: https://tos.mx/6XSCJKd

g7Q9eTK.png


C2U3oY8.png


Code:
#yakBro intraday anchoredVWAP excluding extended hours volume 2019

declare upper;

def anchorTime = 0930;
def anchorEnd = 1600;

input ShowTodayOnly = yes;
def Today = if GetDay() == GetLastDay() then 1 else 0;
def postAnchorTime = if SecondsFromTime(anchorTime) >= 0 then 1 else 0;
def endAchorTime = if SecondsTillTime(anchorEnd) >= 0 then 1 else 0;

#plot anchorVWAP for intraday
def  volumeSum = CompoundValue(1, if postAnchorTime and endAchorTime then volumeSum[1] + volume else 0, volume);
def  volumeVwapSum = CompoundValue(1, if postAnchorTime and endAchorTime then volumeVwapSum[1] + volume * vwap else 0, volume * vwap);

plot anchorVWAP = if ShowTodayOnly and !Today then Double.NaN else if anchorTime then volumeVwapSum / volumeSum else Double.NaN;
anchorVWAP.SetStyle(Curve.FIRM);
anchorVWAP.SetLineWeight(2);


anchorVWAP.DefineColor("Up", GetColor(1));
anchorVWAP.DefineColor("Down", GetColor(0));
anchorVWAP.AssignValueColor(if gamma < .5 then anchorVWAP.Color("Down") else anchorVWAP.Color("Up"));


#Inputs:
input nFE = 8;#hint nFE: length for Fractal Energy calculation.
input AlertOn = no;
input Glength  = 13;
input betaDev =  8;
input data = close;

def w = (2 * Double.Pi / Glength);
def beta = (1 - Cos(w)) / (Power(1.414, 2.0 / betaDev) - 1 );
def alpha = (-beta + Sqrt(beta * beta + 2 * beta));
def Go = Power(alpha, 4) * open +
             4 * (1 – alpha) * Go[1] – 6 * Power( 1 - alpha, 2 ) * Go[2] +
             4 * Power( 1 - alpha, 3 ) * Go[3] - Power( 1 - alpha, 4 ) * Go[4];
def Gh = Power(alpha, 4) * high +
             4 * (1 – alpha) * Gh[1] – 6 * Power( 1 - alpha, 2 ) * Gh[2] +
             4 * Power( 1 - alpha, 3 ) * Gh[3] - Power( 1 - alpha, 4 ) * Gh[4];
def Gl = Power(alpha, 4) * low +
             4 * (1 – alpha) * Gl[1] – 6 * Power( 1 - alpha, 2 ) * Gl[2] +
             4 * Power( 1 - alpha, 3 ) * Gl[3] - Power( 1 - alpha, 4 ) * Gl[4];
def Gc = Power(alpha, 4) * data +
             4 * (1 – alpha) * Gc[1] – 6 * Power( 1 - alpha, 2 ) * Gc[2] +
             4 * Power( 1 - alpha, 3 ) * Gc[3] - Power( 1 - alpha, 4 ) * Gc[4];
# Variables:
def o;
def h;
def l;
def c;
def CU1;
def CU2;
def CU;
def CD1;
def CD2;
def CD;
def L0;
def L1;
def L2;
def L3;


# Calculations
o = (Go + Gc[1]) / 2;
h = Max(Gh, Gc[1]);
l = Min(Gl, Gc[1]);
c = (o + h + l + Gc) / 4;
def gamma = Log(Sum((Max(Gh, Gc[1]) - Min(Gl, Gc[1])), nFE) /
        (Highest(Gh, nFE) - Lowest(Gl, nFE)))
            / Log(nFE);

L0 = (1 – gamma) * Gc + gamma * L0[1];
L1 = -gamma * L0 + L0[1] + gamma * L1[1];
L2 = -gamma * L1 + L1[1] + gamma * L2[1];
L3 = -gamma * L2 + L2[1] + gamma * L3[1];
if L0 >= L1
then {
    CU1 = L0 - L1;
    CD1 = 0;
} else {
    CD1 = L1 - L0;
    CU1 = 0;
}
if L1 >= L2
then {
    CU2 = CU1 + L1 - L2;
    CD2 = CD1;
} else {
    CD2 = CD1 + L2 - L1;
    CU2 = CU1;
}
if L2 >= L3
then {
    CU = CU2 + L2 - L3;
    CD = CD2;
} else {
    CU = CU2;
    CD = CD2 + L3 - L2;
}
 

Attachments

  • g7Q9eTK.png
    g7Q9eTK.png
    250.7 KB · Views: 120
  • C2U3oY8.png
    C2U3oY8.png
    374.8 KB · Views: 140

Join useThinkScript to post your question to a community of 21,000+ developers and traders.

Without looking too closely, you are using gamma before it is defined. I just moved the vwap plot t o the bottom.

Code:
#yakBro intraday anchoredVWAP excluding extended hours volume 2019

declare upper;

def anchorTime = 0930;
def anchorEnd = 1600;

input ShowTodayOnly = yes;
def Today = if GetDay() == GetLastDay() then 1 else 0;
def postAnchorTime = if SecondsFromTime(anchorTime) >= 0 then 1 else 0;
def endAchorTime = if SecondsTillTime(anchorEnd) >= 0 then 1 else 0;

#plot anchorVWAP for intraday
def  volumeSum = CompoundValue(1, if postAnchorTime and endAchorTime then volumeSum[1] + volume else 0, volume);
def  volumeVwapSum = CompoundValue(1, if postAnchorTime and endAchorTime then volumeVwapSum[1] + volume * vwap else 0, volume * vwap);


#Inputs:
input nFE = 8;#hint nFE: length for Fractal Energy calculation.
input AlertOn = no;
input Glength  = 13;
input betaDev =  8;
input data = close;

def w = (2 * Double.Pi / Glength);
def beta = (1 - Cos(w)) / (Power(1.414, 2.0 / betaDev) - 1 );
def alpha = (-beta + Sqrt(beta * beta + 2 * beta));
def Go = Power(alpha, 4) * open +
             4 * (1 – alpha) * Go[1] – 6 * Power( 1 - alpha, 2 ) * Go[2] +
             4 * Power( 1 - alpha, 3 ) * Go[3] - Power( 1 - alpha, 4 ) * Go[4];
def Gh = Power(alpha, 4) * high +
             4 * (1 – alpha) * Gh[1] – 6 * Power( 1 - alpha, 2 ) * Gh[2] +
             4 * Power( 1 - alpha, 3 ) * Gh[3] - Power( 1 - alpha, 4 ) * Gh[4];
def Gl = Power(alpha, 4) * low +
             4 * (1 – alpha) * Gl[1] – 6 * Power( 1 - alpha, 2 ) * Gl[2] +
             4 * Power( 1 - alpha, 3 ) * Gl[3] - Power( 1 - alpha, 4 ) * Gl[4];
def Gc = Power(alpha, 4) * data +
             4 * (1 – alpha) * Gc[1] – 6 * Power( 1 - alpha, 2 ) * Gc[2] +
             4 * Power( 1 - alpha, 3 ) * Gc[3] - Power( 1 - alpha, 4 ) * Gc[4];
# Variables:
def o;
def h;
def l;
def c;
def CU1;
def CU2;
def CU;
def CD1;
def CD2;
def CD;
def L0;
def L1;
def L2;
def L3;


# Calculations
o = (Go + Gc[1]) / 2;
h = Max(Gh, Gc[1]);
l = Min(Gl, Gc[1]);
c = (o + h + l + Gc) / 4;
def gamma = Log(Sum((Max(Gh, Gc[1]) - Min(Gl, Gc[1])), nFE) /
        (Highest(Gh, nFE) - Lowest(Gl, nFE)))
            / Log(nFE);

L0 = (1 – gamma) * Gc + gamma * L0[1];
L1 = -gamma * L0 + L0[1] + gamma * L1[1];
L2 = -gamma * L1 + L1[1] + gamma * L2[1];
L3 = -gamma * L2 + L2[1] + gamma * L3[1];
if L0 >= L1
then {
    CU1 = L0 - L1;
    CD1 = 0;
} else {
    CD1 = L1 - L0;
    CU1 = 0;
}
if L1 >= L2
then {
    CU2 = CU1 + L1 - L2;
    CD2 = CD1;
} else {
    CD2 = CD1 + L2 - L1;
    CU2 = CU1;
}
if L2 >= L3
then {
    CU = CU2 + L2 - L3;
    CD = CD2;
} else {
    CU = CU2;
    CD = CD2 + L3 - L2;
}

plot anchorVWAP = if ShowTodayOnly and !Today then Double.NaN else if anchorTime then volumeVwapSum / volumeSum else Double.NaN;
anchorVWAP.SetStyle(Curve.FIRM);
anchorVWAP.SetLineWeight(2);


anchorVWAP.DefineColor("Up", GetColor(1));
anchorVWAP.DefineColor("Down", GetColor(0));
anchorVWAP.AssignValueColor(if gamma < .5 then anchorVWAP.Color("Down") else anchorVWAP.Color("Up"));
 
If I am Pacific Time, I assume I should change the code to define start and end times as 6:30 and 13:00, correct?
 
I'm trying to create an anchored VWAP indicator that would work for futures extended hours. The idea is to specify an input anchor time using 24-hour clock notation in the EST timezone. The VWAP would start plotting each day at the anchor time, which may or may not be on the previous calendar day, and may be in either the extended or regular hours session. The VWAP would stop plotting each day at the time specified by the RegularTradingEnd method. This should work no matter the specific futures contract being plotted nor the trading hours of the contract.

For example, for the /ES contract I believe the extended hours of a trading day starts at 6:00 pm the previous calendar day and runs through 9:30 am, and the regular hours session runs from 9:30 am to 5:00 pm. So, an anchor time anywhere from 1800 (previous calendar day) to 1659 would plot until 5:00 pm (1700), and then the VWAP would start over the next day again anchored at the same anchor time for the next day.

The problem I'm having is identifying the correct bars on which to calculate the VWAP.

Does anyone have any tips on how this can be accomplished?
 
Last edited:
This seems to work reasonably well...
Code:
declare hide_on_daily;

input numDevDn = -2.0;
input numDevUp = 2.0;

input shouldPlotDevDn = yes;
input shouldPlotDevUp = yes;

# The default is TOS' vwap, but could use CLOSE, OHLC4, or some other price.
input vwap_Type = vwap;

input anchorTimeEastern = 2100;

# This specifies whether the current time is after the anchor time in
# the current calendar day (not after the anchor time within
# the current trading day).
def afterAnchorTime = SecondsFromTime(anchorTimeEastern) >= 0;

# Counts the number of bars since the previous trading day.
# The first bar of the new day will equal 1.
# Iterates from the current bar backward up to 1600 bars (more
# than then number of minutes in a day) counting each bar until
# the current bar is a different trading day.
def barCountFromPreviousTradingDay =
 fold relativeBarIndex = 0 to 1600
  with barCount = 1
   while GetValue(GetYYYYMMDD(), relativeBarIndex) == GetValue(GetYYYYMMDD(), relativeBarIndex + 1)
   do barCount + 1;

# Counts the number of bars since the anchor time.
# The first bar whose start time is greater than or equal
# to the anchor time will equal zero.
def barCountFromAnchorTime =
 fold relativeBarIndex_at = 0 to 1600
  with barCount_fromAnchorTime
   while GetValue(SecondsFromTime(anchorTimeEastern), relativeBarIndex_at) > 0
   do barCount_fromAnchorTime + 1;

# Since afterAnchorTime only checks to see if the current bar is after the anchor
# time of the current calendar day, this variable is needed to track whether after
# the anchor time within the current trading day (which includes regular and
# extended hours). To be true, the bar has to be after the anchor time of the current
# calendar day and that anchor time cannot be in the previous trading day.
# To account for anchor times in the previous calendar day that are not in the
# previous trading day (i.e. valid to plot), the second line will continue plotting
# once started until the trading day changes.
def shouldPlot_VWAP =
 (afterAnchorTime and (barCountFromPreviousTradingDay > barCountFromAnchorTime)) or
 (shouldPlot_VWAP[1] and barCountFromPreviousTradingDay != 1);

# If previous bar didn't plot VWAP, but current bar should, then this is the
# first bar after a valid anchor time. The OR conditional is needed to handle
# the situation where the anchor time is the first bar of the trading day,
# because the previous bar would have been plotted as well in that scenario.
def isFirstBarAfterAnchorTime =
 CompoundValue(
  1,
  (shouldPlot_VWAP != shouldPlot_VWAP[1]) or (shouldPlot_VWAP and barCountFromPreviousTradingDay == 1),
  yes);

def volumeSum;
def volumeVwapSum;
def volumeVwap2Sum;

# Basically TOS' VWAP study calculation below

if (isFirstBarAfterAnchorTime) {
    volumeSum = volume;
    volumeVwapSum = volume * vwap_Type;
    volumeVwap2Sum = volume * Sqr(vwap_Type);
} else {
    volumeSum = CompoundValue(1, volumeSum[1] + volume, volume);
    volumeVwapSum = CompoundValue(1, volumeVwapSum[1] + volume * vwap_Type, volume * vwap_Type);
    volumeVwap2Sum = CompoundValue(1, volumeVwap2Sum[1] + volume * Sqr(vwap_Type), volume * Sqr(vwap_Type));
}

plot VWAP = if shouldPlot_VWAP then (volumeVwapSum / volumeSum) else Double.NaN;
def deviation = Sqrt(Max(volumeVwap2Sum / volumeSum - Sqr(VWAP), 0));

#plot VWAP = price;
plot UpperBand = if shouldPlotDevUp then VWAP + numDevUp * deviation else Double.NaN;
plot LowerBand = if shouldPlotDevDn then VWAP + numDevDn * deviation else Double.NaN;

VWAP.SetDefaultColor(Color.CYAN);
UpperBand.SetDefaultColor(Color.GRAY);
LowerBand.SetDefaultColor(Color.GRAY);

VWAP.SetLineWeight(3);
UpperBand.SetLineWeight(1);
LowerBand.SetLineWeight(1);
 
@mike01 Welcome to useThinkScript! TOS is an amazing platform and this site has worldwide readership.
This site also has loads of day traders so you're in the right place. (y) Look at the bottom of the page for matches.
As you are new here, this is what we suggest: Look at the bottom of the page for matches.
Go to the Tutorials section here > https://usethinkscript.com/forums/tutorials.4/
Also type VWAP in our great SEARCH engine above. There are many available between these three sources. Best wishes!
 
Tried it but the indicator only shows when market opens? Is there an Anchored VWAP to use on futures where it shows not only during market opens?
 
Can any1 help with a scanner for stocks touching previous days vwap
Last=previousVWAP
thanks


Here is a scan for stocks that crosses ABOVE the previous day's VWAP. Place this code in the scanner and run this on a daily aggregation. I just ran this on the S&P 100 (Daily) and obtained 46 results

Code:
# Scan for crosses above previous day's VWAP
# tomsk
# 1.21.2020

# Run on a daily aggregation

def cap = getAggregationPeriod();
def yyyyMmDd = getYyyyMmDd();
def periodIndx = yyyyMmDd;
def isPeriodRolled = compoundValue(1, periodIndx != periodIndx[1], yes);

def volumeSum;
def volumeVwapSum;
def volumeVwap2Sum;

if (isPeriodRolled) {
    volumeSum = volume;
    volumeVwapSum = volume * vwap;
    volumeVwap2Sum = volume * Sqr(vwap);
} else {
    volumeSum = compoundValue(1, volumeSum[1] + volume, volume);
    volumeVwapSum = compoundValue(1, volumeVwapSum[1] + volume * vwap, volume * vwap);
    volumeVwap2Sum = compoundValue(1, volumeVwap2Sum[1] + volume * Sqr(vwap), volume * Sqr(vwap));
}
def price = volumeVwapSum / volumeSum;
def VWAP = price;

plot scan = close crosses above VWAP[1];
# End Scan for crosses above previous day's VWAP
 
I have just taken the original VWAP script from the OP and viewed it on my 5 minute chart. I there anyone with experience in this time frame with that script that can tell me if the Up and Down arrows print and then remove if the price action and volume changes? I have another script that does that so It's not very accurate on the 5 minute.
Does this one work out of the box on the 5 minute or is there something someone can suggest to find something or tweak this one to best suit my needs.
If this script paints the arrows where they currently appear on my charts for the 5 min, then this is awesome! I try to keep it simple and this just might be it. Going to test it tomorrow.
 

Similar threads

Not the exact question you're looking for?

Start a new thread and receive assistance from our community.

87k+ Posts
487 Online
Create Post

Similar threads

Similar threads

The Market Trading Game Changer

Join 2,500+ subscribers inside the useThinkScript VIP Membership Club
  • Exclusive indicators
  • Proven strategies & setups
  • Private Discord community
  • ‘Buy The Dip’ signal alerts
  • Exclusive members-only content
  • Add-ons and resources
  • 1 full year of unlimited support

Frequently Asked Questions

What is useThinkScript?

useThinkScript is the #1 community of stock market investors using indicators and other tools to power their trading strategies. Traders of all skill levels use our forums to learn about scripting and indicators, help each other, and discover new ways to gain an edge in the markets.

How do I get started?

We get it. Our forum can be intimidating, if not overwhelming. With thousands of topics, tens of thousands of posts, our community has created an incredibly deep knowledge base for stock traders. No one can ever exhaust every resource provided on our site.

If you are new, or just looking for guidance, here are some helpful links to get you started.

What are the benefits of VIP Membership?
VIP members get exclusive access to these proven and tested premium indicators: Buy the Dip, Advanced Market Moves 2.0, Take Profit, and Volatility Trading Range. In addition, VIP members get access to over 50 VIP-only custom indicators, add-ons, and strategies, private VIP-only forums, private Discord channel to discuss trades and strategies in real-time, customer support, trade alerts, and much more. Learn all about VIP membership here.
How can I access the premium indicators?
To access the premium indicators, which are plug and play ready, sign up for VIP membership here.
Back
Top