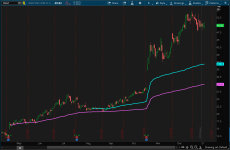
Anchored VWAP indicator can useful for intraday trading. It can also be used on any timeframe including hourly, daily, and weekly. VWAP can be a great tool for analyzing the market, especially for day traders.
A strong uptrend is signaled when the price consistently stays above the VWAP and the VWAP itself is sloping upward. In a downtrend, the price tends to stay below the VWAP, which is also sloping downward.
When the price strays too far from the VWAP, there is an expectation that it will eventually move back towards the average.
Here we have different Anchored VWAP indicators for ThinkorSwim. Feel free to test them out and use any that fits your trading style.

Shareable Link: https://tos.mx/ICxmA7

Shareable Link: https://tos.mx/s17BmB
A strong uptrend is signaled when the price consistently stays above the VWAP and the VWAP itself is sloping upward. In a downtrend, the price tends to stay below the VWAP, which is also sloping downward.
When the price strays too far from the VWAP, there is an expectation that it will eventually move back towards the average.
Here we have different Anchored VWAP indicators for ThinkorSwim. Feel free to test them out and use any that fits your trading style.
Anchored VWAP with adjustable date and time
Code:
input anchorDate = 20200422;
input anchorTime = 2030;

def tradeStartEST = 0930;
def tradeEndEST = 1600;
def inPeriod = if SecondsTillTime(tradeStartEST) <= 0 and SecondsTillTime(tradeEndEST) > 0 then 1 else 0;

def revisedDate = if SecondsTillTime(anchorTime)<=0 and !inPeriod then anchorDate+1 else if SecondsTillTime(anchorTime)<=0 and inPeriod then anchorDate else anchorDate;

def postAnchorDate = if GetYYYYMMDD() >= revisedDate then 1 else 0;
def postAnchorTime = if SecondsTillTime(anchorTime) <= 0 then 1 else 0;

plot anchoredVWAP = TotalSum(if postAnchorDate and postAnchorTime then ((high+low+close)/3)*(volume) else 0)/TotalSum(if postAnchorDate and postAnchorTime then volume else 0);

anchoredVWAP.setStyle(Curve.Firm);
anchoredVWAP.SetLineWeight(3);
anchoredVWAP.SetDefaultColor(Color.Cyan);

#AddChartBubble(yes,close, revisedDate, color.yellow);
Intraday Anchored VWAP
link for my intraday anchored VWAP script (shared by yakbrodev)
Code:
#yakBro intraday anchoredVWAP excluding extended hours volume 2019

declare hide_on_daily;

def anchorTime = 0930;
def anchorEnd = 1600;

input ShowTodayOnly = yes;
def Today = if GetDay() == GetLastDay() then 1 else 0;
def postAnchorTime = if SecondsFromTime(anchorTime) >= 0 then 1 else 0;
def endAchorTime = if SecondsTillTime(anchorEnd) >= 0 then 1 else 0;

#plot anchorVWAP for intraday
def  volumeSum = compoundValue(1, if postAnchorTime and endAchorTime then volumeSum[1] + volume else 0, volume);
def  volumeVwapSum = compoundValue(1, if postAnchorTime and endAchorTime then volumeVwapSum[1] + volume * vwap else 0, volume * vwap);

plot anchorVWAP = if ShowTodayOnly and !Today then Double.NaN else if anchorTime then volumeVwapSum / volumeSum else Double.NaN;
anchorVWAP.setStyle(Curve.Firm);
anchorVWAP.setDefaultColor(Color.light_ORANGE);
anchorVWAP.setlineWeight(2);
Anchored VWAP Stops
Rich (BB code):
#START STUDY
#Anchored_VWAP_STOPS
#linus, 2014-03-10, v0.1

#hint: VWAP stops anchored off FractalTrader pivots.

#hint n: Lookback period for finding swing highs, lows.
input n = 20;

#hint ticks: Offset VWAP lines by this number of ticks.
input ticks = 2.0;

def bnOK = barNumber() > n;

def isHigher = fold i = 1 to n + 1 with p = 1
               while p do high > GetValue(high, -i);

def HH = if bnOK and isHigher
         and high == Highest(high, n)
         then high else Double.NaN;

def isLower = fold j = 1 to n + 1 with q = 1
              while q do low < GetValue(low, -j);

def LL = if bnOK and isLower
         and low == Lowest(low, n)
         then low else Double.NaN;

def PivH = if HH > 0 then HH else Double.NaN;
def PivL = if LL > 0 then LL else Double.NaN;

rec dir = compoundValue(1, if !isNaN(PivL) then 1 else if !isNaN(PivH) then -1 else dir[1], 0);

plot Up = dir crosses above 0;
Up.SetPaintingStrategy(PaintingStrategy.BOOLEAN_ARROW_UP);
Up.SetLineWeight(3);
Up.SetDefaultColor(Color.WHITE);

plot Dn = dir crosses below 0;
Dn.SetPaintingStrategy(PaintingStrategy.BOOLEAN_ARROW_DOWN);
Dn.SetLineWeight(3);
Dn.SetDefaultColor(Color.ORANGE);

def LocH = (high + (tickSize() * ticks)) * volume;
def LocL = (low - (tickSize() * ticks)) * volume;
rec PH;
rec VH;
rec PL;
rec VL;

if Dn {
    PH = LocH;
    VH = volume;
} else {
    PH = compoundValue(1, LocH + PH[1], Double.NaN);
    VH = compoundValue(1, volume + VH[1], Double.NaN);
}
if Up  {
    PL = LocL;
    VL = volume;
} else {
    PL = compoundValue(1, LocL + PL[1], Double.NaN);
    VL = compoundValue(1, volume + VL[1], Double.NaN);
}

plot VwapH = if Dn then Double.NaN else PH / VH;
plot VwapL = if Up then Double.NaN else PL / VL;

VwapH.SetDefaultColor(Color.DARK_RED);
VwapL.SetDefaultColor(Color.DARK_GREEN);
#END STUDY
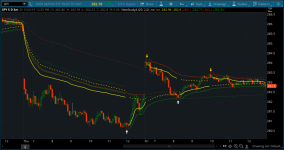
#Note: /ES 5m chart of the Anchored_VWAP_STOPS study.
Shareable Link: https://tos.mx/ICxmA7
VWAP Anchored_v02
Rich (BB code):
#START STUDY
#Anchored_VWAP2
#linus, 2014-03-10, v0.1

#10:24 linus: it carries over the previous pivot's lines for high, low and close. (it plots vwaps of the high, low and close that are reset each time a new pivot is found.)
#10:25 linus: i wrote it to experiment with vwap as stops. (the high and low vwaps that can be offset by the ticks input.)
#10:25 linus: but it should serve as an example of how to reset the vwaps based on a signal.
#10:35 linus: #hint: VWAP stops anchored off  fractalTrader pivots.
#10:37 linus: the code calculates the pivots as PivH and PivL, and then restarts the high, low and close vwaps when it finds a new pivot.  Otherwise it continues to calculate the high, low and close vwaps.
#10:37 linus: the dashed vwap plots are the saved from the previous pivot, and the solid vwap plots are since the last pivot.

#hint: VWAP stops anchored off  fractalTrader pivots.

#hint n: Lookback period for finding swing highs, lows.
input n = 20;

#hint ticks: Offset High/Low VWAP lines by this number of ticks.
input ticks = 2.0;

def bnOK = barNumber() > n;

def isHigher = fold i = 1 to n + 1 with p = 1
               while p do high > GetValue(high, -i);

def HH = if bnOK and isHigher
         and high == Highest(high, n)
         then high else Double.NaN;

def isLower = fold j = 1 to n + 1 with q = 1
              while q do low < GetValue(low, -j);

def LL = if bnOK and isLower
         and low == Lowest(low, n)
         then low else Double.NaN;

def PivH = if HH > 0 then HH else Double.NaN;
def PivL = if LL > 0 then LL else Double.NaN;

plot Up = !isNaN(PivL);
Up.SetPaintingStrategy(PaintingStrategy.BOOLEAN_ARROW_UP);
Up.SetLineWeight(3);
Up.SetDefaultColor(Color.WHITE);

plot Dn = !isNaN(PivH);
Dn.SetPaintingStrategy(PaintingStrategy.BOOLEAN_ARROW_DOWN);
Dn.SetLineWeight(3);
Dn.SetDefaultColor(Color.ORANGE);

def LocH = (high + (tickSize() * ticks)) * volume;
def LocL = (low - (tickSize() * ticks)) * volume;
def LocC = close * volume;

rec PC;
rec VC;
rec PC2;
rec VC2;
rec PH;
rec VH;
rec PL;
rec VL;
rec PH2;
rec VH2;
rec PL2;
rec VL2;

if Dn or Up {
    PC = LocC;
    VC = volume;
    PC2 = PC[1];
    VC2 = VC[1];
} else {
    PC = compoundValue(1, LocC + PC[1], Double.NaN);
    VC = compoundValue(1, volume + VC[1], Double.NaN);
    PC2 = compoundValue(1, LocC + PC2[1], Double.NaN);
    VC2 = compoundValue(1, volume + VC2[1], Double.NaN);
}

if Dn {
    PH = LocH;
    VH = volume;
    PH2 = PH[1];
    VH2 = VH[1];
} else {
    PH = compoundValue(1, LocH + PH[1], Double.NaN);
    VH = compoundValue(1, volume + VH[1], Double.NaN);
    PH2 = compoundValue(1, LocH + PH2[1], Double.NaN);
    VH2 = compoundValue(1, volume + VH2[1], Double.NaN);
}
if Up  {
    PL = LocL;
    VL = volume;
    PL2 = PL[1];
    VL2 = VL[1];
} else {
    PL = compoundValue(1, LocL + PL[1], Double.NaN);
    VL = compoundValue(1, volume + VL[1], Double.NaN);
    PL2 = compoundValue(1, LocL + PL2[1], Double.NaN);
    VL2 = compoundValue(1, volume + VL2[1], Double.NaN);
}

plot VwapC = if Dn or Up then Double.NaN else PC / VC;
plot VwapC2 = if Dn or Up then Double.NaN else PC2 / VC2;
plot VwapH = if Dn then Double.NaN else PH / VH;
plot VwapL = if Up then Double.NaN else PL / VL;
plot VwapH2 = if Dn then Double.NaN else PH2 / VH2;
plot VwapL2 = if Up then Double.NaN else PL2 / VL2;

VwapC.SetDefaultColor(Color.YELLOW);
VwapC.SetLineWeight(2);
VwapC.HideBubble();

VwapC2.SetDefaultColor(Color.YELLOW);
VwapC2.SetLineWeight(2);
VwapC2.SetStyle(Curve.SHORT_DASH);
VwapC2.HideBubble();

VwapH.SetDefaultColor(Color.DARK_RED);
VwapH.HideBubble();

VwapL.SetDefaultColor(Color.DARK_GREEN);
VwapL.HideBubble();

VwapH2.SetDefaultColor(Color.DARK_RED);
VwapH2.SetStyle(Curve.SHORT_DASH);
VwapH2.HideBubble();

VwapL2.SetDefaultColor(Color.DARK_GREEN);
VwapL2.SetStyle(Curve.SHORT_DASH);
VwapL2.HideBubble();
#END STUDY
Shareable Link: https://tos.mx/s17BmB
Video Tutorial
Attachments
Last edited by a moderator:


