
AsGoodAsItGets Pivot Overbought Oversold Chart Bubbles
##Thanks to samer800 for helping me find where this was originally posted. I wanted to make sure proper credit is given.
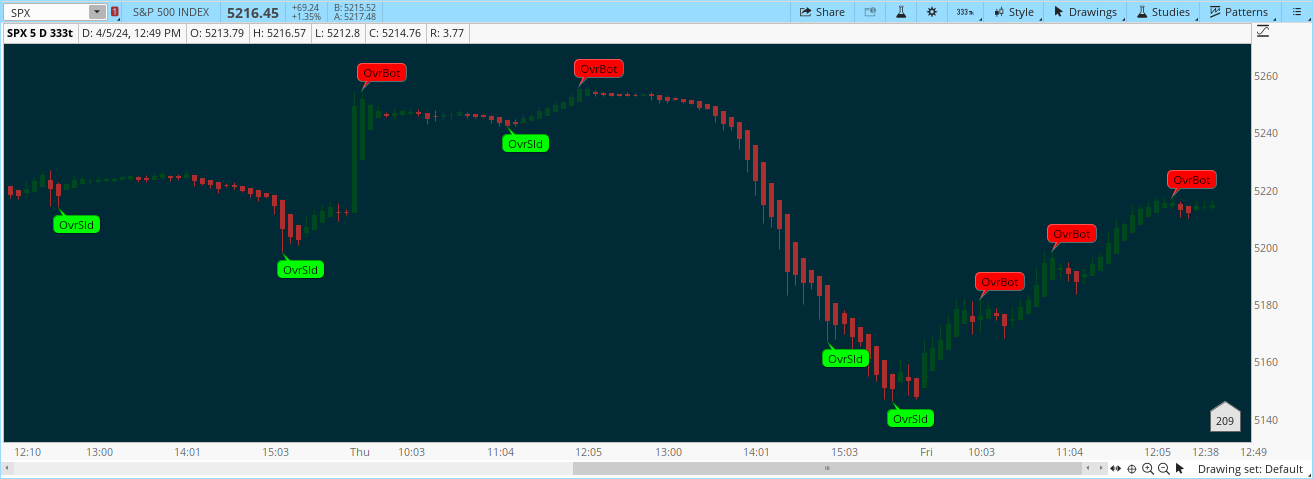
##I have converted this indicator to show as Overbought (OvrBot) RED and Oversold (OvrSld) GREEN using a forward length of 2 and a Backward length of 8.
I'm using an eight since history shows candles change direction approximately every 6-10 bars (no matter which time frame used).
I'm using a forward 2 in order to show at least a two bar change in direction. I only place trades if at least two of my other indicators also show a change in direction taking place.
mod note:
##Thanks to samer800 for helping me find where this was originally posted. I wanted to make sure proper credit is given.
##I have converted this indicator to show as Overbought (OvrBot) RED and Oversold (OvrSld) GREEN using a forward length of 2 and a Backward length of 8.
I'm using an eight since history shows candles change direction approximately every 6-10 bars (no matter which time frame used).
I'm using a forward 2 in order to show at least a two bar change in direction. I only place trades if at least two of my other indicators also show a change in direction taking place.
mod note:
Does not update in real time because it utilizes the HighestAll() function
Ruby:
##AsGoodAsItGets Pivot Overbought Oversold Chart Bubbles
##Charles Ricks 4/5/24

declare upper;

input Length_Forward = 2;
input Length_Backward = 8
;

def _BN = BarNumber(); # current barnumber
def _NaN = Double.NaN; # non-numeric values
def _H = high; # high price
def _L = low; # low price
def _C = close; # close price
def _O = open; # open price
def _LL = Lowestall(_L); # lowest _L price
def _HH = highestall(_H); # highest _H price

script FindPivots {
input dat = high; # default data or study being evaluated
input HL = 0; # default high or low pivot designation, -1 low, +1 high
input PF = 1; # default pivot forward period
input PB = 5; # default pivot backward period

##############
def _nan; # used for non-number returns
def _BN; # the current barnumber
def _VStop; # confirms that the lookforward period continues the pivot trend
def _V; # the Value at the actual pivot point
def _VBar; # the bar number at the pivot point
def _PV; # the previous pivot Value
def _PVBar; # the previous pivot bar number
def _VDiff; # the difference in values between last two pivot points
def _VDist; # the diffence in barnumbers between last two pivot points
def _VSlope; # the Slope calculated using value and distance changes
def _VPivot; # used for the pivot point connector line only
##############

_BN = BarNumber();
_nan = Double.NaN;
_VStop =
fold a = 1 to PF + 1
with b = 1 while b
do if HL > 0 then
dat > GetValue(dat, -a) else
dat < GetValue(dat, -a) ;
if (HL > 0) {
_V = if _BN > PB and dat == Highest(dat, PB) and _VStop
then dat else _nan;
} else {
_V = if _BN > PB and dat == Lowest(dat, PB) and _VStop
then dat else _nan;
}
;
_VBar = if !IsNaN(_V) then _BN else _VBar[1];
_PV = if !IsNaN(_V) then GetValue(dat, _BN - _VBar[1]) else _PV[1];
_PVBar = if _VBar != _VBar[1]
then _PVBar[1] else _VBar;
_VDiff = AbsValue(_V) - AbsValue(_PV);
_VDist = _BN - _PVBar;
_VSlope = if _V > _PV then 1 else
if _V < _PV then -1 else 0;
if (HL > 0) {
_VPivot = _BN >= HighestAll(_PVBar);
} else {
_VPivot = _BN >= LowestAll(_PVBar);
}
;
plot result = if !IsNaN(_V) and _VStop then _V else _nan; #return the final _dat value at the most recent pivot point (same as V)
}
;

def ph = findpivots(_H, 1, length_forward, length_backward)."result";
def pl = findpivots(_L, -1, length_forward, length_backward)."result";

def ph_1 = if !isnan(ph) then ph else ph_1[1];
def pl_1 = if !isnan(pl) then pl else pl_1[1];

def hh = !isnan(ph) and ph > ph_1[1];
def ll = !isnan(pl) and pl < pl_1[1];

addchartbubble(ll, pl, "OvrSld", color.green, no);

addchartbubble(hh, ph, "OvrBot", color.red, yes);

##End Code
Last edited by a moderator: