Hi -
I have a script question - So I like to add labels to my indictors and I noticed a few times that when I add them, there few indictors that the labels are just BLACK. Did I code it wrong/use the incorrect script language. Most of my script labels are on the bottom right side either in Green or Red. But this one is coming out as Black/not easy to read it.
# === Crossover Signals on Oscillator ===
plot BullCross = if wt1 crosses above wt2 then wt1 else Double.NaN;
plot BearCross = if wt1 crosses below wt2 then wt1 else Double.NaN;
BullCross.SetPaintingStrategy(PaintingStrategy.ARROW_UP);
BullCross.SetDefaultColor(Color.GREEN);
BullCross.SetLineWeight(5);
BearCross.SetPaintingStrategy(PaintingStrategy.ARROW_DOWN);
BearCross.SetDefaultColor(Color.RED);
BearCross.SetLineWeight(5);
AddLabel(yes,
if BullCross then "BUY" else
if BearCross then "No Trades Allow" else "No Trades Allow",
if BullCross then Color.GREEN else
if BearCross then Color.RED else Color.RED, Location.BOTTOM_RIGHT, FontSize.LARGE);
http://tos.mx/!500Cbg2K
View attachment 26944
Another question, in one of the version of this, there was a histogram, so I added it back in. I currently color code it white, but I would like to make it Green (above zeroline) and Red ( below zeroLine). Would someone show help me with the script or perhaps link and sample of how to add it?
I currently have it as below -
plot wt3 = (wt1 - wt2);
wt3.SetDefaultColor(Color.WHITE);
wt3.SetPaintingStrategy(PaintingStrategy.HISTOGRAM);
View attachment 26945
Thank you,
jrj4774

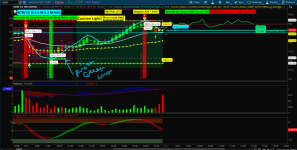
 Couple of ?s: 1. You mention "my pivot indicator" on the chart. Where is that? 2. At the time of the 2nd buy signal, did you wait for the traffic light to turn green? It was at a "caution stage" during the first signal. 3. What version of the TMO Oscillator are you using? 4. The chart has a "predicted high" on the right side. How are you are getting that to appear.? Again, hearty congrats on this great trade $$ and thanks for your insight and willingness to help and teach others.