
Yes that’s why I always promote two, or more, in agreement before placing a tradeI did build a non-repainting version but it comes with some lag, but the signal is true and solid when given. Being a swing trader either one works fine, but as you move into intraday the repainting needs validation before believing it. As you guys always say never just use one.
You are using an out of date browser. It may not display this or other websites correctly.
You should upgrade or use an alternative browser.
You should upgrade or use an alternative browser.
Repaints AGAIG DayTrading - Scalping For Success In ThinkOrSwim
- Thread starter csricksdds
- Start date
-
- Tags
- agaig
Repaints
Join useThinkScript to post your question to a community of 21,000+ developers and traders.
@merryDay @antwerksThanks - of course I am somewhat biased since my charting is easy on the eyes and easy to follow?
The AGAIG charts do indeed provide an abundance of data points on a single chart. What I like is the clear heads-up for a possible change of direction. Using and observing the 10 minute "rinse and repeat" charts for the past couple of days has allowed me to see their usefulness and accuracy. ASTS yesterday was on a strong upward trend early on, and the "short" reversals suggested by the AGAIG bubble/histogram were seemingly very temporary and re-painted back to long positions a couple of times. I actually gave up on the short positions holding any possibility of any profit and moved onto other stocks. However, when I checked at the end of the day, ASTS held the short position a bit later and actually declined by a couple of points, which would have made for a profitable put with an exit at .55. So my lack of patience would have cost me a winning trade. (I recall reading in one of the AGAIG posts that even if it doesn't happen right away, the price action will frequently align with multiple AGAIG indicators that are in agreement). The past couple of days, with lower than average volume, required discipline and exactness to have a trade play out. So the problem was not with the strategy or tools--they are sharp and designed for success with ease of use. Rather, the problem is with the person trying to implement them but not giving them time to work. That person is me.


Yes I find frequently when they show a probable change-in-direction (and then reverse) it was actually a weakening taking place and then it once again makes the turn and yes, patience is a virtue?@merryDay @antwerks
The AGAIG charts do indeed provide an abundance of data points on a single chart. What I like is the clear heads-up for a possible change of direction. Using and observing the 10 minute "rinse and repeat" charts for the past couple of days has allowed me to see their usefulness and accuracy. ASTS yesterday was on a strong upward trend early on, and the "short" reversals suggested by the AGAIG bubble/histogram were seemingly very temporary and re-painted back to long positions a couple of times. I actually gave up on the short positions holding any possibility of any profit and moved onto other stocks. However, when I checked at the end of the day, ASTS held the short position a bit later and actually declined by a couple of points, which would have made for a profitable put with an exit at .55. So my lack of patience would have cost me a winning trade. (I recall reading in one of the AGAIG posts that even if it doesn't happen right away, the price action will frequently align with multiple AGAIG indicators that are in agreement). The past couple of days, with lower than average volume, required discipline and exactness to have a trade play out. So the problem was not with the strategy or tools--they are sharp and designed for success with ease of use. Rather, the problem is with the person trying to implement them but not giving them time to work. That person is me.
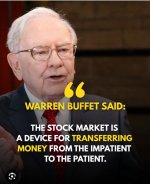
As usual, you are right, kind sir. In 2026 I need to focus on what Mr. Buffett said.Yes I find frequently when they show a probable change-in-direction (and then reverse) it was actually a weakening taking place and then it once again makes the turn and yes, patience is a virtue?
Attachments
wait - " I place GTC Exits at .75% of expected move, watch for turning points, and expect profit of approx. $600 - $1,000+ Daily." .75% or .0075X???
As Good As It Gets
DAY TRADING – SCALPING FOR SUCCESS
So, what is the best way to Day Trade? How do I Day Trade? What stocks (ETFs) are picked, and why do I pick them? How do I know when to enter and/or exit?
The old song “knowing when to hold them, knowing when to fold them, knowing when to walk away and knowing when to run” fits well for an options' day trader!
First of all let’s look at what to trade. I quit trading (for the most part) 0DTE (zero days until expiration) although I have done well with these during my foregone more alert days. Sometimes I will trade the ODE SPY, but not as much as I used to. Too many others work better with less stress and give more flexibility?
I want stocks that:
- move more than five points (ATR) per day (based on a 9 period look back).
- Entries/Exits will be taken when the “intraday” has moved 1.75 - 2.0 of its daily intraday ATR (Intraday Average True Range).
- I mostly trade five contracts at a time.
- This will frequently give me 2-3 trades on the same stock each day.
ATR gives the average movement of the security on a daily, weekly, or monthly basis, but we’re trading intraday and can expect multiple up and down movements within that range during the day with a possible ORB (Opening 15-30 minute Breakout) to the upside or downside.
An added comment if I may: It has been my experience that most stocks close at the edges or within the ORB (15-30 minute Opening Range Breakout). When trading into closing I take this into consideration. I also notice that stocks tend to move towards the VWAP (Volume Weighted Average Price) which to me represents home-base for a security (a frequent area of resistance). I also stated that I trade Friday’s Expirations Monday thru Wednesday and then begin trading the next week out. I actually start the next week out at Wednesday between Noon and 1:00 p.m.
MAJOR KEY POINT: When using my charting similar to the AGAIG Visual Options Trading Chart
https://usethinkscript.com/threads/agaig-visual-options-trading-chart-for-thinkorswim.19840/
I’m using the Long/Short Bubbles and Lower Squared Histograms for entry/exits after looking back 2-3 days to see what the average intraday movement (AIM) has been and use that average for expected intraday movement.
I have found it best for intraday trading:
I quit screening a long time ago since most stocks are basically making the same movements over and over. To me screening is a waste of time especially for intraday trading. I also like to start and end the day with cash positions.
- to only trade the same 2-4 stocks over and over
- using 5-10 days expiration for my intraday trades.
Some approximate Stats using average intraday movements on some of the ones I Day (Scalp) Trade: (2-day intraday average movements) are as follows:
SNOW: 10 Entry/Exit Bubbles with average 5.92 intraday moves including end of day exits. ATM trades = 5.92 X .5 X 100 = $2.96 potential per trade X 3 trades/day = $888 profit daily. I place GTC Exits at .75% of expected move, watch for turning points, and expect profit of approx. $600 - $1,000+ Daily.
VST: 14 Entry/Exit Bubbles including EOD (End of Day) exits with average 2.5 intraday moves. ATM trades = $125 potential on 5 contracts. 3 Trades/day = $375 or more easy profit per day.
The other two I watched on Friday last was AVGO and MSFT.
I’ll let you figure out the intraday averages for your favorite trades. Honesty is a good practice and my goal is $2K+ per day and Friday last easily eclipsed that amount and I was away half the day!!).
My trading setup used to have six (or more) monitors and now only use three monitors (two with double charts with the one in the middle having only the options trading chain. I have two stocks showing that I trade for the day on the right monitor with the other two stocks on the left monitor that might be traded if showing clear entry or exit signals?
My trades are usually just ITM (In-the-Money)so there is a little intrinsic value to start. I trade Friday’s expirations Monday - Wednesday and then the next week's beginning Thursday. Some of my favorite stocks are SNOW, VST, AVGO and MSFT and usually place a GTC of .75 - 1.00 per contract on these. My goal is to be in cash at the beginning of the day and back into cash at end of day although occasionally I will have to hold overnight which leaves me a few days grace if needed.
Bottom line you only need 2-4 stocks for day trading, know the average intraday moves, relax and don’t be greedy. You never lose money when you take a profit. Taking profit on half the expected movement increases the odds greatly.
I know traders who exit trades at 10-12% profit, others at 2-25% profit whereas I’m looking for 50 cents – 1.00 per contract profit. Your risk determines you toleration to profit/loss.
Greed (trading options) is usually inversely proportional to one’s expectations?
My pre-trading (daily) routine: Twenty minutes on our “stationary” bike (approximately 2.5 miles) always wearing a helmet in case I get hit by a stationary car!
Happy day trading!
As usual, you are right, kind sir. In 2026 I need to focus on what Mr. Buffett said.
")
Just a general question for @csricksdds or anyone else - Now trading the M10 for entry do you use a closed bar or open bar?
Last edited by a moderator:
I go by two or more indicators suggesting a change-in-direction and don't wait for bars to closeJust a general question for @csricksdds or anyone else - Now trading the M10 for entry do you use a closed bar or open bar?
any two other indicators or do you have preferences?I go by two or more indicators suggesting a change-in-direction and don't wait for bars to close
I only use my AGAIG Charting mostly using the Bubbles and Histogramany two other indicators or do you have preferences?
I'M LIKING YOUR VERSION A LOT. Is there a way to get an alert when the sell arrow + sell bubble / buy arrow + buy bubble are both in effect?Using the dual charting from AGAIG, I modified by adding some of my favorites
(Fractals and DTE ADX) Combining these 4 to 5 signals to validate and make trades -
They are spot on - Thanks
shared chart link: https://tos.mx/!Fbvsy3gw
MUST follow these instructions for loading shared links.
View attachment 24022
I'M LIKING YOUR VERSION A LOT. Is there a way to get an alert when the sell arrow + sell bubble / buy arrow + buy bubble are both in effect?
Given the buy and sell are repainters. No, they do not work reliably in alerts (nor in watchlists or scans).
read more:
https://usethinkscript.com/threads/answers-to-commonly-asked-questions.6006/
As the AGAIG long / short signals are repainters. Only use them for confirmation.
read more:
https://usethinkscript.com/threads/...ing-with-thinkorswim.20844/page-4#post-155104
https://usethinkscript.com/threads/why-repainters-have-great-backtested-results.21511/#post-156072
https://usethinkscript.com/threads/...ing-with-thinkorswim.20844/page-6#post-156065
@csricksdds recommends using the repainters as a confirming indicator when used with these non-repainters:
https://usethinkscript.com/threads/agaig-trading-guide-summary-in-thinkorswim.19935/
https://usethinkscript.com/threads/...ses-repaint-indicators-for-thinkorswim.20126/
https://usethinkscript.com/threads/agaig-daytrading-scalping-for-success-in-thinkorswim.20383/
Man @csricksdds I will have to give it to you - even though this repaints - using it with other indicators really shows the power of this script. I am thoroughly impressed - this week has push well into the 5 figures in profits and no losing trades (so far hope I did not jinx it) let's talk more about your use of this script - I have read all the others but what have you come up with lately and any changes to the strategy that you have come across?I go by two or more indicators suggesting a change-in-direction and don't wait for bars to close
I have no changes to add as tis has worked well for me as well. Thanks for your kind words and I hope for your continued success!Man @csricksdds I will have to give it to you - even though this repaints - using it with other indicators really shows the power of this script. I am thoroughly impressed - this week has push well into the 5 figures in profits and no losing trades (so far hope I did not jinx it) let's talk more about your use of this script - I have read all the others but what have you come up with lately and any changes to the strategy that you have come across?View attachment 26839
This is magic by the way - just saying.....I have no changes to add as tis has worked well for me as well. Thanks for your kind words and I hope for your continued success!
This is magic by the way - just saying.....
Good charting and methodology but probably not magic?This is magic by the way - just saying.....
I did add your doji trading method to your AGAIG - works out well as they seem to happen along the same time frames as your other signalsGood charting and methodology but probably not magic?
Code:
# Doji High Break Color Script
# By: antwerks from csricksadds doji methodology | Jan 2026
# Colors Dojis white and highlights the first candle to close above the Doji's high in yellow

input dojiBodyPct = 10;  # Max body size as % of range to count as a Doji

def o = open;
def c = close;
def h = high;
def l = low;
def body = AbsValue(c - o);
def range = h - l;

# Avoid divide by zero
def bodyPct = if range != 0 then (body / range) * 100 else 0;

# Define Doji
def isDoji = bodyPct < dojiBodyPct;

# Store Doji High
rec dojiHigh = if isDoji then h else dojiHigh[1];
rec waitingForBreak = if isDoji then 1 else if !isDoji and c > dojiHigh[1] and waitingForBreak[1] == 1 then 0 else waitingForBreak[1];

# Signal: first candle to close above the most recent doji
def isBreakCandle = !isDoji and waitingForBreak[1] == 1 and c > dojiHigh[1];

# === Assign Candle Colors ===
AssignPriceColor(
    if isDoji then Color.WHITE
    else if isBreakCandle then Color.YELLOW
    else Color.CURRENT
);It looks like you have added other features to the already great charts! "Expected high, expected low etc." Are you able to share? Can you tell us about the other indicators you have used with AGAIG to achieve these amazing results this week? Can you show us an "illustrated trade" you took with your customary artistic flair? I love seeing members of the UTS community make $$$ so we can learn from each other.Man @csricksdds I will have to give it to you - even though this repaints - using it with other indicators really shows the power of this script. I am thoroughly impressed - this week has push well into the 5 figures in profits and no losing trades (so far hope I did not jinx it) let's talk more about your use of this script - I have read all the others but what have you come up with lately and any changes to the strategy that you have come across?View attachment 26839
XOM Trade Breakdown – 1/22It looks like you have added other features to the already great charts! "Expected high, expected low etc." Are you able to share? Can you tell us about the other indicators you have used with AGAIG to achieve these amazing results this week? Can you show us an "illustrated trade" you took with your customary artistic flair? I love seeing members of the UTS community make $$$ so we can learn from each other.
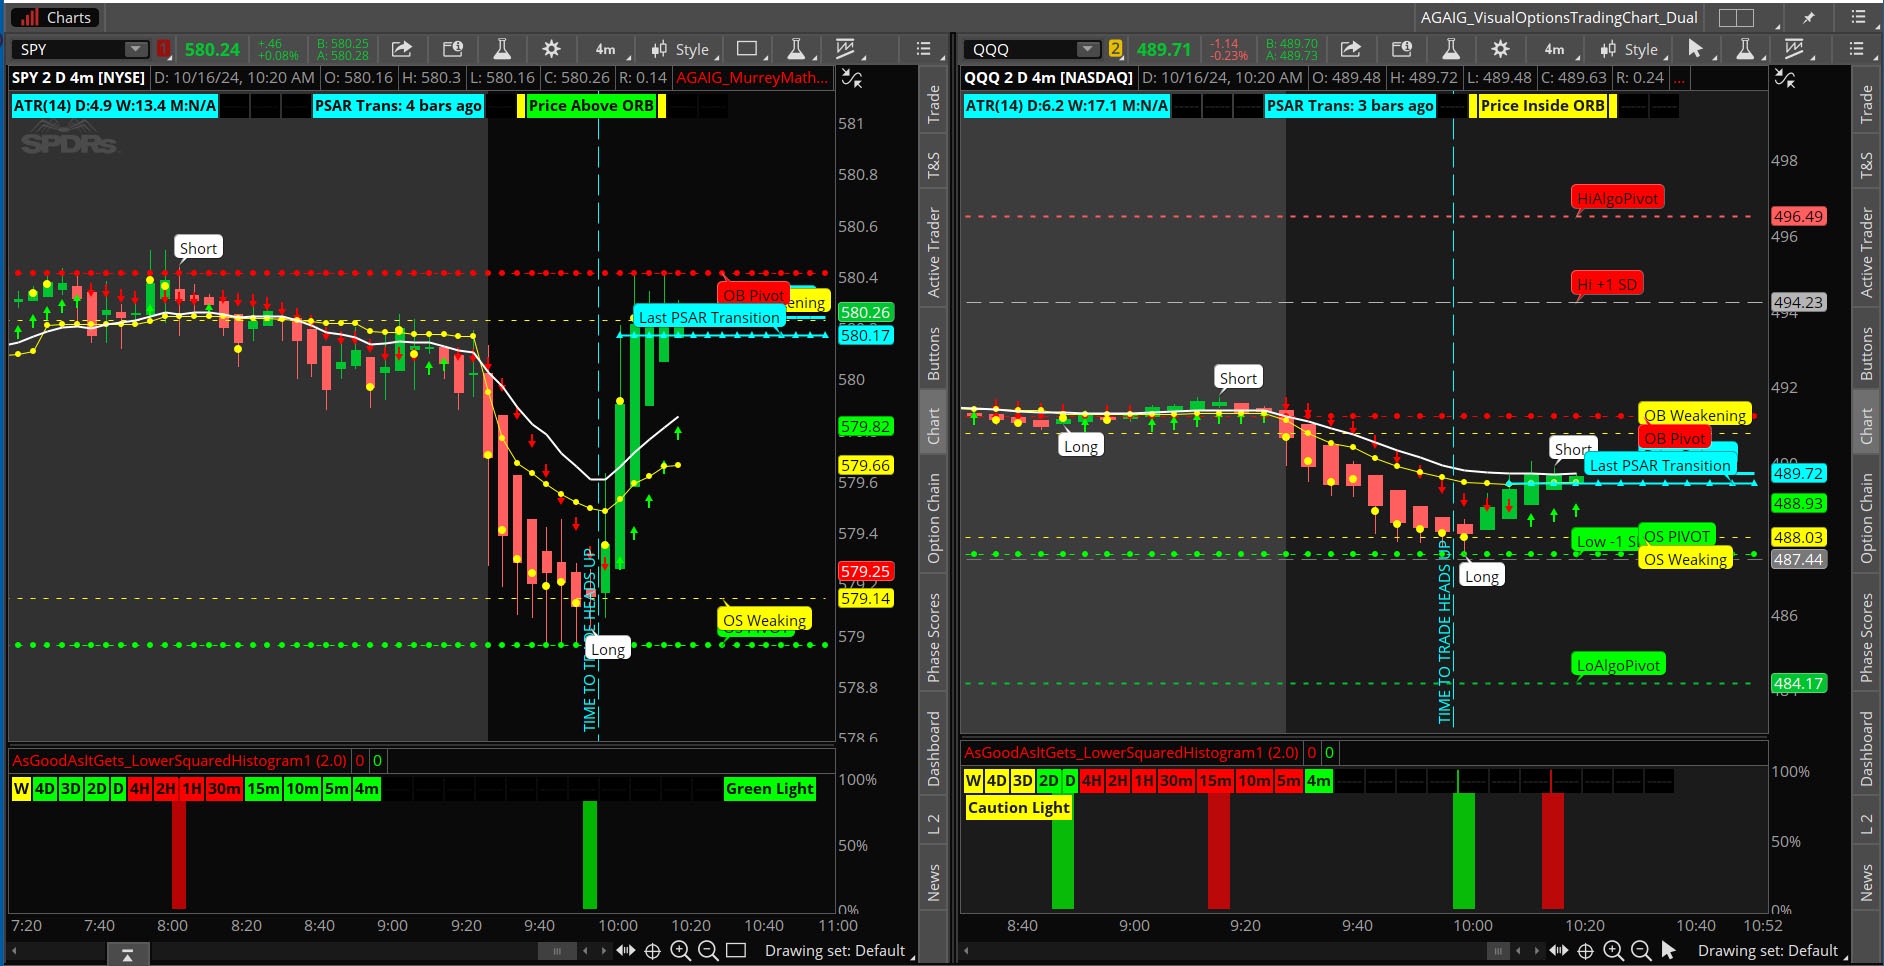
Today’s trade on XOM was a solid example of disciplined patience and multi-factor confirmation using @csricksdds custom indicator stack.
At 8:50 AM, the first buy signal was triggered from the upper AGAIG histogram blocks. However, the price action structure wasn’t aligned — candles lacked conviction, TMO (True Momentum Oscillator) remained negative, and volume was declining. Plus, the Caution Light was still active. So, I waited.
Shortly after, a second histogram buy signal appeared. This time, it was backed by:
- A "Long" bubble from the system,
- TMO had bottomed and began curling upward, suggesting emerging bullish momentum,
- A sequence of doji-like candles hinted at indecision and potential reversal,
- My Pivot Indicator also triggered.
At that point, I entered a 132 call option at $1.00, with structure now aligning across momentum, volume, and candle formation.
- Around 10:30, the Polynomial Regression Moving Average (turquoise) turned upward and crossed above the 20 MA, a key confirmation.
- Price held and climbed above VWAP, with volume picking up — all supporting continuation.
- Around 13:40, a doji formed, and the next candle closed higher, signaling potential exhaustion of the move.
That was my exit trigger, and I sold the 132 call at $2.25, locking in over 125% return.
- I waited for full alignment: histogram trigger, AGAIG signals, TMO reversal, price structure, volume, and MA climbing/crossover.
- Avoided early entry due to lack of confirmation, which protected capital.
- Used the higher close after a doji as an elegant profit-taking signal.
This was a textbook example of how multiple confluences of the AGAIG and using other indicators can lead to high-probability trades when timed with discipline.
Last edited:
here is the volume I used
Code:
# PNVI is a modified version of the Price-Volume Trend (PVT) indicator
# Many thanks to @antwerks 2/2/2025 for script from usethinkscript.com
# khpro
#added trend labels - khpro
#added option for painting candles - khpro

declare lower;

input ma_length = 15;

def xROC = (close - close[1]) * 100 / close;

def nRes1 = if (volume < volume[1]) then nRes1[1] + xROC else nRes1[1];
def nRes2 = if (volume > volume[1]) then nRes2[1] + xROC else nRes2[1];
def nRes3 = nRes1 + nRes2;
def nResEMA3 = simpleMovingAvg(nRes1, ma_length) + simpleMovingAvg(nRes2, ma_length);

plot PNVI = nRes3;
plot PEMA = nResEMA3;

PNVI.SetDefaultColor(GetColor(1));
PNVI.DefineColor("Up Momentum", Color.BLUE);
PNVI.AssignValueColor(PNVI.color("Up Momentum"));

PEMA.SetDefaultColor(GetColor(1));
PEMA.DefineColor("Down Momentum", Color.RED);
PEMA.AssignValueColor(PEMA.color("Down Momentum"));

AddCloud(PNVI, PEMA, PNVI.color("Up Momentum"), PEMA.color("Down Momentum"));

# Define Trend Labels

# Define Trend Labels with Else Statements
AddLabel(PNVI crosses PEMA, "Absorption / Possible Reversal", Color.PLUM);
AddLabel(PNVI > PEMA and PNVI > PNVI[1], "Confirmed Uptrend", Color.BLUE);
AddLabel(PNVI < PEMA and PNVI < PNVI[1], "Potential Exhaustion", Color.ORANGE);
AddLabel(PNVI > PEMA and PNVI > PNVI[1], "Bullish Momentum", Color.GREEN);
AddLabel(PNVI < PEMA and PNVI < PNVI[1], "Bearish Momentum", Color.RED);

# Background Coloring
input paintCandles = yes ;
AssignPriceColor(
if !paintCandles then color.current else
if PNVI > PEMA then Color.GREEN else Color.RED);Similar threads
-
-
Repaints AGAIG Stop And Reverse Indicator Tutorial and Chart For ThinkOrSwim
- Started by csricksdds
- Replies: 0
-
Repaints AGAIG: Getting Ready To Trade Futures (stocks) or How To Select Good Charts In ThinkOrSwim
- Started by csricksdds
- Replies: 4
-
Repaints AGAIG ThinkOrSwim: If I Were To Write A New Book
- Started by csricksdds
- Replies: 26
-
Not the exact question you're looking for?
Start a new thread and receive assistance from our community.
87k+
Posts
1260
Online
Similar threads
-
-
Repaints AGAIG Stop And Reverse Indicator Tutorial and Chart For ThinkOrSwim
- Started by csricksdds
- Replies: 0
-
Repaints AGAIG: Getting Ready To Trade Futures (stocks) or How To Select Good Charts In ThinkOrSwim
- Started by csricksdds
- Replies: 4
-
Repaints AGAIG ThinkOrSwim: If I Were To Write A New Book
- Started by csricksdds
- Replies: 26
-
The Market Trading Game Changer
Join 2,500+ subscribers inside the useThinkScript VIP Membership Club
- Exclusive indicators
- Proven strategies & setups
- Private Discord community
- ‘Buy The Dip’ signal alerts
- Exclusive members-only content
- Add-ons and resources
- 1 full year of unlimited support
Frequently Asked Questions
What is useThinkScript?
useThinkScript is the #1 community of stock market investors using indicators and other tools to power their trading strategies. Traders of all skill levels use our forums to learn about scripting and indicators, help each other, and discover new ways to gain an edge in the markets.
How do I get started?
We get it. Our forum can be intimidating, if not overwhelming. With thousands of topics, tens of thousands of posts, our community has created an incredibly deep knowledge base for stock traders. No one can ever exhaust every resource provided on our site.
If you are new, or just looking for guidance, here are some helpful links to get you started.
- The most viewed thread:
https://usethinkscript.com/threads/repainting-trend-reversal-for-thinkorswim.183/ - Our most popular indicator:
https://usethinkscript.com/threads/buy-the-dip-indicator-for-thinkorswim.3553/ - Answers to frequently asked questions:
https://usethinkscript.com/threads/answers-to-commonly-asked-questions.6006/
What are the benefits of VIP Membership?
VIP members get exclusive access to these proven and tested premium indicators: Buy the Dip, Advanced Market Moves 2.0, Take Profit, and Volatility Trading Range. In addition, VIP members get access to over 50 VIP-only custom indicators, add-ons, and strategies, private VIP-only forums, private Discord channel to discuss trades and strategies in real-time, customer support, trade alerts, and much more. Learn all about VIP membership here.
How can I access the premium indicators?
To access the premium indicators, which are plug and play ready, sign up for VIP membership here.