Repaints AGAIG Best Trading Chart Setup For ThinkOrSwim

Repaints
AGAIG question - Lov the setup but why is my label for LONG /SHORT so far up and down on chart that I can’t see them without moving screen up n down, how can I get them closer to the bar? Help please
 

Join useThinkScript to post your question to a community of 21,000+ developers and traders.

I love the setup, it realy helps improve my trading.
Is it possible to stop or change the bell ring every time the direction changes.
I'll be happy to make the changes in the source code just let me know where is it.
Thank you.
 
UPDATE: 9/30/24 new indicators! new chart!
see the above post
UPDATE: 4/18/24 added overview of indicators used and why, explanation located below chart image

The market has three moves: Up, Down and Sideways. My goal is the trade these movements using the simplest of indicators to head me in the right direction. It works on all time frames (the best being an hour or less).

Chart Link: http://tos.mx/!mPuNL9nn Click here for --> Easiest way to load shared links
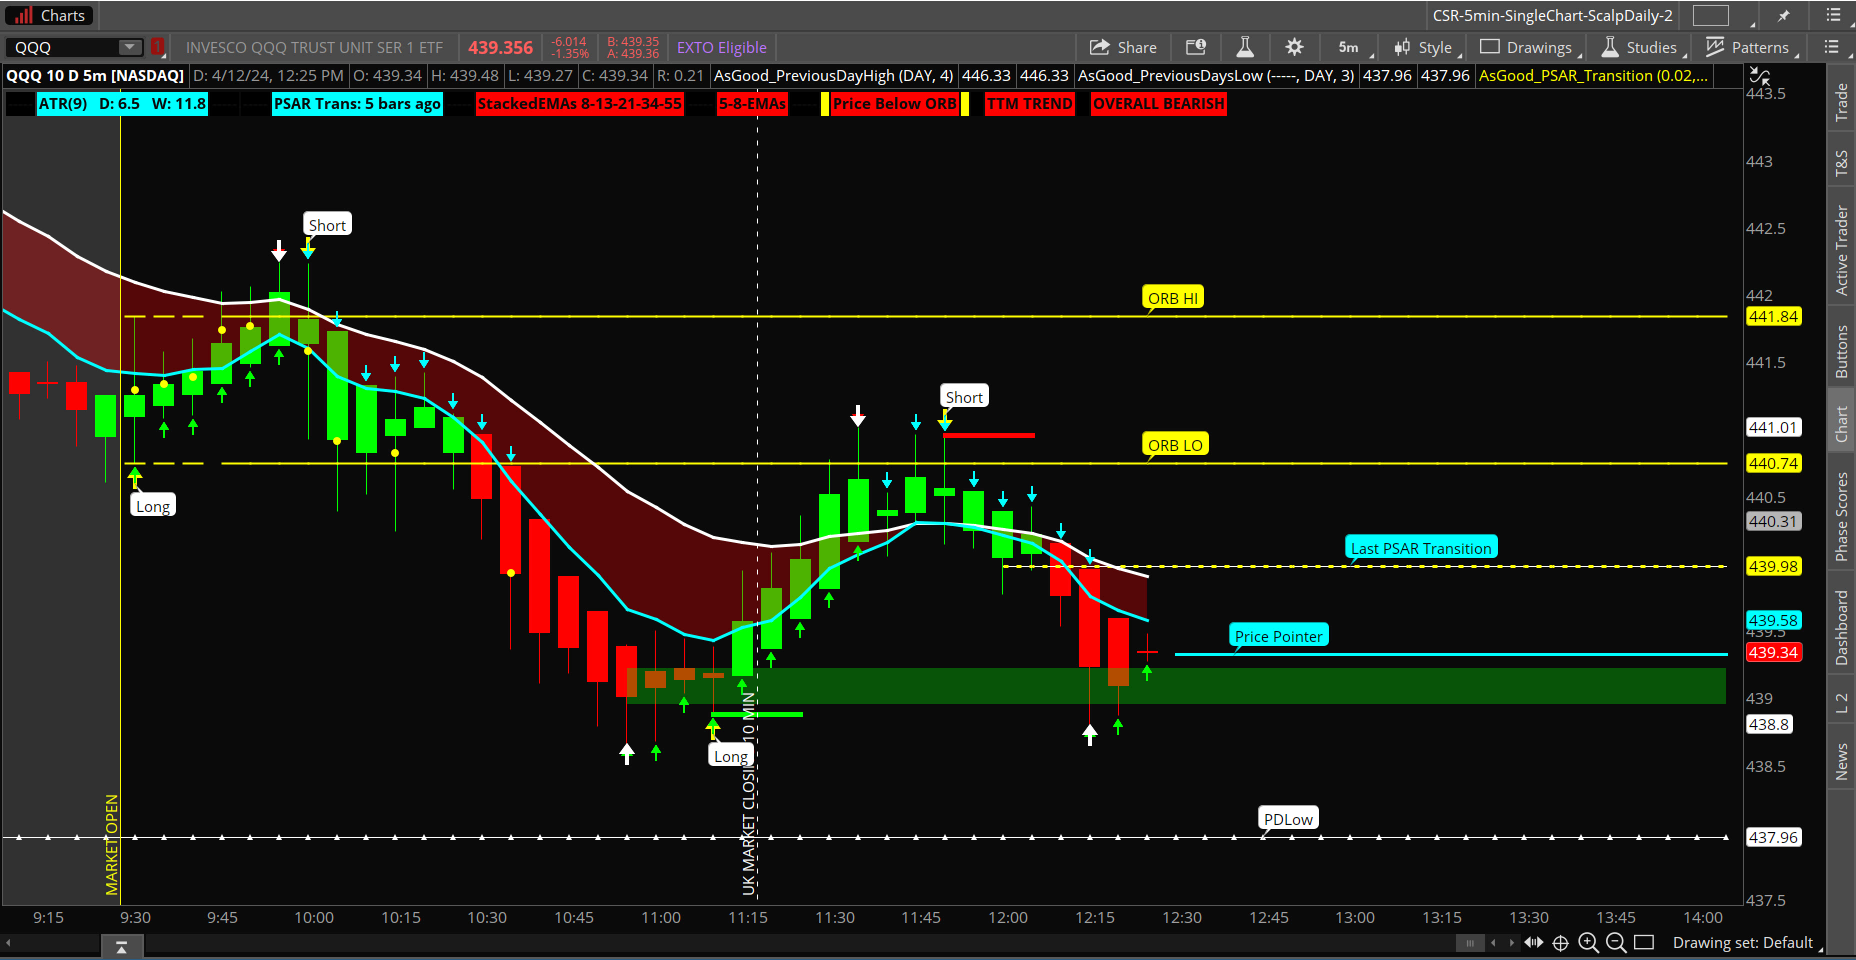
bsQt5xS.png

I only day trade one chart (SPY, SPX, or QQQ) following my indicators (knowing that they repaint - but so does life!). I try to never trade up in a down market, nor down in an up market. I also watch for 8/20 crossovers and will exit a put if it crosses up, or a call if it crosses down (some traders trade only the crossovers).

an overview the indicators and labels UPDATE: 4/18/24
First we’ll discuss the Labels at top of the chart:

ATR: This label represents the Average True Range for Daily/Weekly expected movement. Since candles move 6-10 (average) on any time frame this one is set to (9) for a nine period trend for Days or Weeks. It could be changed to any lookback number you choose.

PSAR Trans: PSAR is defined as “Parabolic Stop and Reverse” showing candle change in direction and listing how many bars ago the change took place. This Label is coordinated with the Yellow Dotted Line down on the chart with Label words “Last PSAR Transition” showing candles above/below that line. PSAR indicates when a price trend breaks ahead of a potential reversal (i.e. Follow the Money).

StackedEMAs 8-13-21-34-55: These are all Fibonacci Levels (levels frequently used as turning points by algorithmic computer traders). When the label is Green these levels are lined up positive (probable uptrend); when Red they are lined up negative (probable downtrend); when Yellow the market is probably choppy with no completely defined direction. I use EMAs instead of SMAs (Simple Moving Averages) since EMAs favor current trend rather than overall historic trend.

5-8 EMAs: This is a Red/Green color label to show an initial trend change possibly taking place.

ORB Yellow Bordered Label: (OPENING RANG BREAKOUT) This label is only active during actual trading hours. It will designate if the stock (ETF) is trading within, above, or below the Opening Range Breakout. On the chart it is a broken line while during the first 15 min. breakout and a solid line the rest of trading day. I am using a 15 min. Breakout Range whereas some traders prefer the first 30 minutes.

TTM Trend Label: The TTM Trend (free oscillator on TOS) is a lower oscillator showing a four color movement. My label only shows Green/Red for trend up/down. My Red/Green Candles are coordinated with the oscillator as well (but again only in the 2-color mode).

The next Label shows trend as Green “OVERALL BULLISH”; Red “OVERALL BEARISH”; or Yellow “CHOP HOLD.”


Now a look at the Chart itself:


My chart is setup using Heikin Ashi Candles. If you use these make sure you find an explanation for these as verses regular candles. Basically Heikin Ashi candles are good for a day trading trend, with the shadows (wicks) showing direction (rather than a potential reversal as on a regular candle). Flat bottoms/tops show strong based direction with an upper/lower wick.
The Green/Red Candles giving a visual overall trend.
The candles are painted with momentum from the TTM Squeeze Indicator.
Momentum is more responsive than the default heiken ashi trend coloring.

Last PSAR Transition Yellow Dotted Line was explained above.

The Long/Short Chart Bubbles are an indicator I developed showing probable change in direction.

A solid Red/Green Line also shows a high/low probable transition trend point.

The shaded (cloud) Red/Green Box-like areas are Support and Resistance areas.

The larger White/Yellow arrows are trend reversal areas. The smaller Green/Cyan show a continuation trend for up to 8 candles. Strong reversal indications are when two or more arrows overlap each other and/or a long/short bubble is present. Because indicators repaint my goal is to have more than one indicator showing a change taking place

The White Dotted Lines show PDHi (Previous Days High) and PDLow (Previous Day Low). These are frequently Resistance/Support areas unless Stock/ETF in a breakout mode above/below yesterday’s close.

The PRICE POINTER is one of my favorites which moves up/down with actual price.

The Blue/White lines are the 8/20 EMA trend lines. The 8 moves the fastest in correlation with the 20. Both levels are Fibonacci related (I’m using a 20 instead of the 21 since the 21 is a frequent change in direction area (the 20 gives me a heads-up). Also notice when the Blue Crosses the White (Crossovers) as many individuals trade only the crossovers. Be careful with these lines approaching each other, however, as it may be a pivot rather than a crossover?


That pretty much covers my AGAIG Best Trading Chart Setup. Thanks to useThinkScript members whose indicators I am using, or have modified, for my chart!

My background in life was mostly in a visual profession. Notice that I don’t use any lower indicators as it’s difficult (at least for me) to comprehend an overload of competing information.

When I taught in The Options Club here in The Villages (largest retirement community in U.S.) my moniker was “Visual Options Trading” because:

“if you can’t see it how can you possibly trade it?”
Do you have any scanners for the as good as it gets no arrows? Thank you. Love your indicators!
 
Have you considered using a Flexible Grid and having 6 or 8 or 10 stocks up- and letting the alerts sound off when there is a signal?? (this is what I do)
I used to do that but got over it since they all sit there and do the same thing. Look at AMD and MSFT or maybe MSTR and COIN. Any two of them keeps me happy! Do whatever works for you.
 
Is it possible to get script written on just for the yellow arrows? Is it possible to have it work on the mobile app?View attachment 27774
I think these are the arrows you are looking for. You can turn off/on in once loaded in the Added Studies and Strategies.

mod note:
These arrows look perfect because they repaint
read more:
https://usethinkscript.com/threads/answers-to-commonly-asked-questions.6006/
Code:
##AsGood-HiLo-PeaksValleys-Arrows indicator 3/26/24
# find peaks and valleys
# https://usethinkscript.com/threads/...y-demand-zones-for-thinkorswim.172/#post-7048
# robert payne code
#Modified by C. Ricks 2/21/24

def na = double.nan;
def bn = BarNumber();
def lastbn = highestall(if isnan(close) then 0 else bn);
def lastcls = if lastbn then close else lastcls[1];
#def lastbar = (!isnan(close) and isnan(close[-1]));

input show_peak_valley_arrows = yes;
def spva = show_peak_valley_arrows;

input len = 10;
def offset = Min(len - 1, lastbn - bn);
#def swingLow = low < Lowest(low[1], len - 1) and low == GetValue(Lowest(low, len), -offset);

#--------------------------
#valley section
#def Valley = low < Lowest(low[1], len) and low < Lowest(low[-len], len);
def valley = low < Lowest(low[1], len - 1) and low == GetValue(Lowest(low, len), -offset);
def valley_pr = if valley then low else na;

plot ArrowUP = if spva then Valley else na;
ArrowUP.SetPaintingStrategy(PaintingStrategy.BOOLEAN_ARROW_UP);
ArrowUP.SetDefaultColor(Color.Green);
ArrowUP.SetLineWeight(3);

#---------------------------
#peak section
#def Peak = high > highest(high[1], len) and high > highest(high[-len], len);
def peak = high > highest(high[1], len - 1) and high == GetValue(highest(high, len), -offset);
def peak_pr = if peak then high else na;

plot ArrowDN = if spva then Peak else na;
ArrowDN.SetPaintingStrategy(PaintingStrategy.BOOLEAN_ARROW_DOWN);
ArrowDN.SetDefaultColor(Color.RED);
ArrowDN.SetLineWeight(3);

# -------------------------

##AsGood-HighLowPivot-Arrows


input length = 13;
def lastBar = HighestAll(if IsNaN(close) then 0 else bn);

input ignore_last_bar = yes;
def ignorelast = if (ignore_last_bar and bn == lastbar) then 0 else 1;

def HighPoint = ignorelast and high > highest(high[1], length - 1) and high == GetValue(highest(high, length), -offset);
def Lowpoint = ignorelast and low < Lowest(low[1], length - 1) and low == GetValue(Lowest(low, length), -offset);


input show_Arrows_on_Highpoints_Lowpoints = yes;
def vert = 0.001;

def prange = highPoint – lowPoint;
def plotHighest = highpoint + prange * .3;
def plotLowest = lowpoint - prange * 3.0;

plot BuyCriteria = if LowPoint then Low else double.NaN ;
plot SellCriteria = if HighPoint then High else double.NaN ;

BuyCriteria.SetPaintingStrategy(PaintingStrategy.ARROW_UP) ;
BuyCriteria.SetDefaultColor(color.WHITE);
BuyCriteria.SetLineWeight(5);
SellCriteria.SetPaintingStrategy(PaintingStrategy.ARROW_DOWN) ;
SellCriteria.SetDefaultColor(color.WHITE);
SellCriteria.SetLineWeight(5);

#CSR Buy/Sell Arrows with Short/LongHaulFilter Bubbles
#Developed 4-9-22 First Edition
#Modified by C. Ricks to show direction arrows only (Large Yellow Arroews Up/Down

declare upper;

input atrreversal = 1.5;#Hint atrreversal: Turn down for more entries, up for less entries. Purple signal indicates low point reversal and close approaching Kijun. Orange signal indicates the price is crossing the Kijun. Green signal indicates the low of the candle holds over the Kijun. Red signal means reversal at a high point.
def priceh = MovingAverage(AverageType.EXPONENTIAL, high, 5);
def pricel = MovingAverage(AverageType.EXPONENTIAL, low, 5);

def EIL = ZigZagHighLow("price h" = priceh, "price l" = pricel, "percentage reversal" = .01, "absolute reversal" = .05, "atr length" = 5, "atr reversal" = atrreversal).lastL;
def EIH = ZigZagHighLow("price h" = priceh, "price l" = pricel, "percentage reversal" = .01, "absolute reversal" = .05, "atr length" = 5, "atr reversal" = atrreversal).lastH;

def tenkan_period = 9;
def kijun_period = 26;
def Kijun = (Highest(high, kijun_period) + Lowest(low, kijun_period)) / 2;
def avgPerc = ((Kijun - close) / Kijun) * 100;

plot signaldown = !isNAN(EIH);
signaldown.SetPaintingStrategy(PaintingStrategy.BOOLEAN_ARROW_down);
signaldown.setdefaultcolor (CreateColor (255, 255, 0));
signaldown.setlineweight(5);


plot signalrevBot = !isNaN(EIL);
signalrevBot.SetPaintingStrategy(PaintingStrategy.BOOLEAN_ARROW_up);
signalrevBot.setdefaultcolor (CreateColor (255, 255, 0));
signalrevbot.setlineweight(5);


input usealerts = yes;
alert(usealerts and SellCriteria[1] == 1, "Short", alert.bar, sound.ring);
alert(usealerts and BuyCriteria[1] == 1, "Long", alert.bar, sound.ring);
 
Last edited by a moderator:

Not the exact question you're looking for?

Start a new thread and receive assistance from our community.

87k+ Posts
4706 Online
Create Post

The Market Trading Game Changer

Join 2,500+ subscribers inside the useThinkScript VIP Membership Club
  • Exclusive indicators
  • Proven strategies & setups
  • Private Discord community
  • ‘Buy The Dip’ signal alerts
  • Exclusive members-only content
  • Add-ons and resources
  • 1 full year of unlimited support

Frequently Asked Questions

What is useThinkScript?

useThinkScript is the #1 community of stock market investors using indicators and other tools to power their trading strategies. Traders of all skill levels use our forums to learn about scripting and indicators, help each other, and discover new ways to gain an edge in the markets.

How do I get started?

We get it. Our forum can be intimidating, if not overwhelming. With thousands of topics, tens of thousands of posts, our community has created an incredibly deep knowledge base for stock traders. No one can ever exhaust every resource provided on our site.

If you are new, or just looking for guidance, here are some helpful links to get you started.

What are the benefits of VIP Membership?
VIP members get exclusive access to these proven and tested premium indicators: Buy the Dip, Advanced Market Moves 2.0, Take Profit, and Volatility Trading Range. In addition, VIP members get access to over 50 VIP-only custom indicators, add-ons, and strategies, private VIP-only forums, private Discord channel to discuss trades and strategies in real-time, customer support, trade alerts, and much more. Learn all about VIP membership here.
How can I access the premium indicators?
To access the premium indicators, which are plug and play ready, sign up for VIP membership here.
Back
Top