slavababuli
New member
thanks a lot anyway! do you teach how to trade by the chance?
Last edited by a moderator:
I don't "trade by the chance" - I let my indicators and the market take the lead!thanks a lot anyway! do you teach how to trade by the chance?
")
lol I think he was trying to ask if there was any chance that you teach people how to trade!I don't "trade by the chance" - I let my indicators and the market take the lead!
I taught at the options club here in The Villages, FL for fours+ until my wife said "enough already" and so now I only post on this website. Thankslol I think he was trying to ask if there was any chance that you teach people how to trade!
Great fan of your work by the way! And I really appreciate your generosity in sharing your setups with us! On a side note, have you ever looked into translating this into a TOS strategy script?
I usually do a little write-up on my charts but the strategy always remains the same: trade when multiple indicators agree that change in direction is taking place, and don't be greedy hoping for more. A half profit is better than a double loss!lol I think he was trying to ask if there was any chance that you teach people how to trade!
Great fan of your work by the way! And I really appreciate your generosity in sharing your setups with us! On a side note, have you ever looked into translating this into a TOS strategy script?
have you ever looked into translating this into a TOS strategy script?
True!Translating repainters into a backtesting strategy does not provide any useful analysis.
Obviously, with all the poor signals painted over and only recording the perfect triggers; results will always be skewed.
Don’t fall for the “backtesting fallacy”-real trading isn’t about strict rules for buy/sell from just one indicator. Profitable traders watch for multiple indicators lining up in lots of ways.
@csricksdds charts are successful because his setups are simple to read and help identify those multiple indicator confluences clearly.
It’s not just about indicators. Good risk management-results in better trades. Don’t trade out of FOMO, fear or greed!
Hey Jordan, I really like your setup! Would you mind sharing your heatmap?@csricksdds Great stuff!! For some reason I am unable to get the colors to be red and green for the bars. Any insight on what I am missing? I looked at the code and may shift to blue an white but I only get these pink and baby blue. Thanks in advance
Started from scratch with link and set up my chart with a few other items and GTG.
View attachment 24525
Try this code for the off color histogram and see if it works?For Jordan if you look back up through this thread and copy the code I sent for the same issue before or I will send again when back to my computer in the morning. I have had the same issue before.
You may need to change to declare lower, highlight it and move it up. I know the smarter team says it doesn’t always work but for this one it usually does?Try this code for the off color histogram and see if it works?
# AsGoodAsItGets upper Indicator
#CSR Buy/Sell Arrows with Short/Long Bubbles
#Developed 4-23-23 First Edition 8-23-22 Revised
#Updated 3/16/24 by C. Ricks
declare upper;
input atrreversal =2.0;
def priceh = MovingAverage(AverageType.EXPONENTIAL, high, 5);
def pricel = MovingAverage(AverageType.EXPONENTIAL, low, 5);
def EIL = ZigZagHighLow("price h" = priceh, "price l" = pricel, "percentage reversal" = .01, "absolute reversal" = .05, "atr length" = 5, "atr reversal" = atrreversal).lastL;
def EIH = ZigZagHighLow("price h" = priceh, "price l" = pricel, "percentage reversal" = .01, "absolute reversal" = .05, "atr length" = 5, "atr reversal" = atrreversal).lastH;
plot signaldown = !isNAN(EIH);
signaldown.SetPaintingStrategy(PaintingStrategy.SQUARED_HISTOGRAM);
signaldown.DefineColor("signaldown", Color.Red);
plot signalrevBot = !isNaN(EIL);
Signalrevbot.SetPaintingStrategy(PaintingStrategy.SQUARED_HISTOGRAM);
signalrevBot.DefineColor("signalrevBot", Color.Green);
input usealerts = yes;
alert(usealerts and signaldown[1] == 1, "SHORT", alert.bar, sound.ring);
alert(usealerts and signalrevbot[1] == 1, "LONG", alert.bar, sound.ring);
I would like to unclutter the top of the upper windows of AGAIG, as I keep 4 windows to a page with both upper and lower activated. Can you suggest how I can alter the code to remove or laterally diminish the size of the 'dashboard' so that items like PSAR Trans, Price ~ to ORB and ATR(14) do not block the LONG/SHORT bubbles?
Many kudos for your contributions to this site, as they are sincerely appreciated.\
peregrine
Sarasota, FL
Hello Rick i just want to thank you for everything you share to the community, I have been studying your beautiful strategy, but I want to ask you what requirement you use to take a position once all of them are aligned, I have been seen that when they are aligned, they sometimes disappear. thanks again for replying . God bless you.AGAIG: A Choice Chart Setup for Trading or Scalping
Might be the best?
shared Chart Link: http://tos.mx/!3cBl144F MUST follow these instructions for loading shared links.

I’m always looking for the best trading (scalping) chart, and this is what I’m currently using. First, a big thanks to all the other posters who share their material (I check nearly every post made to this website).
In order for this chart to show more plainly I have taken the after-hours off (normally used by me) and I am showing smaller candles than I personally use, although my favorite is the 5-min. chart with slightly larger Heikin Ashi Candles for trading (scalping) which I use every day.
In this chart I have moved my histogram bars from the lower to the upper chart and, as you can see, they encompass the chart vertically when present. (My brain cell more easily focuses on less to look at and easily see when those bars appear)…!!
When the Red or Green Histogram Bar appears, it means that two indicators are in agreement (the Short/Long 1.75 ATR Chart Bubbles and the 2.0 ATR Histogram Bars). You can see that many of my other AGAIG Arrows are in agreement as well. Since these indicators can repaint, it’s always best to have multiple indicators in agreement before placing trades.
This charting will work on other time frames, and you can pick any favorite stocks to watch. As you can see from these two charts, you don’t need to scan a lot of charts to make a happy trading day. Some of the others I like are AMD, ENPH, PLTR, AMZN, etc. (ones with close Bid/Ask and 5+ ATR (Average True Range). In these two charts, we are looking at the intraday movement within the larger ATR for 4/4/25.
As always, happy trading!
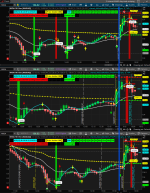
I am trying to use this setup vertically displaying the 4 min, 5 min and 15 min charts one above the other.AGAIG: A Choice Chart Setup for Trading or Scalping
Might be the best?
shared Chart Link: http://tos.mx/!3cBl144F MUST follow these instructions for loading shared links.
I’m always looking for the best trading (scalping) chart, and this is what I’m currently using. First, a big thanks to all the other posters who share their material (I check nearly every post made to this website).
In order for this chart to show more plainly I have taken the after-hours off (normally used by me) and I am showing smaller candles than I personally use, although my favorite is the 5-min. chart with slightly larger Heikin Ashi Candles for trading (scalping) which I use every day.
In this chart I have moved my histogram bars from the lower to the upper chart and, as you can see, they encompass the chart vertically when present. (My brain cell more easily focuses on less to look at and easily see when those bars appear)…!!
When the Red or Green Histogram Bar appears, it means that two indicators are in agreement (the Short/Long 1.75 ATR Chart Bubbles and the 2.0 ATR Histogram Bars). You can see that many of my other AGAIG Arrows are in agreement as well. Since these indicators can repaint, it’s always best to have multiple indicators in agreement before placing trades.
This charting will work on other time frames, and you can pick any favorite stocks to watch. As you can see from these two charts, you don’t need to scan a lot of charts to make a happy trading day. Some of the others I like are AMD, ENPH, PLTR, AMZN, etc. (ones with close Bid/Ask and 5+ ATR (Average True Range). In these two charts, we are looking at the intraday movement within the larger ATR for 4/4/25.
As always, happy trading!
In light of my desire to turn everything into a zigzag or a dashboard... The Dashboard Traffic Light as a dashboard follows.This is what I posted when adding the Dashboard Traffic Light "you might want to add my Dashboard Traffic Light to this chart as well. You can set its time frame to match the one you are using. The Traffic Light looks at direction from multiple perspectives."
declare lower;

#trend, a momentum and a cycle based indicator for ThinkorSwim V2.0
#@hockeycoachdoug Community Request

# 2019.12.30 V1.0 @diazlaz - Community Ask/Release
#https://usethinkscript.com/threads/i-request-help-combining-3-indicators-into-1-paintbar-study.1390/
#Modified by C. Ricks 12/13/23
#Modified by C. Ricks 7/21/24 for Red/Green Trading Lights Only
#Dashboard-izided by whoDAT 6/2/25


#INPUTS
input showLabels = yes;
input enableNeutralMACDPainter = no;
input aggregationPeriod = AggregationPeriod.FIVE_MIN;

input displace = 0;

def h = high;
def l = low;
def o = open;
def c = close;

def h1 = high(period = aggregationPeriod);
def l1 = low(period = aggregationPeriod);
def o1 = open(period = aggregationPeriod);
def c1 = close(period = aggregationPeriod);

def na = Double.NaN;

#HeikinAshiCandles
def HA1open;
def HA1high;
def HA1low;
def HA1close;
HA1open = CompoundValue(1, (HA1open[1] + HA1close[1]) / 2, (o[1] + c[1]) / 2);
HA1high = Max(Max(h, HA1open), HA1close[1]);
HA1low = Min(Min(l, HA1open), HA1close[1]);
HA1close = (o + h + l + c) / 4;
def sHA1 = if HA1close > HA1open then 100 else -100;
plot HA1Dash = 1.2;
HA1Dash.SetPaintingStrategy(PaintingStrategy.SQUARES);
HA1Dash.AssignValueColor(if sHA1 == 100
    then color.GREEN
    else color.RED);


#HeikinAshiCandles MTF
def HA2open;
def HA2high;
def HA2low;
def HA2close;
HA2open = CompoundValue(1, (HA2open[1] + HA2close[1]) / 2, (o1[1] + c1[1]) / 2);
HA2high = Max(Max(h1, HA2open), HA2close[1]);
HA2low = Min(Min(l1, HA2open), HA2close[1]);
HA2close = (o1 + h1 + l1 + c1) / 4;
def sHA2 = if HA2close > HA2open then 100 else -100;
plot HA2Dash = 1.1;
HA2Dash.SetPaintingStrategy(PaintingStrategy.SQUARES);
HA2Dash.AssignValueColor(if sHA2 == 100
    then color.GREEN
    else color.RED);


#TTM Trend
def TrendUp = if TTM_Trend().TrendUp == 1 then 1 else 0;
def TrendDown = if TTM_Trend().TrendDown == 1 then 1 else 0;
def sTTM = if TrendUp then 100 else if TrendDown then -100 else 0;
plot TTMDash = 1.0;
TTMDash.SetPaintingStrategy(PaintingStrategy.SQUARES);
TTMDash.AssignValueColor(if sTTM == 100
    then color.GREEN
    else color.RED);


#SuperTrend (Mobius)
input AtrMult = 2.5; #SuperTrend
input nATR = 4; #SuperTrend
input AvgType = AverageType.Exponential; #SuperTrend
def ATR = MovingAverage(AvgType, TrueRange(high, close, low), nATR);
def UP = HL2 + (AtrMult * ATR);
def DN = HL2 + (-AtrMult * ATR);
def ST = if close < ST[1] then UP else DN;
def sSuperTrend = if close < ST then -100 else 100;
plot STDash = 0.9;
STDash.SetPaintingStrategy(PaintingStrategy.SQUARES);
STDash.AssignValueColor(if sSuperTrend == 100
    then color.GREEN
    else color.RED);


#FREMA
input AA = .1; #FREMA
def CC;
def zeroLine = 0;
def RE1;
def RE2;
def RE3;
def RE4;
def RE5;
def RE6;
def RE7;
def RE8;
def EMA;
CC = if CC[1] == 0 then .9 else 1 – AA;
EMA = AA * close + CC * EMA[1];
RE1 = CC * EMA + EMA[1];
RE2 = Power(CC, 2) * RE1 + RE1[1];
RE3 = Power(CC, 4) * RE2 + RE2[1];
RE4 = Power(CC, 8) * RE3 + RE3[1];
RE5 = Power(CC, 16) * RE4 + RE4[1];
RE6 = Power(CC, 32) * RE5 + RE5[1];
RE7 = Power(CC, 64) * RE6 + RE6[1];
RE8 = Power(CC, 128) * RE7 + RE7[1];
def EMA_Signal = EMA – AA * RE8;
def sFrema = if (EMA_Signal > zeroLine) then 100 else -100;
def FRE_sneutral = 0;
plot FREMADash = 0.8;
FREMADash.SetPaintingStrategy(PaintingStrategy.SQUARES);
FREMADash.AssignValueColor(if sFrema == 100
    then color.GREEN
    else color.RED);


#TMO
input length = 14; #TMO
input calcLength = 5; #TMO
input smoothLength = 3; #TMO
def data = fold i = 0 to length
with s
do s + (if c > getValue(o, i)
then 1
else if c < getValue(o, i)
then - 1
else 0);
def EMA5 = ExpAverage(data, calcLength);
def Main = ExpAverage(EMA5, smoothLength);
def Signal = ExpAverage(Main, smoothLength);
def sMain = if Main > Signal then 100 else -100;
def sSignal = if Main > Signal then 100 else - 100;
def ob = if isNaN(c) then double.nan else round(length * .7);
def os = if isNaN(c) then double.nan else -round(length * .7);
def sTMO = if Main > Signal then 100 else -100;
def TMO_sneutral = 0;
plot TMODash = 0.7;
TMODash.SetPaintingStrategy(PaintingStrategy.SQUARES);
TMODash.AssignValueColor(if sTMO == 100
    then color.GREEN
    else color.RED);


#SLIM
input sSuperFast = 8;
input sFast = 13;
input sSlow = 21;
def SuperFastM1 = ExpAverage(close[-displace], sSuperFast);
def FastM1 = ExpAverage(close[-displace], sFast);
def SlowM1 = ExpAverage(close[-displace], sSlow);
def buyM1 = SuperFastM1 > FastM1 and FastM1 > SlowM1 and low > SuperFastM1;
def stopbuyM1 = SuperFastM1 <= FastM1;
def buynowM1 = !buyM1[1] and buyM1;
def buysignalM1 = CompoundValue(1, if buynowM1 and !stopbuyM1 then 1
else if buysignalM1[1] == 1 and stopbuyM1 then 0 else buysignalM1[1], 0);
def Buy_SignalM1 = buysignalM1[1] == 0 and buysignalM1 == 1;
def Momentum_DownM1 = buysignalM1[1] == 1 and buysignalM1 == 0;
def sellM1 = SuperFastM1 < FastM1 and FastM1 < SlowM1 and high < SuperFastM1;
def stopsellM1 = SuperFastM1 >= FastM1;
def sellnowM1 = !sellM1[1] and sellM1;
def sellsignalM1 = CompoundValue(1, if sellnowM1 and !stopsellM1 then 1
else if sellsignalM1[1] == 1 and stopsellM1 then 0 else sellsignalM1[1], 0);
def Sell_SignalM1 = sellsignalM1[1] == 0 and sellsignalM1;
def Momentum_UpM1 = sellsignalM1[1] == 1 and sellsignalM1 == 0;
def sStateM1 = if Buy_SignalM1 then 100 else if Momentum_UpM1 then 10 else if Sell_SignalM1 then -100 else if Momentum_DownM1 then -10 else sStateM1[1];
def SL1_sneutral = 0;
plot SFM1Dash = 0.6;
SFM1Dash.SetPaintingStrategy(PaintingStrategy.SQUARES);
SFM1Dash.AssignValueColor(if sStateM1 == 100
    then color.GREEN
    else color.RED);


#TOP Cycle Trader
input FastCycleLength = 5; #TOP
input SlowCycleLength = 8; #TOP
def FastVar = ExpAverage((H + L) / 2, FastCycleLength);
def SlowVar = Average((H + L) / 2, SlowCycleLength);
def DiffVar = FastVar - SlowVar;
def pDiffVar = DiffVar;
def pDiffVar2 = DiffVar;
def sTOP = if DiffVar > 0 then 100 else -100;
plot TOPDash = 0.5;
TOPDash.SetPaintingStrategy(PaintingStrategy.SQUARES);
TOPDash.AssignValueColor(if sTOP == 100
    then color.GREEN
    else color.RED);


#DMITrend
input DMIlength = 13;
def hiDiff = high - high[1];
def loDiff = low[1] - low;
def plusDM = if hiDiff > loDiff and hiDiff > 0 then hiDiff else 0;
def minusDM = if loDiff > hiDiff and loDiff > 0 then loDiff else 0;
def ATRDMI = WildersAverage(TrueRange(high, close, low), DMIlength);
Def DIPlus = 100 * WildersAverage(plusDM, DMIlength) / ATRDMI;
Def DIMinus = 100 * WildersAverage(minusDM, DMIlength) / ATRDMI;
def sDMI = if DIPlus > DIMinus then 100 else if DIMinus > DIPlus then -100 else 0;
plot DMIDash = 0.4;
DMIDash.SetPaintingStrategy(PaintingStrategy.SQUARES);
DMIDash.AssignValueColor(if sDMI == 100
    then color.GREEN
    else color.RED);


#BOP indicator
input averageType = {Simple, Exponential, default Weighted, Wilders, Hull, Disabled};
input BoPlength = 16;
def rawBMP = if high != low then (close - open) / (high - low) else 1;
def BMP;
switch (averageType) {
case Simple:
BMP = Average(rawBMP, BoPlength);
case Exponential:
BMP = ExpAverage(rawBMP, BoPlength);
case Weighted:
BMP = wma(rawBMP, BoPlength);
case Wilders:
BMP = WildersAverage(rawBMP, BoPlength);
case Hull:
BMP = HullMovingAvg(rawBMP, BoPlength);
case Disabled:
BMP = rawBMP;
}
def sBOP = if BMP > 0 then 100 else -100;
plot BOPDash = 0.3;
BOPDash.SetPaintingStrategy(PaintingStrategy.SQUARES);
BOPDash.AssignValueColor(if sBOP == 100
    then color.GREEN
    else color.RED);


# SUPERTREND BY MOBIUS AND CCI ATR TREND COMBINED
input lengthCCI = 50;
input lengthATR = 21;
input AtrFactor = 1.0;
def pricedata = hl2;
def ATRcci = Average(TrueRange(h, c, l), lengthATR) * AtrFactor;
def price = c + l + h;
def linDev = LinDev(price, lengthCCI);
def CCI = if linDev == 0
then 0
else (price - Average(price, lengthCCI)) / linDev / 0.015;
def MT1 = if CCI > 0
then Max(MT1[1], pricedata - ATRcci)
else Min(MT1[1], pricedata + ATRcci);
def sSuperTrendCCIATR = if c < MT1 and c < ST then -100 else if C > MT1 and c >ST then 100 else 0;
def STCCI_sneutral = 0;
plot STCCIDash = 0.2;
STCCIDash.SetPaintingStrategy(PaintingStrategy.SQUARES);
STCCIDash.AssignValueColor(if sSuperTrendCCIATR == 100
    then color.GREEN
    else color.RED);


# CCI + TTM squeeze + TTM trend
def CCIBuy = CCI(length = 14).CCI > 0 and CCI(length = 50).CCI > 0;
def CCISell = CCI(length = 14).CCI < 0 and CCI(length = 50).CCI < 0;
def sTrendUp = TTM_Trend().TrendUp;
def sTrendDn = TTM_Trend().TrendDown;
def SqueezeUp = TTM_Squeeze().Histogram >= 0;
def SqueezeDn = TTM_Squeeze().Histogram <= 0;
def Buy = CCIBuy and sTrendUp and SqueezeUp;
def Sell = CCISell and sTrendDn and SqueezeDn;
def sCCITTM = if buy then 100 else if sell then -100 else 0;
plot CCITTMDash = 0.1;
CCITTMDash.SetPaintingStrategy(PaintingStrategy.SQUARES);
CCITTMDash.AssignValueColor(if sCCITTM == 100
    then color.GREEN
    else color.RED);

#END OF trend, a momentum and a cycle based indicator for ThinkorSwim V2.0hello! thank you for sharing your setup. are you using only this chart for scalps or multiple ones for extra confirmation. unless the time labels are enough for scalping purposes.AGAIG: A Choice Chart Setup for Trading or Scalping
Might be the best?
shared Chart Link: http://tos.mx/!3cBl144F MUST follow these instructions for loading shared links.
I’m always looking for the best trading (scalping) chart, and this is what I’m currently using. First, a big thanks to all the other posters who share their material (I check nearly every post made to this website).
In order for this chart to show more plainly I have taken the after-hours off (normally used by me) and I am showing smaller candles than I personally use, although my favorite is the 5-min. chart with slightly larger Heikin Ashi Candles for trading (scalping) which I use every day.
In this chart I have moved my histogram bars from the lower to the upper chart and, as you can see, they encompass the chart vertically when present. (My brain cell more easily focuses on less to look at and easily see when those bars appear)…!!
When the Red or Green Histogram Bar appears, it means that two indicators are in agreement (the Short/Long 1.75 ATR Chart Bubbles and the 2.0 ATR Histogram Bars). You can see that many of my other AGAIG Arrows are in agreement as well. Since these indicators can repaint, it’s always best to have multiple indicators in agreement before placing trades.
This charting will work on other time frames, and you can pick any favorite stocks to watch. As you can see from these two charts, you don’t need to scan a lot of charts to make a happy trading day. Some of the others I like are AMD, ENPH, PLTR, AMZN, etc. (ones with close Bid/Ask and 5+ ATR (Average True Range). In these two charts, we are looking at the intraday movement within the larger ATR for 4/4/25.
As always, happy trading!
No not using Level II data here - only using my 5 min. chart and indicator agreement trends for trading and scalping purposeshello! thank you for sharing your setup. are you using only this chart for scalps or multiple ones for extra confirmation. unless the time labels are enough for scalping purposes.
are you using level 2 as scalping tool? thank you in advance!
For the LowerSquaredHistogram, is there a way to know/or display on the chart when the repaint window have been closed? Or put a label at the top with a percentage of the move to close the repaint window?AGAIG: A Choice Chart Setup for Trading or Scalping
Might be the best?
shared Chart Link: http://tos.mx/!3cBl144F MUST follow these instructions for loading shared links.
I’m always looking for the best trading (scalping) chart, and this is what I’m currently using. First, a big thanks to all the other posters who share their material (I check nearly every post made to this website).
In order for this chart to show more plainly I have taken the after-hours off (normally used by me) and I am showing smaller candles than I personally use, although my favorite is the 5-min. chart with slightly larger Heikin Ashi Candles for trading (scalping) which I use every day.
In this chart I have moved my histogram bars from the lower to the upper chart and, as you can see, they encompass the chart vertically when present. (My brain cell more easily focuses on less to look at and easily see when those bars appear)…!!
When the Red or Green Histogram Bar appears, it means that two indicators are in agreement (the Short/Long 1.75 ATR Chart Bubbles and the 2.0 ATR Histogram Bars). You can see that many of my other AGAIG Arrows are in agreement as well. Since these indicators can repaint, it’s always best to have multiple indicators in agreement before placing trades.
This charting will work on other time frames, and you can pick any favorite stocks to watch. As you can see from these two charts, you don’t need to scan a lot of charts to make a happy trading day. Some of the others I like are AMD, ENPH, PLTR, AMZN, etc. (ones with close Bid/Ask and 5+ ATR (Average True Range). In these two charts, we are looking at the intraday movement within the larger ATR for 4/4/25.
As always, happy trading!
The histogram repaints when price exceeds (above/below) the price level portrayedFor the LowerSquaredHistogram, is there a way to know/or display on the chart when the repaint window have been closed? Or put a label at the top with a percentage of the move to close the repaint window?
Join useThinkScript to post your question to a community of 21,000+ developers and traders.
Start a new thread and receive assistance from our community.
useThinkScript is the #1 community of stock market investors using indicators and other tools to power their trading strategies. Traders of all skill levels use our forums to learn about scripting and indicators, help each other, and discover new ways to gain an edge in the markets.
We get it. Our forum can be intimidating, if not overwhelming. With thousands of topics, tens of thousands of posts, our community has created an incredibly deep knowledge base for stock traders. No one can ever exhaust every resource provided on our site.
If you are new, or just looking for guidance, here are some helpful links to get you started.