
@Rod95 it's the Xbrat heat map I bought one night as something to look at. If I am correct I dont believe I can openly share it? If someone can confirm that it's ok I would share.Hey Jordan, I really like your setup! Would you mind sharing your heatmap?
You are using an out of date browser. It may not display this or other websites correctly.
You should upgrade or use an alternative browser.
You should upgrade or use an alternative browser.
Repaints AGAIG A Choice Chart Setup for Trading or Scalping with ThinkOrSwim
- Thread starter csricksdds
- Start date
-
- Tags
- agaig
Repaints
Sadly no. Commercial / proprietary indicators cannot be shared.@Rod95 it's the Xbrat heat map I bought one night as something to look at. If I am correct I dont believe I can openly share it? If someone can confirm that it's ok I would share.
I see the 3rd chart(bottom) is also 5min... Supposed to be 15min?I am trying to use this setup vertically displaying the 4 min, 5 min and 15 min charts one above the other.
The challenge I am having is that the time lines do not match up.
I have played around with a bunch of options but still end up with them offset (see blue vertical line close to market open).
Any suggestions on how to get them to keep the same time on the x-axis? I understand that since the aggregation periods are different, the bars will be different. However, I'd love to see what they all said at the same point in time.
Thanks.
@csricksdds
How would one add the 24h tracking support back into this version or is there a different version out there that might be better suited for general use trading etc.
(Please forgive the newbie inquiry)
How would one add the 24h tracking support back into this version or is there a different version out there that might be better suited for general use trading etc.
(Please forgive the newbie inquiry)
I’m not sure what you’re asking for?@csricksdds
How would one add the 24h tracking support back into this version or is there a different version out there that might be better suited for general use trading etc.
(Please forgive the newbie inquiry)
Hi @csricksdds ,
My question is how to add shades (background colors) to your "AGAIG Reversals Lower" indicator. I tried to add the lines of code as shown below which didn't work. I hope you could help. Ref: the attached photo showed how POWERFUL your indicator is the 10min chart. Referenced ticker $LCFY, 8AM ET, Friday May 27th.
# AsGoodAsItGets Lower Indicator
#CSR Buy/Sell Arrows with Short/Long Bubbles
#Developed 4-23-23 First Edition 8-23-22 Revised
AssignBackgroundColor(Color.BLACK);
declare lower;
input atrreversal = 2.0;
def priceh = MovingAverage(AverageType.EXPONENTIAL, high, 5);
def pricel = MovingAverage(AverageType.EXPONENTIAL, low, 5);
def EIL = ZigZagHighLow("price h" = priceh, "price l" = pricel, "percentage reversal" = .01, "absolute reversal" = .05, "atr length" = 5, "atr reversal" = atrreversal).lastL;
def EIH = ZigZagHighLow("price h" = priceh, "price l" = pricel, "percentage reversal" = .01, "absolute reversal" = .05, "atr length" = 5, "atr reversal" = atrreversal).lastH;
plot signaldown = !isNAN(EIH);
signaldown.SetPaintingStrategy(PaintingStrategy.SQUARED_HISTOGRAM);
signaldown.SetDefaultColor(Color.MAGENTA);
plot signalrevBot = !isNaN(EIL);
Signalrevbot.SetPaintingStrategy(PaintingStrategy.SQUARED_HISTOGRAM);
Signalrevbot.SetDefaultColor(Color.CYAN);
######################################################################################
DefineGlobalColor("Positive", Color.DARK_GREEN); #UPTICK
DefineGlobalColor("Negative", Color.DARK_RED); #DOWNTICK
#def xcolor = if signalrevBot then 1 else 0;
addcloud(if signalrevBot then double.POSITIVE_INFINITY else double.NEGATIVE_INFINITY, if signaldown then double.NEGATIVE_INFINITY else double.POSITIVE_INFINITY, globalColor("Positive"), globalcolor("Negative"));
#######################################################################################
Attachments
dawwgpound
New member
I love the Histogram lines on the upper chart but I only can find the script for the lower chart
# AsGoodAsItGets upper IndicatorI love the Histogram lines on the upper chart but I only can find the script for the lower chart
#CSR Buy/Sell Arrows with Short/Long Bubbles
#Developed 4-23-23 First Edition 8-23-22 Revised
#Updated 3/16/24 by C. Ricks
declare upper;
input atrreversal =2.0;
def priceh = MovingAverage(AverageType.EXPONENTIAL, high, 5);
def pricel = MovingAverage(AverageType.EXPONENTIAL, low, 5);
def EIL = ZigZagHighLow("price h" = priceh, "price l" = pricel, "percentage reversal" = .01, "absolute reversal" = .05, "atr length" = 5, "atr reversal" = atrreversal).lastL;
def EIH = ZigZagHighLow("price h" = priceh, "price l" = pricel, "percentage reversal" = .01, "absolute reversal" = .05, "atr length" = 5, "atr reversal" = atrreversal).lastH;
plot signaldown = !isNAN(EIH);
signaldown.SetPaintingStrategy(PaintingStrategy.SQUARED_HISTOGRAM);
signaldown.DefineColor("signaldown", Color.Red);
plot signalrevBot = !isNaN(EIL);
Signalrevbot.SetPaintingStrategy(PaintingStrategy.SQUARED_HISTOGRAM);
signalrevBot.DefineColor("signalrevBot", Color.Green);
input usealerts = yes;
alert(usealerts and signaldown[1] == 1, "SHORT", alert.bar, sound.ring);
alert(usealerts and signalrevbot[1] == 1, "LONG", alert.bar, sound.ring);
CajunHammer
New member
Hi newb here to coding. So, I love some these indicators for TOS but cannot for the life of me convert the Indicator with the LONG/SHORT signals to TradingView. I have tried Pine Editor and Grok, but it never comes out the same or shows the same LONG/SHORT on TradingView.
Anyway to get the code for that one indicator, or does anyone have a TradingView conversion for it?
Any help is graciously appreciated!
Anyway to get the code for that one indicator, or does anyone have a TradingView conversion for it?
Any help is graciously appreciated!
And for me for some reason I am unable not only not to get the colors to be red and green but I do not get the bars at all, even if I replace the code?? I can import your chart with everything working but if I save it and open in different window it stops working/ is not showing up? just the AsGoodAsItGets upperSqueredHistogram IndicatorI have had that problem occasionally - under your studies and strategies replace the code with this code?
Code:# AsGoodAsItGets Lower Indicator #CSR Buy/Sell Arrows with Short/Long Bubbles #Developed 4-23-23 First Edition 8-23-22 Revised #Updated 3/16/24 by C. Ricks #Moved to Upper by C.Ricks declare upper; input atrreversal =2.0; def priceh = MovingAverage(AverageType.EXPONENTIAL, high, 5); def pricel = MovingAverage(AverageType.EXPONENTIAL, low, 5); def EIL = ZigZagHighLow("price h" = priceh, "price l" = pricel, "percentage reversal" = .01, "absolute reversal" = .05, "atr length" = 5, "atr reversal" = atrreversal).lastL; def EIH = ZigZagHighLow("price h" = priceh, "price l" = pricel, "percentage reversal" = .01, "absolute reversal" = .05, "atr length" = 5, "atr reversal" = atrreversal).lastH; plot signaldown = !isNAN(EIH); signaldown.SetPaintingStrategy(PaintingStrategy.SQUARED_HISTOGRAM); signaldown.DefineColor("signaldown", Color.Red); plot signalrevBot = !isNaN(EIL); Signalrevbot.SetPaintingStrategy(PaintingStrategy.SQUARED_HISTOGRAM); signalrevBot.DefineColor("signalrevBot", Color.Green); input usealerts = yes; alert(usealerts and signaldown[1] == 1, "SHORT", alert.bar, sound.ring); alert(usealerts and signalrevbot[1] == 1, "LONG", alert.bar, sound.ring);

I'm sorry - I don't know what to tell you...it should work?And for me for some reason I am unable not only not to get the colors to be red and green but I do not get the bars at all, even if I replace the code?? I can import your chart with everything working but if I save it and open in different window it stops working/ is not showing up? just the AsGoodAsItGets upperSqueredHistogram Indicator
HTOWNFANATIC1
New member
Hey there! Thanks for providing this. I've been trying to add this in TOS and I'm getting errors ofIn light of my desire to turn everything into a zigzag or a dashboard... The Dashboard Traffic Light as a dashboard follows.
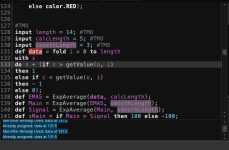
Code:declare lower; #trend, a momentum and a cycle based indicator for ThinkorSwim V2.0 #@hockeycoachdoug Community Request # 2019.12.30 V1.0 @diazlaz - Community Ask/Release #https://usethinkscript.com/threads/i-request-help-combining-3-indicators-into-1-paintbar-study.1390/ #Modified by C. Ricks 12/13/23 #Modified by C. Ricks 7/21/24 for Red/Green Trading Lights Only #Dashboard-izided by whoDAT 6/2/25 #INPUTS input showLabels = yes; input enableNeutralMACDPainter = no; input aggregationPeriod = AggregationPeriod.FIVE_MIN; input displace = 0; def h = high; def l = low; def o = open; def c = close; def h1 = high(period = aggregationPeriod); def l1 = low(period = aggregationPeriod); def o1 = open(period = aggregationPeriod); def c1 = close(period = aggregationPeriod); def na = Double.NaN; #HeikinAshiCandles def HA1open; def HA1high; def HA1low; def HA1close; HA1open = CompoundValue(1, (HA1open[1] + HA1close[1]) / 2, (o[1] + c[1]) / 2); HA1high = Max(Max(h, HA1open), HA1close[1]); HA1low = Min(Min(l, HA1open), HA1close[1]); HA1close = (o + h + l + c) / 4; def sHA1 = if HA1close > HA1open then 100 else -100; plot HA1Dash = 1.2; HA1Dash.SetPaintingStrategy(PaintingStrategy.SQUARES); HA1Dash.AssignValueColor(if sHA1 == 100 then color.GREEN else color.RED); #HeikinAshiCandles MTF def HA2open; def HA2high; def HA2low; def HA2close; HA2open = CompoundValue(1, (HA2open[1] + HA2close[1]) / 2, (o1[1] + c1[1]) / 2); HA2high = Max(Max(h1, HA2open), HA2close[1]); HA2low = Min(Min(l1, HA2open), HA2close[1]); HA2close = (o1 + h1 + l1 + c1) / 4; def sHA2 = if HA2close > HA2open then 100 else -100; plot HA2Dash = 1.1; HA2Dash.SetPaintingStrategy(PaintingStrategy.SQUARES); HA2Dash.AssignValueColor(if sHA2 == 100 then color.GREEN else color.RED); #TTM Trend def TrendUp = if TTM_Trend().TrendUp == 1 then 1 else 0; def TrendDown = if TTM_Trend().TrendDown == 1 then 1 else 0; def sTTM = if TrendUp then 100 else if TrendDown then -100 else 0; plot TTMDash = 1.0; TTMDash.SetPaintingStrategy(PaintingStrategy.SQUARES); TTMDash.AssignValueColor(if sTTM == 100 then color.GREEN else color.RED); #SuperTrend (Mobius) input AtrMult = 2.5; #SuperTrend input nATR = 4; #SuperTrend input AvgType = AverageType.Exponential; #SuperTrend def ATR = MovingAverage(AvgType, TrueRange(high, close, low), nATR); def UP = HL2 + (AtrMult * ATR); def DN = HL2 + (-AtrMult * ATR); def ST = if close < ST[1] then UP else DN; def sSuperTrend = if close < ST then -100 else 100; plot STDash = 0.9; STDash.SetPaintingStrategy(PaintingStrategy.SQUARES); STDash.AssignValueColor(if sSuperTrend == 100 then color.GREEN else color.RED); #FREMA input AA = .1; #FREMA def CC; def zeroLine = 0; def RE1; def RE2; def RE3; def RE4; def RE5; def RE6; def RE7; def RE8; def EMA; CC = if CC[1] == 0 then .9 else 1 – AA; EMA = AA * close + CC * EMA[1]; RE1 = CC * EMA + EMA[1]; RE2 = Power(CC, 2) * RE1 + RE1[1]; RE3 = Power(CC, 4) * RE2 + RE2[1]; RE4 = Power(CC, 8) * RE3 + RE3[1]; RE5 = Power(CC, 16) * RE4 + RE4[1]; RE6 = Power(CC, 32) * RE5 + RE5[1]; RE7 = Power(CC, 64) * RE6 + RE6[1]; RE8 = Power(CC, 128) * RE7 + RE7[1]; def EMA_Signal = EMA – AA * RE8; def sFrema = if (EMA_Signal > zeroLine) then 100 else -100; def FRE_sneutral = 0; plot FREMADash = 0.8; FREMADash.SetPaintingStrategy(PaintingStrategy.SQUARES); FREMADash.AssignValueColor(if sFrema == 100 then color.GREEN else color.RED); #TMO input length = 14; #TMO input calcLength = 5; #TMO input smoothLength = 3; #TMO def data = fold i = 0 to length with s do s + (if c > getValue(o, i) then 1 else if c < getValue(o, i) then - 1 else 0); def EMA5 = ExpAverage(data, calcLength); def Main = ExpAverage(EMA5, smoothLength); def Signal = ExpAverage(Main, smoothLength); def sMain = if Main > Signal then 100 else -100; def sSignal = if Main > Signal then 100 else - 100; def ob = if isNaN(c) then double.nan else round(length * .7); def os = if isNaN(c) then double.nan else -round(length * .7); def sTMO = if Main > Signal then 100 else -100; def TMO_sneutral = 0; plot TMODash = 0.7; TMODash.SetPaintingStrategy(PaintingStrategy.SQUARES); TMODash.AssignValueColor(if sTMO == 100 then color.GREEN else color.RED); #SLIM input sSuperFast = 8; input sFast = 13; input sSlow = 21; def SuperFastM1 = ExpAverage(close[-displace], sSuperFast); def FastM1 = ExpAverage(close[-displace], sFast); def SlowM1 = ExpAverage(close[-displace], sSlow); def buyM1 = SuperFastM1 > FastM1 and FastM1 > SlowM1 and low > SuperFastM1; def stopbuyM1 = SuperFastM1 <= FastM1; def buynowM1 = !buyM1[1] and buyM1; def buysignalM1 = CompoundValue(1, if buynowM1 and !stopbuyM1 then 1 else if buysignalM1[1] == 1 and stopbuyM1 then 0 else buysignalM1[1], 0); def Buy_SignalM1 = buysignalM1[1] == 0 and buysignalM1 == 1; def Momentum_DownM1 = buysignalM1[1] == 1 and buysignalM1 == 0; def sellM1 = SuperFastM1 < FastM1 and FastM1 < SlowM1 and high < SuperFastM1; def stopsellM1 = SuperFastM1 >= FastM1; def sellnowM1 = !sellM1[1] and sellM1; def sellsignalM1 = CompoundValue(1, if sellnowM1 and !stopsellM1 then 1 else if sellsignalM1[1] == 1 and stopsellM1 then 0 else sellsignalM1[1], 0); def Sell_SignalM1 = sellsignalM1[1] == 0 and sellsignalM1; def Momentum_UpM1 = sellsignalM1[1] == 1 and sellsignalM1 == 0; def sStateM1 = if Buy_SignalM1 then 100 else if Momentum_UpM1 then 10 else if Sell_SignalM1 then -100 else if Momentum_DownM1 then -10 else sStateM1[1]; def SL1_sneutral = 0; plot SFM1Dash = 0.6; SFM1Dash.SetPaintingStrategy(PaintingStrategy.SQUARES); SFM1Dash.AssignValueColor(if sStateM1 == 100 then color.GREEN else color.RED); #TOP Cycle Trader input FastCycleLength = 5; #TOP input SlowCycleLength = 8; #TOP def FastVar = ExpAverage((H + L) / 2, FastCycleLength); def SlowVar = Average((H + L) / 2, SlowCycleLength); def DiffVar = FastVar - SlowVar; def pDiffVar = DiffVar; def pDiffVar2 = DiffVar; def sTOP = if DiffVar > 0 then 100 else -100; plot TOPDash = 0.5; TOPDash.SetPaintingStrategy(PaintingStrategy.SQUARES); TOPDash.AssignValueColor(if sTOP == 100 then color.GREEN else color.RED); #DMITrend input DMIlength = 13; def hiDiff = high - high[1]; def loDiff = low[1] - low; def plusDM = if hiDiff > loDiff and hiDiff > 0 then hiDiff else 0; def minusDM = if loDiff > hiDiff and loDiff > 0 then loDiff else 0; def ATRDMI = WildersAverage(TrueRange(high, close, low), DMIlength); Def DIPlus = 100 * WildersAverage(plusDM, DMIlength) / ATRDMI; Def DIMinus = 100 * WildersAverage(minusDM, DMIlength) / ATRDMI; def sDMI = if DIPlus > DIMinus then 100 else if DIMinus > DIPlus then -100 else 0; plot DMIDash = 0.4; DMIDash.SetPaintingStrategy(PaintingStrategy.SQUARES); DMIDash.AssignValueColor(if sDMI == 100 then color.GREEN else color.RED); #BOP indicator input averageType = {Simple, Exponential, default Weighted, Wilders, Hull, Disabled}; input BoPlength = 16; def rawBMP = if high != low then (close - open) / (high - low) else 1; def BMP; switch (averageType) { case Simple: BMP = Average(rawBMP, BoPlength); case Exponential: BMP = ExpAverage(rawBMP, BoPlength); case Weighted: BMP = wma(rawBMP, BoPlength); case Wilders: BMP = WildersAverage(rawBMP, BoPlength); case Hull: BMP = HullMovingAvg(rawBMP, BoPlength); case Disabled: BMP = rawBMP; } def sBOP = if BMP > 0 then 100 else -100; plot BOPDash = 0.3; BOPDash.SetPaintingStrategy(PaintingStrategy.SQUARES); BOPDash.AssignValueColor(if sBOP == 100 then color.GREEN else color.RED); # SUPERTREND BY MOBIUS AND CCI ATR TREND COMBINED input lengthCCI = 50; input lengthATR = 21; input AtrFactor = 1.0; def pricedata = hl2; def ATRcci = Average(TrueRange(h, c, l), lengthATR) * AtrFactor; def price = c + l + h; def linDev = LinDev(price, lengthCCI); def CCI = if linDev == 0 then 0 else (price - Average(price, lengthCCI)) / linDev / 0.015; def MT1 = if CCI > 0 then Max(MT1[1], pricedata - ATRcci) else Min(MT1[1], pricedata + ATRcci); def sSuperTrendCCIATR = if c < MT1 and c < ST then -100 else if C > MT1 and c >ST then 100 else 0; def STCCI_sneutral = 0; plot STCCIDash = 0.2; STCCIDash.SetPaintingStrategy(PaintingStrategy.SQUARES); STCCIDash.AssignValueColor(if sSuperTrendCCIATR == 100 then color.GREEN else color.RED); # CCI + TTM squeeze + TTM trend def CCIBuy = CCI(length = 14).CCI > 0 and CCI(length = 50).CCI > 0; def CCISell = CCI(length = 14).CCI < 0 and CCI(length = 50).CCI < 0; def sTrendUp = TTM_Trend().TrendUp; def sTrendDn = TTM_Trend().TrendDown; def SqueezeUp = TTM_Squeeze().Histogram >= 0; def SqueezeDn = TTM_Squeeze().Histogram <= 0; def Buy = CCIBuy and sTrendUp and SqueezeUp; def Sell = CCISell and sTrendDn and SqueezeDn; def sCCITTM = if buy then 100 else if sell then -100 else 0; plot CCITTMDash = 0.1; CCITTMDash.SetPaintingStrategy(PaintingStrategy.SQUARES); CCITTMDash.AssignValueColor(if sCCITTM == 100 then color.GREEN else color.RED); #END OF trend, a momentum and a cycle based indicator for ThinkorSwim V2.0
View attachment 24872
Identifier Already Used: data at 131:5
Already assigned: data at 131:5
Identifier Already Used: data at 131:5
Already assigned: data at 131:5
Was hoping you could help me identifying what I'm doing wrong. Thanks so much
Attachments
AGAIG: A Choice Chart Setup for Trading or Scalping
Might be the best?
shared Chart Link: http://tos.mx/!3cBl144F MUST follow these instructions for loading shared links.

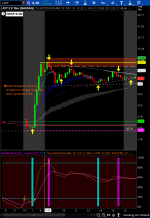
I’m always looking for the best trading (scalping) chart, and this is what I’m currently using. First, a big thanks to all the other posters who share their material (I check nearly every post made to this website).
In order for this chart to show more plainly I have taken the after-hours off (normally used by me) and I am showing smaller candles than I personally use, although my favorite is the 5-min. chart with slightly larger Heikin Ashi Candles for trading (scalping) which I use every day.
In this chart I have moved my histogram bars from the lower to the upper chart and, as you can see, they encompass the chart vertically when present. (My brain cell more easily focuses on less to look at and easily see when those bars appear)…!!
When the Red or Green Histogram Bar appears, it means that two indicators are in agreement (the Short/Long 1.75 ATR Chart Bubbles and the 2.0 ATR Histogram Bars). You can see that many of my other AGAIG Arrows are in agreement as well. Since these indicators can repaint, it’s always best to have multiple indicators in agreement before placing trades.
This charting will work on other time frames, and you can pick any favorite stocks to watch. As you can see from these two charts, you don’t need to scan a lot of charts to make a happy trading day. Some of the others I like are AMD, ENPH, PLTR, AMZN, etc. (ones with close Bid/Ask and 5+ ATR (Average True Range). In these two charts, we are looking at the intraday movement within the larger ATR for 4/4/25.
As always, happy trading!
Hi there—thanks for sharing this chart! I’ve been following your posts and I’m testing out this AGAIG setup now. Really like how everything aligns with ATR bars and the arrows—it keeps things clear and disciplined.
Quick question: Do you ever use this setup for trading options, especially with a small account? I’m more comfortable trading contracts than shares and I’m curious if this approach works well with options plays (like when the signals line up for a quick in-and-out scalp).
Also, I use regular candles instead of Heikin Ashi—wondering if that changes the quality of the entries much in your experience?
Thanks again for sharing—appreciate any thoughts you’re willing to pass along!
Last edited by a moderator:
use this one https://tos.mx/!1zmLTkNVAnd for me for some reason I am unable not only not to get the colors to be red and green but I do not get the bars at all, even if I replace the code?? I can import your chart with everything working but if I save it and open in different window it stops working/ is not showing up? just the AsGoodAsItGets upperSqueredHistogram Indicator
Code:
# AsGoodAsItGets Lower Indicator
#CSR Buy/Sell Arrows with Short/Long Bubbles
#Developed 4-23-23 First Edition 8-23-22 Revised
#Updated 3/16/24 by C. Ricks

declare lower;
declare real_size;

input atrreversal = 2.0;

def priceh = MovingAverage(AverageType.EXPONENTIAL, high, 5);
def pricel = MovingAverage(AverageType.EXPONENTIAL, low, 5);

def EIL = ZigZagHighLow("price h" = priceh, "price l" = pricel, "percentage reversal" = .01, "absolute reversal" = .05, "atr length" = 5, "atr reversal" = atrreversal).lastL;
def EIH = ZigZagHighLow("price h" = priceh, "price l" = pricel, "percentage reversal" = .01, "absolute reversal" = .05, "atr length" = 5, "atr reversal" = atrreversal).lastH;

def signaldown = !isNAN(EIH);
AddVerticalLine(!isNAN(EIH),"SHORT", color.red,curve.long_dash);

def signalrevBot = !isNaN(EIL);
AddVerticalLine(!isNAN(EIL),"LONG", color.Green,curve.long_dash);

input usealerts = yes;
alert(usealerts and signaldown[1] == 1, "Short", alert.bar, sound.ding);
alert(usealerts and signalrevbot[1] == 1, "Long", alert.bar, sound.ding);
Last edited by a moderator:
Hi there—thanks for sharing this chart! I’ve been following your posts and I’m testing out this AGAIG setup now. Really like how everything aligns with ATR bars and the arrows—it keeps things clear and disciplined.
Quick question: Do you ever use this setup for trading options, especially with a small account? I’m more comfortable trading contracts than shares and I’m curious if this approach works well with options plays (like when the signals line up for a quick in-and-out scalp).
Also, I use regular candles instead of Heikin Ashi—wondering if that changes the quality of the entries much in your experience?
Thanks again for sharing—appreciate any thoughts you’re willing to pass along!
I only trade options and buy no stocks. Pull up a dual chart using the same stock. On one use regular candles and on the second use Heikin Ashi and see which one is easiest to follow?
Last edited by a moderator:
@csricksdds Here is a script I wrote for identifying puts to sell https://tos.mx/!1OasqYW7. Place it on any chart of a stock or ETF that trades options. You can adjust your parameters as you know.I only trade options and buy no stocks. Pull up a dual chart using the same stock. On one use regular candles and on the second use Heikin Ashi and see which one is easiest to follow?
Last edited:
Typical Delta for 3% OTM Puts. The delta of a put option that is 3% out-of-the-money (OTM) is typically around:@csricksdds Here is a script I wrote for identifying puts to sell https://tos.mx/!Qkh8czPf. Place it on any chart of a stock or ETF that trades options. You can adjust your parameters as you know.
0.25 to 0.35 (negative delta for puts, so −0.25 to −0.35)
This depends on time to expiration (your script uses 10 DTE), Volatility of the underlying and Interest rates and dividends (minor effect in near-term).
For a 10 DTE Put here’s what you’ll generally see across different tickers:
| Ticker | 3% OTM Delta (Put, 10 DTE) |
| SPY | ~−0.30 |
| AAPL | ~−0.28 to −0.33 |
| TSLA | ~−0.35+ (more volatility) |
| MSFT | ~−0.26 to −0.30 |
- 2% OTM ≈ ~−0.35 delta
- 3% OTM ≈ ~−0.30 delta
- 5% OTM ≈ ~−0.20 delta
Thanks again for the script and your reply—really appreciate you sharing it. I added it to my scans for study, though I mostly day trade options.
Quick question—what specific time frames do you use when you trade? And do you happen to have a scan that identifies stocks that are actively moving and good for scalping? Would love to learn more if you’re open to sharing.
Thanks again—your posts are always solid
Quick question—what specific time frames do you use when you trade? And do you happen to have a scan that identifies stocks that are actively moving and good for scalping? Would love to learn more if you’re open to sharing.
Thanks again—your posts are always solid
DAY SCANNER https://tos.mx/!Y3DLHVX0
EARLY MORNING RUNNERS https://tos.mx/!PUUEurdJ
BREAKOUT ABOVE 30 DAY AVG https://tos.mx/!2SwTmHGM
TMO BULL SCAN https://tos.mx/!ObMcfGat
EARLY MORNING RUNNERS https://tos.mx/!PUUEurdJ
BREAKOUT ABOVE 30 DAY AVG https://tos.mx/!2SwTmHGM
TMO BULL SCAN https://tos.mx/!ObMcfGat
Where in the chart do you see this at i just put on chart aapl nothing shows up help pleaseTypical Delta for 3% OTM Puts. The delta of a put option that is 3% out-of-the-money (OTM) is typically around:
0.25 to 0.35 (negative delta for puts, so −0.25 to −0.35)
This depends on time to expiration (your script uses 10 DTE), Volatility of the underlying and Interest rates and dividends (minor effect in near-term).
For a 10 DTE Put here’s what you’ll generally see across different tickers:
Rule of Thumb:
Ticker 3% OTM Delta (Put, 10 DTE) SPY ~−0.30 AAPL ~−0.28 to −0.33 TSLA ~−0.35+ (more volatility) MSFT ~−0.26 to −0.30
- 2% OTM ≈ ~−0.35 delta
- 3% OTM ≈ ~−0.30 delta
- 5% OTM ≈ ~−0.20 delta
Join useThinkScript to post your question to a community of 21,000+ developers and traders.
Similar threads
-
AGAIG SwingTrading Ichimoku with Stop and Reverse-8 D Chart For ThinkOrSwim
- Started by csricksdds
- Replies: 1
-
Repaints AGAIG Confluence – The Co-Pilot (My Best Trading Chart Ever) For ThinkOrSwim
- Started by csricksdds
- Replies: 26
-
Repaints AGAIG Visual Automation Command Center For ThinkOrSwim
- Started by csricksdds
- Replies: 6
-
Repaints AGAIG Follow The Money - Command Options Trading Chart For ThinkOrSwim
- Started by csricksdds
- Replies: 9
-
Repaints AGAIG Confirming Six Indicator Strategy For ThinkOrSwim
- Started by csricksdds
- Replies: 14
Not the exact question you're looking for?
Start a new thread and receive assistance from our community.
87k+
Posts
1840
Online
Similar threads
-
AGAIG SwingTrading Ichimoku with Stop and Reverse-8 D Chart For ThinkOrSwim
- Started by csricksdds
- Replies: 1
-
Repaints AGAIG Confluence – The Co-Pilot (My Best Trading Chart Ever) For ThinkOrSwim
- Started by csricksdds
- Replies: 26
-
Repaints AGAIG Visual Automation Command Center For ThinkOrSwim
- Started by csricksdds
- Replies: 6
-
Repaints AGAIG Follow The Money - Command Options Trading Chart For ThinkOrSwim
- Started by csricksdds
- Replies: 9
-
Repaints AGAIG Confirming Six Indicator Strategy For ThinkOrSwim
- Started by csricksdds
- Replies: 14
The Market Trading Game Changer
Join 2,500+ subscribers inside the useThinkScript VIP Membership Club
- Exclusive indicators
- Proven strategies & setups
- Private Discord community
- ‘Buy The Dip’ signal alerts
- Exclusive members-only content
- Add-ons and resources
- 1 full year of unlimited support
Frequently Asked Questions
What is useThinkScript?
useThinkScript is the #1 community of stock market investors using indicators and other tools to power their trading strategies. Traders of all skill levels use our forums to learn about scripting and indicators, help each other, and discover new ways to gain an edge in the markets.
How do I get started?
We get it. Our forum can be intimidating, if not overwhelming. With thousands of topics, tens of thousands of posts, our community has created an incredibly deep knowledge base for stock traders. No one can ever exhaust every resource provided on our site.
If you are new, or just looking for guidance, here are some helpful links to get you started.
- The most viewed thread:
https://usethinkscript.com/threads/repainting-trend-reversal-for-thinkorswim.183/ - Our most popular indicator:
https://usethinkscript.com/threads/buy-the-dip-indicator-for-thinkorswim.3553/ - Answers to frequently asked questions:
https://usethinkscript.com/threads/answers-to-commonly-asked-questions.6006/
What are the benefits of VIP Membership?
VIP members get exclusive access to these proven and tested premium indicators: Buy the Dip, Advanced Market Moves 2.0, Take Profit, and Volatility Trading Range. In addition, VIP members get access to over 50 VIP-only custom indicators, add-ons, and strategies, private VIP-only forums, private Discord channel to discuss trades and strategies in real-time, customer support, trade alerts, and much more. Learn all about VIP membership here.
How can I access the premium indicators?
To access the premium indicators, which are plug and play ready, sign up for VIP membership here.