
Thank you very much for sharing these scans. I really appreciate it.DAY SCANNER https://tos.mx/!Y3DLHVX0
EARLY MORNING RUNNERS https://tos.mx/!PUUEurdJ
BREAKOUT ABOVE 30 DAY AVG https://tos.mx/!2SwTmHGM
TMO BULL SCAN https://tos.mx/!ObMcfGat
You are using an out of date browser. It may not display this or other websites correctly.
You should upgrade or use an alternative browser.
You should upgrade or use an alternative browser.
Repaints AGAIG A Choice Chart Setup for Trading or Scalping with ThinkOrSwim
- Thread starter csricksdds
- Start date
-
- Tags
- agaig
Repaints
Join useThinkScript to post your question to a community of 21,000+ developers and traders.
They are just labels that give guidance to potential "safe" options - just points youin the direction for you to start planning a trade.Where in the chart do you see this at i just put on chart aapl nothing shows up help please
Hello,AGAIG: A Choice Chart Setup for Trading or Scalping
Might be the best?
shared Chart Link: http://tos.mx/!3cBl144F MUST follow these instructions for loading shared links.

I’m always looking for the best trading (scalping) chart, and this is what I’m currently using. First, a big thanks to all the other posters who share their material (I check nearly every post made to this website).
In order for this chart to show more plainly I have taken the after-hours off (normally used by me) and I am showing smaller candles than I personally use, although my favorite is the 5-min. chart with slightly larger Heikin Ashi Candles for trading (scalping) which I use every day.
In this chart I have moved my histogram bars from the lower to the upper chart and, as you can see, they encompass the chart vertically when present. (My brain cell more easily focuses on less to look at and easily see when those bars appear)…!!
When the Red or Green Histogram Bar appears, it means that two indicators are in agreement (the Short/Long 1.75 ATR Chart Bubbles and the 2.0 ATR Histogram Bars). You can see that many of my other AGAIG Arrows are in agreement as well. Since these indicators can repaint, it’s always best to have multiple indicators in agreement before placing trades.
This charting will work on other time frames, and you can pick any favorite stocks to watch. As you can see from these two charts, you don’t need to scan a lot of charts to make a happy trading day. Some of the others I like are AMD, ENPH, PLTR, AMZN, etc. (ones with close Bid/Ask and 5+ ATR (Average True Range). In these two charts, we are looking at the intraday movement within the larger ATR for 4/4/25.
As always, happy trading!
I'm very new to thinkscript. I copied the link for this and loaded it into TOS. The problem is I can't find it once I close the page. I tried copying and saving several times with no success. Any suggestions?
I am able to save a script if I do a copy and paste on the entire code, is it possible to get it, so I can try it that way?
Hello,
I'm very new to thinkscript. I copied the link for this and loaded it into TOS. The problem is I can't find it once I close the page. I tried copying and saving several times with no success. Any suggestions?
I am able to save a script if I do a copy and paste on the entire code, is it possible to get it, so I can try it that way?
Here ya go:
https://usethinkscript.com/threads/how-to-use-shared-chart-links.20899/
1) After you copy the link and then Open shared item... and then Import a new Chart opens (with side-by-side chart grids) and then you open the Edit Studies and Strategies dialog with at least 36 studies attached all starting with the name shared_ ...Hello,
I'm very new to thinkscript. I copied the link for this and loaded it into TOS. The problem is I can't find it once I close the page. I tried copying and saving several times with no success. Any suggestions?
I am able to save a script if I do a copy and paste on the entire code, is it possible to get it, so I can try it that way?
2) Select the Save as set... button and give it a name you can easily remember such as DGS_AGAIG and this "set" will contain all 36 studies and can be used in any new Chart or Flexible Grid.
3) You can also save the chart layout for immediate recall:
@csricksdds , Thanks for the chart, I tried building scan using Short/Long Bubbles (AsGoodAsGets_Indicator), but it seems none of the plots in screenshot has value as Long/Short values. Please correct me if I am wrong.AGAIG: A Choice Chart Setup for Trading or Scalping
Might be the best?
shared Chart Link: http://tos.mx/!3cBl144F MUST follow these instructions for loading shared links.
I’m always looking for the best trading (scalping) chart, and this is what I’m currently using. First, a big thanks to all the other posters who share their material (I check nearly every post made to this website).
In order for this chart to show more plainly I have taken the after-hours off (normally used by me) and I am showing smaller candles than I personally use, although my favorite is the 5-min. chart with slightly larger Heikin Ashi Candles for trading (scalping) which I use every day.
In this chart I have moved my histogram bars from the lower to the upper chart and, as you can see, they encompass the chart vertically when present. (My brain cell more easily focuses on less to look at and easily see when those bars appear)…!!
When the Red or Green Histogram Bar appears, it means that two indicators are in agreement (the Short/Long 1.75 ATR Chart Bubbles and the 2.0 ATR Histogram Bars). You can see that many of my other AGAIG Arrows are in agreement as well. Since these indicators can repaint, it’s always best to have multiple indicators in agreement before placing trades.
This charting will work on other time frames, and you can pick any favorite stocks to watch. As you can see from these two charts, you don’t need to scan a lot of charts to make a happy trading day. Some of the others I like are AMD, ENPH, PLTR, AMZN, etc. (ones with close Bid/Ask and 5+ ATR (Average True Range). In these two charts, we are looking at the intraday movement within the larger ATR for 4/4/25.
As always, happy trading!
Attachments
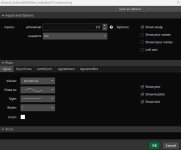
@csricksdds , Thanks for the chart, I tried building scan using Short/Long Bubbles (AsGoodAsGets_Indicator), but it seems none of the plots in screenshot has value as Long/Short values. Please correct me if I am wrong.
Sadly no.
Short/Long repainting Bubbles cannot be used in scan, watchlists or conditional orders because they repaint.
read more:
https://usethinkscript.com/threads/answers-to-commonly-asked-questions.6006/#post-149342
https://usethinkscript.com/threads/answers-to-commonly-asked-questions.6006/#post-57833
The AGAIG chart setups are an excellent representation on the correct use of repainting indicators as part of price action analysis.
This setup only works when you analyze the interaction of ALL the indicators on the whole chart.
Never ever take a trade based solely on a repainting signal.
@csricksdds recommends using the Short/Long repainting Bubbles with these non-repainters
https://usethinkscript.com/threads/agaig-trading-guide-summary-in-thinkorswim.19935/
https://usethinkscript.com/threads/...ses-repaint-indicators-for-thinkorswim.20126/
https://usethinkscript.com/threads/agaig-daytrading-scalping-for-success-in-thinkorswim.20383/
It is not time-effective to scan the universe of stocks when using @csricksdds AGAIG chart setups.
It is simply not necessary.
There are not many instruments that have the liquidity and solid ATR movement that qualify, so no need to scan.
You can trade the AGAIG chart setups with futures, highly liquid ETfs and these stocks:
https://usethinkscript.com/threads/best-stocks-to-scalp-and-day-trade.20523/
Read through @csricksdds threads to find which instruments, he has had success trading:
https://usethinkscript.com/search/1...4&c[nodes][1]=5&c[title_only]=1&o=replies&g=1
Last edited by a moderator:
Thanks for quick response.Sadly no.
Short/Long repainting Bubbles cannot be used in scan, watchlists or conditional orders because they repaint.
read more:
https://usethinkscript.com/threads/answers-to-commonly-asked-questions.6006/#post-149342
https://usethinkscript.com/threads/answers-to-commonly-asked-questions.6006/#post-57833
The AGAIG chart setups are an excellent representation on the correct use of repainting indicators as part of price action analysis.
This setup only works when you analyze the interaction of ALL the indicators on the whole chart.
Never ever take a trade based solely on a repainting signal.
@csricksdds recommends using the Short/Long repainting Bubbles with these non-repainters
(which, yes, you can scan for)
https://usethinkscript.com/threads/agaig-trading-guide-summary-in-thinkorswim.19935/
https://usethinkscript.com/threads/...ses-repaint-indicators-for-thinkorswim.20126/
https://usethinkscript.com/threads/agaig-daytrading-scalping-for-success-in-thinkorswim.20383/
It is not time-effective to scan the universe of stocks when using @csricksdds AGAIG chart setups.
It is simply not necessary.
There are not many instruments that have the liquidity and solid ATR movement that qualify, so no need to scan.
You can trade the AGAIG chart setups with futures, highly liquid ETfs and these stocks:
https://usethinkscript.com/threads/best-stocks-to-scalp-and-day-trade.20523/
Read through @csricksdds threads to find which instruments, he has had success trading:
https://usethinkscript.com/search/1...4&c[nodes][1]=5&c[title_only]=1&o=replies&g=1
The scan has to exclude the zig zag for sure - java don't play that in recursive TOS stuff, too complicated. A work around is needed - here is a scan that accomplishes a near return that looks for a new local low (or high) over a given length of bars (default = 5) and a scan hit on the bar immediately after the low/high forms. This is much faster and safer for TOS scanners than the recursive ZigZag function. Remember you can go into scan set up and change the time frames that it scans.Thanks for quick response.
https://tos.mx/!MKVYGbug
Thank you @antwerksThe scan has to exclude the zig zag for sure - java don't play that in recursive TOS stuff, too complicated. A work around is needed - here is a scan that accomplishes a near return that looks for a new local low (or high) over a given length of bars (default = 5) and a scan hit on the bar immediately after the low/high forms. This is much faster and safer for TOS scanners than the recursive ZigZag function. Remember you can go into scan set up and change the time frames that it scans.
https://tos.mx/!MKVYGbug
View attachment 25320
View attachment 25321
Just a follow up (although quite early in the move) - We see the continuation of the two examples from the scan moving in the anticipated directions. Pretty cool...Thanks for quick response.
carlosevangelista
New member
Hi there—thanks for sharing this chart! I’ve been following your posts and I’m testing out this AGAIG setup now. Really like how everything aligns with ATR bars and the arrows—it keeps things clear and disciplined.
Quick question: Do you ever use this setup for trading options, especially with a small account? I’m more comfortable trading contracts than shares and I’m curious if this approach works well with options plays (like when the signals line up for a quick in-and-out scalp).
Also, I use regular candles instead of Heikin Ashi—wondering if that changes the quality of the entries much in your experience?
Thanks again for sharing—appreciate any thoughts you’re willing to pass along!
@csricksdds ,AGAIG: A Choice Chart Setup for Trading or Scalping
Might be the best?
shared Chart Link: http://tos.mx/!3cBl144F MUST follow these instructions for loading shared links.
I’m always looking for the best trading (scalping) chart, and this is what I’m currently using. First, a big thanks to all the other posters who share their material (I check nearly every post made to this website).
In order for this chart to show more plainly I have taken the after-hours off (normally used by me) and I am showing smaller candles than I personally use, although my favorite is the 5-min. chart with slightly larger Heikin Ashi Candles for trading (scalping) which I use every day.
In this chart I have moved my histogram bars from the lower to the upper chart and, as you can see, they encompass the chart vertically when present. (My brain cell more easily focuses on less to look at and easily see when those bars appear)…!!
When the Red or Green Histogram Bar appears, it means that two indicators are in agreement (the Short/Long 1.75 ATR Chart Bubbles and the 2.0 ATR Histogram Bars). You can see that many of my other AGAIG Arrows are in agreement as well. Since these indicators can repaint, it’s always best to have multiple indicators in agreement before placing trades.
This charting will work on other time frames, and you can pick any favorite stocks to watch. As you can see from these two charts, you don’t need to scan a lot of charts to make a happy trading day. Some of the others I like are AMD, ENPH, PLTR, AMZN, etc. (ones with close Bid/Ask and 5+ ATR (Average True Range). In these two charts, we are looking at the intraday movement within the larger ATR for 4/4/25.
As always, happy trading!
How are you?
I'm studying your indicators and would like to ask:
1 - To swing trade using this indicator, what do I need to change in the strategy you described?
2 - What would be the best timeframe for swing trading? My idea is to buy contracts with 7 and a maximum of 14 days to expiration on the trading day;
Congratulations on your excellent work and for sharing your knowledge. Who knows, maybe one day I'll be able to help you in this way.
@csricksdds ,
How are you?
I'm studying your indicators and would like to ask:
1 - To swing trade using this indicator, what do I need to change in the strategy you described?
2 - What would be the best timeframe for swing trading? My idea is to buy contracts with 7 and a maximum of 14 days to expiration on the trading day;
Congratulations on your excellent work and for sharing your knowledge. Who knows, maybe one day I'll be able to help you in this way.
I'm fine...just getting older. Thanks for asking.
I use my charting for both day trading and swing trading and make my entries from my 5 min. charts and 7 - 14 days out is fine. Even when I swing trade my plan is to close it as soon as it reaches my target price, many times before the day ends. Most of my swings are for expensive stocks (more contracts less cost) and I usually do them with a 10+point spread (or more) and will close if up 50% or more. I also frequently will do more expensive stocks overnight if they are in a pullback near end of day and then look for a breakout at opening the next morning.
Hello, I am new at this. I am using your
AGAIG: A Choice Chart Setup for Trading or Scalping
Might be the best?
It is fabulous, but my problem is: I do the proper download and opened shared, but after I save it, it becomes corrupt and will not work. I have tried many times to no avail! Can you help me. (is it because of all those separate scripts??? Thank you...Richard
I'm sorry you're having issues. I just checked and it works on this end. First highlight the link and copy the link. Then on TOS set-up wheel click on open shared item. Paste the link using ctrl-V and it should load. Click on Preview with the open shared item highlighted (checked) and preee import). It should open after a few seconds. You can enlarge the new chart by dragging the edges. It should be properly labeled AGAIG_MyBestScalpingChartDual. There is a dual box just to the upper right. Click on it to open and go down to SaveGridAs click on that and see if the box says it it saving the chart as written. You should then be able to find it on thew same dropdown after you close the chart by clicking on AGAIG-MyBestScalpingChartDual?Hello, I am new at this. I am using your
AGAIG: A Choice Chart Setup for Trading or Scalping
Might be the best?
It is fabulous, but my problem is: I do the proper download and opened shared, but after I save it, it becomes corrupt and will not work. I have tried many times to no avail! Can you help me. (is it because of all those separate scripts??? Thank you...Richard
@rocket2004 @csricksdds
Tutorial for using and saving shared charts:
https://usethinkscript.com/threads/how-to-save-shared-charts.21369/
Tutorial for using and saving shared charts:
https://usethinkscript.com/threads/how-to-save-shared-charts.21369/
Last edited by a moderator:
autoloader
Active member
Is there any way to put an alarm on the AGAIG buy/sell arrows or is that not possible because of the repainting?
There are alerts on the AsGoodAsItGETS_Indicator but not on the arrows as they are a "heads-up" and too many alarms I thought would be distracting?Is there any way to put an alarm on the AGAIG buy/sell arrows or is that not possible because of the repainting?
autoloader
Active member
Well…maybe you’re right about that. By the way, I really appreciate your contributions to this forum. Your AGAIG codes are excellent.There are alerts on the AsGoodAsItGETS_Indicator but not on the arrows as they are a "heads-up" and too many alarms I thought would be distracting?
Thanks for the kind words!Well…maybe you’re right about that. By the way, I really appreciate your contributions to this forum. Your AGAIG codes are excellent.
Similar threads
-
AGAIG SwingTrading Ichimoku with Stop and Reverse-8 D Chart For ThinkOrSwim
- Started by csricksdds
- Replies: 1
-
Repaints AGAIG Confluence – The Co-Pilot (My Best Trading Chart Ever) For ThinkOrSwim
- Started by csricksdds
- Replies: 26
-
Repaints AGAIG Visual Automation Command Center For ThinkOrSwim
- Started by csricksdds
- Replies: 6
-
Repaints AGAIG Follow The Money - Command Options Trading Chart For ThinkOrSwim
- Started by csricksdds
- Replies: 9
-
Repaints AGAIG Confirming Six Indicator Strategy For ThinkOrSwim
- Started by csricksdds
- Replies: 14
Not the exact question you're looking for?
Start a new thread and receive assistance from our community.
87k+
Posts
2043
Online
Similar threads
-
AGAIG SwingTrading Ichimoku with Stop and Reverse-8 D Chart For ThinkOrSwim
- Started by csricksdds
- Replies: 1
-
Repaints AGAIG Confluence – The Co-Pilot (My Best Trading Chart Ever) For ThinkOrSwim
- Started by csricksdds
- Replies: 26
-
Repaints AGAIG Visual Automation Command Center For ThinkOrSwim
- Started by csricksdds
- Replies: 6
-
Repaints AGAIG Follow The Money - Command Options Trading Chart For ThinkOrSwim
- Started by csricksdds
- Replies: 9
-
Repaints AGAIG Confirming Six Indicator Strategy For ThinkOrSwim
- Started by csricksdds
- Replies: 14
The Market Trading Game Changer
Join 2,500+ subscribers inside the useThinkScript VIP Membership Club
- Exclusive indicators
- Proven strategies & setups
- Private Discord community
- ‘Buy The Dip’ signal alerts
- Exclusive members-only content
- Add-ons and resources
- 1 full year of unlimited support
Frequently Asked Questions
What is useThinkScript?
useThinkScript is the #1 community of stock market investors using indicators and other tools to power their trading strategies. Traders of all skill levels use our forums to learn about scripting and indicators, help each other, and discover new ways to gain an edge in the markets.
How do I get started?
We get it. Our forum can be intimidating, if not overwhelming. With thousands of topics, tens of thousands of posts, our community has created an incredibly deep knowledge base for stock traders. No one can ever exhaust every resource provided on our site.
If you are new, or just looking for guidance, here are some helpful links to get you started.
- The most viewed thread:
https://usethinkscript.com/threads/repainting-trend-reversal-for-thinkorswim.183/ - Our most popular indicator:
https://usethinkscript.com/threads/buy-the-dip-indicator-for-thinkorswim.3553/ - Answers to frequently asked questions:
https://usethinkscript.com/threads/answers-to-commonly-asked-questions.6006/
What are the benefits of VIP Membership?
VIP members get exclusive access to these proven and tested premium indicators: Buy the Dip, Advanced Market Moves 2.0, Take Profit, and Volatility Trading Range. In addition, VIP members get access to over 50 VIP-only custom indicators, add-ons, and strategies, private VIP-only forums, private Discord channel to discuss trades and strategies in real-time, customer support, trade alerts, and much more. Learn all about VIP membership here.
How can I access the premium indicators?
To access the premium indicators, which are plug and play ready, sign up for VIP membership here.