ADX Crossover Indicator System for ThinkorSwim

jox51

Member
2019 Donor
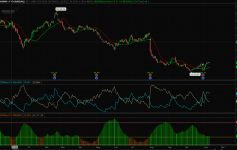
The below indicator is a replica of the ADX system that Chris Moody coded for TradingView at the link below. Feel free to edit and use as you wish. He uses the Gann Swing Hi Low indicator, I used the PSAR indicator as an alternate. Some images attached below.

8aaf5917b9544d844ecdf21ad69fefa4.png
946031012b241388f8e8b36fe85142d2.png


ADXDMIGannHiLow code below.

Code:
#
# This study attempts to replicate Chris Moody's ADX System for TOS. All credit goes to him. This study incorporates the GannHiLo study to determine the swing hi's and lows.

# Take a look at the video here where he explains this system.
# https://vimeopro.com/user32804960/tradingview-indicators/video/112194301

# This study attempts to catch the beginning of a swing move in a trending underlying. What you want to do is waiting for crossovers of the DI+/DI- respectively while the ADX is beginning to Trend above 20 while the ParabolicSAR is in a supportive Swing High or Low. The buy/sell signals will alert you to this. Use your own discretion.

# When the ADX is over 40, the trend is exhausted and you should be looking at exiting your positions.

# Load this indicator along with the ADXMod and DMIMod indicators.

# Gann High Low
# Converted by theelderwand
# Original https://in.tradingview.com/script/XNQSLIYb-Gann-High-Low/

input HPeriod= 13;
input LPeriod= 21;

def HLd = if close > SimpleMovingAvg(high, HPeriod)[1]
          then 1
          else (if close< SimpleMovingAvg(low, LPeriod)[1]
                then -1
                else 0);

def HLv = if HLd != 0 then HLd else 0;

plot HiLo = if HLv == -1
           then SimpleMovingAvg(high, HPeriod)
           else SimpleMovingAvg(low, LPeriod);

HiLo.AssignValueColor(if HLv==-1 then Color.Red else Color.Green);

#Below code is for ADX and DMI confirmation

input length = 14;
input averageType = AverageType.WILDERS;

def hiDiff = high - high[1];
def loDiff = low[1] - low;

def plusDM = if hiDiff > loDiff and hiDiff > 0 then hiDiff else 0;
def minusDM =  if loDiff > hiDiff and loDiff > 0 then loDiff else 0;

def ATR = MovingAverage(averageType, TrueRange(high, close, low), length);
def "DI+" = 100 * MovingAverage(averageType, plusDM, length) / ATR;
def "DI-" = 100 * MovingAverage(averageType, minusDM, length) / ATR;

def DX = if ("DI+" + "DI-" > 0) then 100 * AbsValue("DI+" - "DI-") / ("DI+" + "DI-") else 0;
def ADX = MovingAverage(averageType, DX, length);


#Defines buy and sell setups


def buy = ADX > 20 && ADX > ADX[1] && "DI+" crosses above "DI-" && HLv<>-1;

def sell = ADX > 20 && ADX > ADX[1] && "DI-" crosses above "DI+" && HLv==-1;


# Plot Signals
plot buysignal = buy;
buysignal.SetPaintingStrategy(PaintingStrategy.BOOLEAN_ARROW_UP);
buysignal.SetDefaultColor(Color.CYAN);
buysignal.SetLineWeight(1);
plot sellsignal = sell;
sellsignal.SetPaintingStrategy(PaintingStrategy.BOOLEAN_ARROW_DOWN);
sellsignal.SetDefaultColor(Color.CYAN);
sellsignal.SetLineWeight(1);

Video illustration: https://vimeopro.com/user32804960/tradingview-indicators/video/112194301

ADXMod code https://tos.mx/PRaxsci

DMIMod code below https://tos.mx/CUaFybK

Incorporated the GannHiLow study to stay true to the original system.

Thanks @BenTen for pointing me to the GannHiLo study on this site.
 

Attachments

  • 8aaf5917b9544d844ecdf21ad69fefa4.png
    8aaf5917b9544d844ecdf21ad69fefa4.png
    336.2 KB · Views: 573
Last edited:

Join useThinkScript to post your question to a community of 21,000+ developers and traders.

Hi @jox51 -awesome ty! - the buy and sell plots are not plotting not sure if the HLv criteria is valid I changed the buy from <> to != and it started the buy signal, haven't seen a sell condition triggered yet. Have you compared GANN to the PSAR? Something I added to backlog to test. thanks for the conversion.

Here's the built-in ADX crossover script from ThinkorSwim

Code:
#wizard text: ADX crosses
#wizard input: crossingType
#wizard input: threshold
#wizard text: Inputs: length:
#wizard input: length

input length = 14;
input crossingType = {default above, below};
input threshold = 20;
input averageType = AverageType.WILDERS;

plot signal = crosses(DMI(length, averageType).ADX, threshold, crossingType == CrossingType.above);

signal.DefineColor("Above", GetColor(0));
signal.DefineColor("Below", GetColor(1));
signal.AssignValueColor(if crossingType == CrossingType.above then signal.color("Above") else signal.color("Below"));

signal.SetPaintingStrategy(if crossingType == CrossingType.above
    then PaintingStrategy.BOOLEAN_ARROW_UP
    else PaintingStrategy.BOOLEAN_ARROW_DOWN);
 
I am trying to add a column on my watch list that will tell me how many bars in a row a specified condition has been meet
The condition is DMI+ is greater than or equal to 25 and DMI- is less than or equal to 20 and the ADX is greater than or = to 20
So when this first happens I would like the column to say the number 1 and if it happens for a second candle in a row I would like it to say the number 2 and so on until it doesn't happen than it would drop off my list
 
Does anyone know of a multi-time frame ADX script? From what I gather because ADX calls up another study (DMI) it isn't as simple as input Period = aggregationPeriod.DAY; or similar.

i.e., I want to be on a 1m chart but have an ADX indicator showing me ADX on 5m.

Thanks!
 
@hashy Here is a multi-timeframe ADX -
Code:
# Multi-Timeframe ADX
# based on DMI indicator code by TD Ameritrade IP Company, Inc. (c) 2008-2020

declare lower;

input length = 14;
input averageType = AverageType.WILDERS;
input aggregation = aggregationperiod.FIVE_MIN;
def h = high(period = aggregation);
def l = low(period = aggregation);
def c = close(period = aggregation);

def hiDiff = h - h[1];
def loDiff = l[1] - l;

def plusDM = if hiDiff > loDiff and hiDiff > 0 then hiDiff else 0;
def minusDM =  if loDiff > hiDiff and loDiff > 0 then loDiff else 0;

def ATR = MovingAverage(averageType, TrueRange(h, c, l), length);

def "DI+" = 100 * MovingAverage(averageType, plusDM, length) / ATR;
def "DI-" = 100 * MovingAverage(averageType, minusDM, length) / ATR;

def DX = if ("DI+" + "DI-" > 0) then 100 * AbsValue("DI+" - "DI-") / ("DI+" + "DI-") else 0;
plot ADX = MovingAverage(averageType, DX, length);
     ADX.SetDefaultColor(GetColor(5));
 
@MBF Here's the scan code for ADX above 24. Place this in the scanner. I obtained 214 hits on the S&P 500 on a daily aggregation scan

Code:
input length = 14;
input averageType = AverageType.WILDERS;
def ADX = DMI(length, averageType).ADX;
plot scan = ADX > 24;
 
So I don't own the code. I found it on the web but it is what I was looking for. I also just want to say sorry if this is a stupid question. Is there anyway to add a condition to this code that the ADX has to be above 25?

Code:
input length = 14;
input averageType = AverageType.WILDERS;
input threshold = 20;
input lookBack = 90;
def hiDiff = high - high[1];
def loDiff = low[1] - low;
def plusDM = if hiDiff > loDiff and hiDiff > 0 then hiDiff else 0;
def minusDM = if loDiff > hiDiff and loDiff > 0 then loDiff else 0;
def ATR = MovingAverage(averageType, TrueRange(high, close, low), length);
def diPlus = 100 * MovingAverage(averageType, plusDM, length) / ATR;
def diMinus = 100 * MovingAverage(averageType, minusDM, length) / ATR;
def DX = if (diPlus + diMinus > 0) then 100 * AbsValue(diPlus - diMinus) / (diPlus + diMinus) else 0;
def diPlusCrossesAbove = diPlus[1] < diMinus[1] and diPlus > diMinus;
def diPlusCrossesBelow = diPlus[1] > diMinus[1] and diPlus < diMinus;
# use this scan to check for DI+ crossing above DI-
plot scan = Highest(diPlusCrossesAbove[1], lookBack) < 1 and diPlusCrossesAbove;
# use this scan to check for DI+ crossing below DI-
#plot scan = Highest(diPlusCrossesBelow[1], lookBack) < 1 and diPlusCrossesBelow;
 
Last edited by a moderator:
@malinois1983 Here you go... Notice the 1st line and the addition to the end of your plot line...

Ruby:
def adx = ADX() >= 25;
input length = 14;
input averageType = AverageType.WILDERS;
input threshold = 20;
input lookBack = 90;
def hiDiff = high - high[1];
def loDiff = low[1] - low;
def plusDM = if hiDiff > loDiff and hiDiff > 0 then hiDiff else 0;
def minusDM = if loDiff > hiDiff and loDiff > 0 then loDiff else 0;
def ATR = MovingAverage(averageType, TrueRange(high, close, low), length);
def diPlus = 100 * MovingAverage(averageType, plusDM, length) / ATR;
def diMinus = 100 * MovingAverage(averageType, minusDM, length) / ATR;
def DX = if (diPlus + diMinus > 0) then 100 * AbsValue(diPlus - diMinus) / (diPlus + diMinus) else 0;
def diPlusCrossesAbove = diPlus[1] < diMinus[1] and diPlus > diMinus;
def diPlusCrossesBelow = diPlus[1] > diMinus[1] and diPlus < diMinus;
# use this scan to check for DI+ crossing above DI-
plot scan = Highest(diPlusCrossesAbove[1], lookBack) < 1 and diPlusCrossesAbove;
# use this scan to check for DI+ crossing below DI-
#plot scan = Highest(diPlusCrossesBelow[1], lookBack) < 1 and diPlusCrossesBelow and adx;
 

Similar threads

Not the exact question you're looking for?

Start a new thread and receive assistance from our community.

87k+ Posts
451 Online
Create Post

Similar threads

Similar threads

The Market Trading Game Changer

Join 2,500+ subscribers inside the useThinkScript VIP Membership Club
  • Exclusive indicators
  • Proven strategies & setups
  • Private Discord community
  • ‘Buy The Dip’ signal alerts
  • Exclusive members-only content
  • Add-ons and resources
  • 1 full year of unlimited support

Frequently Asked Questions

What is useThinkScript?

useThinkScript is the #1 community of stock market investors using indicators and other tools to power their trading strategies. Traders of all skill levels use our forums to learn about scripting and indicators, help each other, and discover new ways to gain an edge in the markets.

How do I get started?

We get it. Our forum can be intimidating, if not overwhelming. With thousands of topics, tens of thousands of posts, our community has created an incredibly deep knowledge base for stock traders. No one can ever exhaust every resource provided on our site.

If you are new, or just looking for guidance, here are some helpful links to get you started.

What are the benefits of VIP Membership?
VIP members get exclusive access to these proven and tested premium indicators: Buy the Dip, Advanced Market Moves 2.0, Take Profit, and Volatility Trading Range. In addition, VIP members get access to over 50 VIP-only custom indicators, add-ons, and strategies, private VIP-only forums, private Discord channel to discuss trades and strategies in real-time, customer support, trade alerts, and much more. Learn all about VIP membership here.
How can I access the premium indicators?
To access the premium indicators, which are plug and play ready, sign up for VIP membership here.
Back
Top