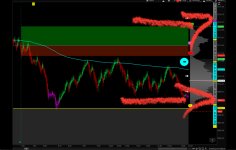
Is there anyway possible to have this indicator
https://usethinkscript.com/threads/market-indicator.15785/
plot vertically on the right side of the expansion side of the chart?
script Sector {
input symb = "/CL";
def c = close(symbol = symb, period = AggregationPeriod.DAY);
def PctChg = (c / c[1]) - 1;
plot pct = PctChg;
}
input timeframe = AggregationPeriod.day;
input market = {"SPY", "VIX", "QQQ", "DIA", default "/CL"};
input showlabels = yes;
def CL = Sector("/CL");
def clPer = Round(CL, 4) * 100;
def CurrCL = +close("/CL", period = AggregationPeriod.DAY);
def ChangeCL = CurrCL - CurrCL[1];
AddLabel(showlabels, "CL: " + Round(ChangeCL) + " (" + clPer + "%" + ") ", if clPer > 0 then Color.CYAN else Color.GRAY);
AddLabel(showlabels, ":", Color.MAGENTA);
def SPX = Sector("SPX");
def spxPer = Round(SPX, 4) * 100;
def CurrSP = +close("SPX", period = AggregationPeriod.DAY);
def ChangeSP = CurrSP - CurrSP[1];
AddLabel(showlabels, "SPX: " + AsText(ChangeSP, NumberFormat.TWO_DECIMAL_PLACES) + " (" + spxPer + "%" + ") ", if spxPer > 0 then Color.CYAN else Color.GRAY);
AddLabel(showlabels, ":", Color.YELLOW);
def NDX = Sector("NDX");
def NDXPer = Round(NDX, 4) * 100;
def CurrNDX = +close("NDX", period = AggregationPeriod.DAY);
def ChangeNDX = CurrNDX - CurrNDX[1];
AddLabel(showlabels, "NDX: " + AsText(ChangeNDX, NumberFormat.TWO_DECIMAL_PLACES) + " (" + NDXPer + "%" + ") ", if NDXPer > 0 then Color.CYAN else Color.GRAY);
AddLabel(showlabels, ":", Color.YELLOW);
def DJI = Sector("$DJI");
def djiPer = Round(DJI, 4) * 100;
def CurrDJ = +close("$DJI", period = AggregationPeriod.DAY);
def ChangeDJ = CurrDJ - CurrDJ[1];
AddLabel(showlabels, "DJI: " + AsText(ChangeDJ, NumberFormat.TWO_DECIMAL_PLACES) + " (" + djiPer + "%" + ") ", if djiPer > 0 then Color.CYAN else Color.GRAY);
AddLabel(showlabels, ":", Color.YELLOW);
def COMP = Sector("COMP:GIDS");
def compPer = Round(COMP, 4) * 100;
def CurrC = +close("COMP:GIDS", period = AggregationPeriod.DAY);
def ChangeC = CurrC - CurrC[1];
AddLabel(showlabels, "COMP: " + AsText(ChangeC, NumberFormat.TWO_DECIMAL_PLACES) + " (" + compPer + "%" + ") ", if compPer > 0 then Color.CYAN else Color.GRAY);
AddLabel(showlabels, ":", Color.YELLOW);
def RUT = Sector("RUT");
def rutPer = Round(RUT, 4) * 100;
def CurrRU = +close("RUT", period = AggregationPeriod.DAY);
def ChangeRU = CurrRU - CurrRU[1];
addLabel(showlabels, "RUT: " + AsText(ChangeC, NumberFormat.TWO_DECIMAL_PLACES) + " (" + rutPer + "%" + ") ", if rutPer > 0 then COLOR.CYAN else color.GRAY);
AddLabel(showlabels, "||", Color.YELLOW);
AddLabel(showlabels, " ", Color.BLACK);
https://usethinkscript.com/threads/market-indicator.15785/
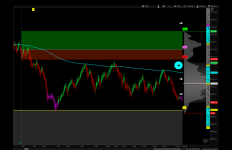
plot vertically on the right side of the expansion side of the chart?
script Sector {
input symb = "/CL";
def c = close(symbol = symb, period = AggregationPeriod.DAY);
def PctChg = (c / c[1]) - 1;
plot pct = PctChg;
}
input timeframe = AggregationPeriod.day;
input market = {"SPY", "VIX", "QQQ", "DIA", default "/CL"};
input showlabels = yes;
def CL = Sector("/CL");
def clPer = Round(CL, 4) * 100;
def CurrCL = +close("/CL", period = AggregationPeriod.DAY);
def ChangeCL = CurrCL - CurrCL[1];
AddLabel(showlabels, "CL: " + Round(ChangeCL) + " (" + clPer + "%" + ") ", if clPer > 0 then Color.CYAN else Color.GRAY);
AddLabel(showlabels, ":", Color.MAGENTA);
def SPX = Sector("SPX");
def spxPer = Round(SPX, 4) * 100;
def CurrSP = +close("SPX", period = AggregationPeriod.DAY);
def ChangeSP = CurrSP - CurrSP[1];
AddLabel(showlabels, "SPX: " + AsText(ChangeSP, NumberFormat.TWO_DECIMAL_PLACES) + " (" + spxPer + "%" + ") ", if spxPer > 0 then Color.CYAN else Color.GRAY);
AddLabel(showlabels, ":", Color.YELLOW);
def NDX = Sector("NDX");
def NDXPer = Round(NDX, 4) * 100;
def CurrNDX = +close("NDX", period = AggregationPeriod.DAY);
def ChangeNDX = CurrNDX - CurrNDX[1];
AddLabel(showlabels, "NDX: " + AsText(ChangeNDX, NumberFormat.TWO_DECIMAL_PLACES) + " (" + NDXPer + "%" + ") ", if NDXPer > 0 then Color.CYAN else Color.GRAY);
AddLabel(showlabels, ":", Color.YELLOW);
def DJI = Sector("$DJI");
def djiPer = Round(DJI, 4) * 100;
def CurrDJ = +close("$DJI", period = AggregationPeriod.DAY);
def ChangeDJ = CurrDJ - CurrDJ[1];
AddLabel(showlabels, "DJI: " + AsText(ChangeDJ, NumberFormat.TWO_DECIMAL_PLACES) + " (" + djiPer + "%" + ") ", if djiPer > 0 then Color.CYAN else Color.GRAY);
AddLabel(showlabels, ":", Color.YELLOW);
def COMP = Sector("COMP:GIDS");
def compPer = Round(COMP, 4) * 100;
def CurrC = +close("COMP:GIDS", period = AggregationPeriod.DAY);
def ChangeC = CurrC - CurrC[1];
AddLabel(showlabels, "COMP: " + AsText(ChangeC, NumberFormat.TWO_DECIMAL_PLACES) + " (" + compPer + "%" + ") ", if compPer > 0 then Color.CYAN else Color.GRAY);
AddLabel(showlabels, ":", Color.YELLOW);
def RUT = Sector("RUT");
def rutPer = Round(RUT, 4) * 100;
def CurrRU = +close("RUT", period = AggregationPeriod.DAY);
def ChangeRU = CurrRU - CurrRU[1];
addLabel(showlabels, "RUT: " + AsText(ChangeC, NumberFormat.TWO_DECIMAL_PLACES) + " (" + rutPer + "%" + ") ", if rutPer > 0 then COLOR.CYAN else color.GRAY);
AddLabel(showlabels, "||", Color.YELLOW);
AddLabel(showlabels, " ", Color.BLACK);
Attachments
Last edited by a moderator: