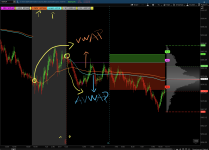
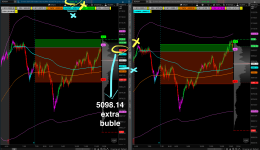
Can someone check and see why the anchor VWAP (AVWAP) does not plot anything nor show the value for the label created?
Code:
input timeFrame = {default DAY, WEEK, MONTH};
input begin = 0930;
input end = 1030;
input numDevUp1 = 1.0;
input numDevUP2 = 2.0;
input numDevUP3 = 3.0;
input numDevDn1 = -1.0;
input numDevDn2 = -2.0;
input numDevDn3 = -3.0;
input volAvgLength = 50;
input labels = yes;

def rth = SecondsFromTime(begin) >= 0 and SecondsTillTime(end) >= 0;
def cap = GetAggregationPeriod();
def errorInAggregation =
timeFrame == timeFrame.DAY and cap >= AggregationPeriod.WEEK or
timeFrame == timeFrame.WEEK and cap >= AggregationPeriod.MONTH;
Assert(!errorInAggregation, "timeFrame should be not less than current chart aggregation period");

def yyyyMmDd = GetYYYYMMDD();
def periodIndx;
switch (timeFrame) {
case DAY:
periodIndx = yyyyMmDd;
case WEEK:
periodIndx = Floor((DaysFromDate(First(yyyyMmDd)) + GetDayOfWeek(First(yyyyMmDd))) / 7);
case MONTH:
periodIndx = RoundDown(yyyyMmDd / 100, 0);
}
def isPeriodRolled = CompoundValue(1, periodIndx != periodIndx[1], yes);

def volumeSum;
def volumeVwapSum;
def volumeVwap2Sum;

if (isPeriodRolled) {
volumeSum = volume;
volumeVwapSum = volume * vwap;
volumeVwap2Sum = volume * Sqr(vwap);
} else {
volumeSum = CompoundValue(1, volumeSum[1] + volume, volume);
volumeVwapSum = CompoundValue(1, volumeVwapSum[1] + volume * vwap, volume * vwap);
volumeVwap2Sum = CompoundValue(1, volumeVwap2Sum[1] + volume * Sqr(vwap), volume * Sqr(vwap));
}
def price = volumeVwapSum / volumeSum;
def deviation = Sqrt(Max(volumeVwap2Sum / volumeSum - Sqr(price), 0));

plot VWAP = price;
plot UpperBand1 = price + numDevUp1 * deviation;
plot UpperBand2 = price + numDevUP2 * deviation;
plot UpperBand3 = price + numDevUP3 * deviation;
plot LowerBand1 = price + numDevDn1 * deviation;
plot LowerBand2 = price + numDevDn2 * deviation;
plot LowerBand3 = price + numDevDn3 * deviation;

VWAP.SetDefaultColor(GetColor(0));
UpperBand1.SetDefaultColor(GetColor(2));
UpperBand2.SetDefaultColor(GetColor(2));
UpperBand3.SetDefaultColor(GetColor(2));
LowerBand1.SetDefaultColor(GetColor(4));
LowerBand2.SetDefaultColor(GetColor(4));
LowerBand3.SetDefaultColor(GetColor(4));

plot AVWAP = price and rth;

AVWAP.SetDefaultColor(GetColor(0));

def volumeSum2 = if rth then CompoundValue(1, volumeSum2[1] + volume, volume) else 0;
def volumeVwapSum2 = if rth then CompoundValue(1, volumeVwapSum2[1] + volume * AVWAP, volume * AVWAP) else 0;
def volumeVwap2Sum2 = if rth then CompoundValue(1, volumeVwap2Sum2[1] + volume * Sqr(AVWAP), volume * Sqr(AVWAP)) else 0;
def price2 = volumeVwapSum2 / volumeSum2;
def deviation2 = Sqrt(Max(volumeVwap2Sum2 / volumeSum2 - Sqr(price2), 0));

AddLabel(labels, (if close > LowerBand3 then " [ -SD3 ]" else " [ -SD3 ]") + " " + AsText(LowerBand3) + " ", if close <= LowerBand2 then Color.CYAN else Color.LIGHT_GRAY );

AddLabel(labels, ":", Color.YELLOW);

AddLabel(labels, (if close > LowerBand2 then " [ -SD2 ]" else " [ -SD2 ]") + " " + AsText(LowerBand2) + " ", if close <= LowerBand1 and close > LowerBand2 then Color.MAGENTA else Color.LIGHT_GRAY);

AddLabel(labels, ":", Color.YELLOW);

AddLabel(labels, (if close > LowerBand1 then " [ -SD1 ]" else " [ -SD1] ") + " " + AsText(LowerBand1) + " ", if close < VWAP and close > LowerBand1 then Color.RED else Color.LIGHT_GRAY);

AddLabel(labels, ":", Color.YELLOW);

AddLabel(labels, (if close > VWAP then " [ VWAP ]" else " [ -VWAP ]") + " " + AsText(VWAP) + " ", if close > VWAP then Color.DARK_ORANGE else Color.DARK_ORANGE);

#AddLabel(labels, ":", Color.YELLOW);

AddLabel(labels, (if close > AVWAP and rth then " [ AVWAP ]" else " [ -AVWAP ]") + " " + AsText(AVWAP and rth) + " ", if close > AVWAP and rth then Color.CYAN else Color.CYAN);

AddLabel(labels, ":", Color.YELLOW);

AddLabel(labels, (if close > UpperBand1 then " [ SD1 ]" else " [ SD1 ]") + " " + AsText(UpperBand1) + " ", if close > VWAP and close < UpperBand1 then Color.GREEN else Color.LIGHT_GRAY);

AddLabel(labels, ":", Color.YELLOW);

AddLabel(labels, (if close > UpperBand2 then " [ SD2 ]" else " [ SD2 ]") + " " + AsText(UpperBand2) + " ", if close >= UpperBand1 and close < UpperBand2 then Color.MAGENTA else Color.LIGHT_GRAY);

AddLabel(labels, ":", Color.YELLOW);

AddLabel(labels, (if close > UpperBand3 then " [ SD3 ]" else " [ SD3 ]") + " " + AsText(UpperBand3) + " ", if close >= UpperBand2 then Color.CYAN else Color.LIGHT_GRAY);

def Vol = volume;
def VolAvg = Average(volume, VolAvgLength);

def above_volume = Vol > VolAvg;
def bullish_vwap = close crosses above VWAP;

plot bull = above_volume and bullish_vwap;
bull.AssignValueColor(Color.CYAN);
bull.SetPaintingStrategy(PaintingStrategy.BOOLEAN_ARROW_UP);

def bearish_vwap = close crosses below VWAP;
plot bear = above_volume and bearish_vwap;
bear.AssignValueColor(Color.MAGENTA);
bear.SetPaintingStrategy(PaintingStrategy.BOOLEAN_ARROW_DOWN);

AddLabel(labels, "||", Color.YELLOW);
Last edited by a moderator: