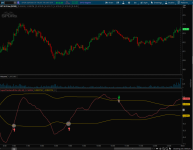
Hello everyone, I'm testing the built-in Super Passband filter in TOS and wanted to know if there is a way to plot down arrows when SuperPassbandFilter line crosses below +RMS and up arrows when SuperPassbandFilter line crosses over -RMS.
See attached screen!
Also, is there a way to build stock scanner for that please!
#
# TD Ameritrade IP Company, Inc. (c) 2016-2022
#
declare lower;
input length1 = 40;
input length2 = 60;
Assert(length1 >= 3, "'length1' must be greater than or equal to 3: " + length1);
Assert(length2 > length1, "'length2' must be greater than 'length1': " + length2);
def a1 = 5 / length1;
def a2 = 5 / length2;
def PB = (a1 - a2) * close + (a2 * (1 - a1) - a1 * (1 - a2)) * close[1] + ((1 - a1) + (1 - a2)) * PB[1] - (1 - a1) * (1 - a2) * PB[2];
def RMS = Sqrt(Average(Sqr(PB), 50));
plot SuperPassbandFilter = PB;
plot "+RMS" = RMS;
plot "-RMS" = -RMS;
plot ZeroLine = 0;
SuperPassbandFilter.SetDefaultColor(GetColor(5));
"+RMS".SetDefaultColor(GetColor(4));
"-RMS".SetDefaultColor(GetColor(4));
ZeroLine.SetDefaultColor(GetColor(7));

