A Stock's DNA --Know Before You Trade In ThinkOrSwim

merryDay

Administrative
Staff member
Staff
VIP
Lifetime

Trading Stock DNA: Why Float, Institutional Ownership, and Geopolitics Destroy Technical Patterns​


Technical chart patterns do not randomly implode. Liquidity, supply turnover, and institutional involvement dictate whether a support line holds or crumbles.
Traders who apply the same setups, the same squeeze, the same magic arrows across the universe of stocks are doomed to failure because they ignore order flow mechanics.
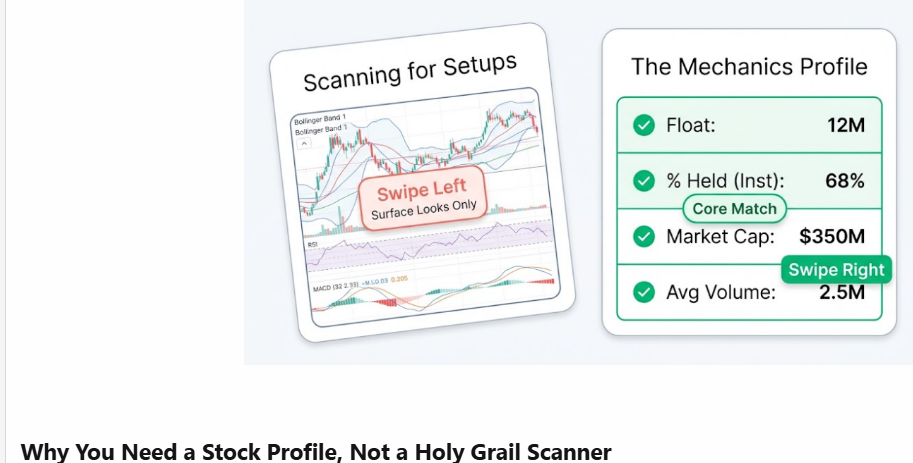
A pattern is merely a visual footprint of buying and selling pressure which moves differently depending on float, % held by institutions, and market cap.

TL;DR
Key Metric CriteriaRepresentative TickersTrading Behavioral Rules
The House Always Wins (Bellweathers)Float > 1.5 Billion, Inst. Held 91% to >100%MSFT, V, MA, BAC, SCHWHigh liquidity sponges. Extreme respect for 200 SMA and VWAP mean-reversion. Avoid chasing momentum breakouts; trade pullbacks and iron condors.
Retail Heavyweights & Meme BagsHigh Float, Retail Held > 70-85%, Heavy Social SentimentBABA, GME, AMC, PLTRProne to sentiment bubbles and sudden structural crashes. Technical support frequently fails on high volume because no institutional bid exists underneath.
Low-Float Volatility RocketsFloat < 50M, Inst. Held < 30%, High Rel VolSAVA, MULN, HKD, Top Daily ScannersViolent order book imbalances and slippage. Trade micro-wedge setups above daily high-of-day. Hard stops mandatory; never hold over multi-day periods due to dilution risk.
Geopolitical & Tariff Sensitive Foreign ADRsForeign Registration (China, Canada), Inst. Capital Flight RiskBIDU, JD, PDD, SE, Canadian Miners (NTR, SHOP)Overnight gap risk dominates chart technicals. News catalysts invalidate classical technical setups instantly. Strict trade termination upon policy shifts or trade war escalation.


The Mechanical Impact of Market Cap, Float, and % Held​

Float defines supply elasticity.

In low float stocks under 50 million shares, limited supply creates extreme order book imbalances, severe slippage, and violent price expansion where support and resistance levels get completely bypassed.

Heavy floats over several hundred million shares act as liquidity sponges, absorbing high volume with minimal price movement and causing pattern breakouts to repeatedly stall against massive limit order walls.

Institutional ownership percentage dictates who controls the order book.
When institutional ownership exceeds 90%, price action is governed by algorithmic execution models, VWAP rebalancing, dark pool absorption, and systematic 200-day moving average defends.

When institutional ownership drops below 40%, the stock loses structural bid support. Without institutional market makers absorbing sell volume, price action becomes fragile, subject to retail panic, predatory shorting, and severe dilution traps.

Stock Profile CategoryStructural CriteriaOrder Flow MechanicsPrimary Pattern BehaviorTechnical Failure Points
Low Float MomentumFloat under 50M, Inst. Held under 40%Supply scarcity causes extreme order book imbalances, rapid bid-ask expansion, and high volume turnover per minute.ABCD breakouts, parabolic morning spikes, and fast micro-wedge continuations above VWAP.Patterns collapse instantly when momentum fades, liquidity vanishes, or corporate equity offerings hit the tape.
Heavy Retail / DistributionHigh Float, Inst. Held under 40%Absence of institutional buyers leaves price reliant on retail sentiment, creating massive overhead bagholder supply on every bounce.Failed dead-cat bounces, descending triangles, and persistent lower-high distribution ramps.Support levels repeatedly break down because no institutional market makers step in to defend the bid.
Algorithmic CoreMid to Large Cap, Inst. Held 40% to 91%Balanced liquidity provided by institutional execution algorithms running TWAP, VWAP, and index-tracking models.Respects key moving averages like the 20 EMA and 200 SMA, Wyckoff accumulation bases, and clean pullback retests.Breakouts fail when broader market indexes experience sudden liquidity contractions or systematic de-risking.
Over-InstitutionalizedLarge/Mega Cap, Inst. Held over 90%Order flow is completely dominated by automated market makers, dark pools, and systematic portfolio rebalancing.Tight consolidation channels, predictable mean-reversion to the 200-day SMA, and VWAP bands.Directional momentum stalls quickly as algorithms sell into strength and absorb dips to maintain target allocations.
 
Last edited:

Join useThinkScript to post your question to a community of 21,000+ developers and traders.

Archetypal Technical Patterns by Stock DNA

Institutional traders
trade order flow, not arbitrary shapes on a chart.
The 200-day simple moving average serves as the primary structural dividing line for institutional mandates, where price above triggers systematic buying and price below forces algorithmic risk reduction.
Institutional setups rely heavily on consolidation bases, VWAP hold patterns, and pullbacks to key exponential moving averages like the 9 EMA and 20 EMA, where large orders can be executed without moving the market.

Conversely, retail-dominated and meme patterns rely on momentum setups, such as high-volume break-outs from psychological price levels and gamma squeezes driven by heavy short-dated call option buying.

Low-float day trading patterns operate entirely on supply shock setups, where short squeezes force panic buying above daily high-of-day resistance levels.


Pattern ArchetypeTarget Asset ClassMechanical Execution Rules
Institutional 200-SMA & VWAP ReversionLarge Caps with 40% to 90% Institutional OwnershipAlgorithms defend the 200-day SMA on daily timeframes and execute VWAP pullbacks on intraday charts. Entry occurs on confirmed volume-backed retests of these key moving averages during institutional trading hours.
Low-Float Parabolic BreakoutStocks with Float under 50M and high relative volumePrice consolidates in a tight micro-wedge near pre-market highs. The trigger occurs as volume swells beyond total float capacity, forcing shorts to cover and creating parabolic price expansion across minor resistance levels.
Retail Sentiment & Option Gamma SqueezeHigh-short-interest tickers with retail ownership over 70%Aggressive retail call buying forces market makers to buy underlying stock to maintain delta-neutral hedging. Technical breakouts occur non-linearly, bypassing standard Fibonacci extension levels until call option volume drops.


Additional Category to Highlight: The Institutional De-Risking / Abandonment Watchlist
Former institutional favorites undergoing fundamental distribution.
Institutional ownership plunging from over 75% down below 40%.
These stocks are entering a multi-year technical downtrend characterized by repeated failed technical bounces and bear flags on the daily timeframes as funds sell into every retail rally.
Examples include INTEL (INTC) and legacy sAs stocks.
 
Last edited:
FYI:
Why Institutional Ownership Frequently Exceeds 100%


Stocks with high institutional ownership reported will routinely top 100% due to short selling and lagged SEC reporting cycles.

When Institution A lends 10 million shares to a short seller who sells them to Institution B, both Institution A and Institution B report owning those 10 million shares on their mandatory 13F filings. Because reporting dates are quarterly and asynchronous, double-counting occurs on paper across clearinghouses.

Furthermore, T+1 settlement cycles create temporary accounting overlaps where shares sold by one fund are simultaneously reported as settled by the buyer while still appearing on the seller's institutional balance sheet.
 
Last edited by a moderator:

Similar threads

Not the exact question you're looking for?

Start a new thread and receive assistance from our community.

87k+ Posts
1140 Online
Create Post

Similar threads

Similar threads

The Market Trading Game Changer

Join 2,500+ subscribers inside the useThinkScript VIP Membership Club
  • Exclusive indicators
  • Proven strategies & setups
  • Private Discord community
  • ‘Buy The Dip’ signal alerts
  • Exclusive members-only content
  • Add-ons and resources
  • 1 full year of unlimited support

Frequently Asked Questions

What is useThinkScript?

useThinkScript is the #1 community of stock market investors using indicators and other tools to power their trading strategies. Traders of all skill levels use our forums to learn about scripting and indicators, help each other, and discover new ways to gain an edge in the markets.

How do I get started?

We get it. Our forum can be intimidating, if not overwhelming. With thousands of topics, tens of thousands of posts, our community has created an incredibly deep knowledge base for stock traders. No one can ever exhaust every resource provided on our site.

If you are new, or just looking for guidance, here are some helpful links to get you started.

What are the benefits of VIP Membership?
VIP members get exclusive access to these proven and tested premium indicators: Buy the Dip, Advanced Market Moves 2.0, Take Profit, and Volatility Trading Range. In addition, VIP members get access to over 50 VIP-only custom indicators, add-ons, and strategies, private VIP-only forums, private Discord channel to discuss trades and strategies in real-time, customer support, trade alerts, and much more. Learn all about VIP membership here.
How can I access the premium indicators?
To access the premium indicators, which are plug and play ready, sign up for VIP membership here.
Back
Top