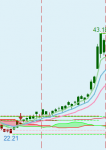
Here is a multi-moving averages indicator for ThinkorSwim so that you can easily add more than one simple or exponential moving averages without adding multiple indicators. Normally if you want to add a 5 and 10 SMA into your chart, you would need to include 2 different inputs and 2 copies of the same indicator. Now you don't have to. With this indicator, you can include 3 SMA or EMA into your chart in a single indicator.
The indicator is fully customizable and includes crossover signals (Bullish and Bearish) as well.

All credit goes to Robert.
The indicator is fully customizable and includes crossover signals (Bullish and Bearish) as well.
thinkScript Code
Rich (BB code):
# E-Charts v2

declare upper;
input short_average = 5;
input medium_average = 10;
input long_average = 20;
input average_type = {default "SMA", "EMA"};
input show_vertical_line = no;
input show_bubble_labels = yes;

def MA1;
def MA2;
def MA3;
switch (average_type) {
case "SMA":
    MA1 = Average(close, short_average);
    MA2 = Average(close, medium_average);
    MA3 = Average(close, long_average);
case "EMA":
    MA1 = ExpAverage(close, short_average);
    MA2 = ExpAverage(close, medium_average);
    MA3 = ExpAverage(close, long_average);
}

# define e-signal and crossover point
def Eup = MA1 > MA2 && MA2 > MA3;
def Edn = MA1 < MA2 && MA2 < MA3;

def CrossUp = close > MA1 && Eup && !Eup[1];
def CrossDn = close < MA1 && Edn && !Edn[1];

# Define up and down signals
def higherHigh = close > Highest(max(open,close), 3)[1];
def lowerLow = close < Lowest(min(open,close), 3)[1];
def SignalUp = if (CrossUp && higherHigh)
    then 1
        else if    (CrossUp[1] && higherHigh && !higherHigh[1])
    then 1
        else if    (CrossUp[2] && higherHigh && !higherHigh[1] && !higherHigh[2])
    then 1
        else Double.NaN;
def SignalDn = if (CrossDn && lowerLow)
    then 1
        else if (CrossDn[1] && lowerLow && !lowerLow[1])
    then 1
        else if (CrossDn[2] && lowerLow && !lowerLow[1] && !lowerLow[2])
    then 1
        else Double.NaN;

# Plot the moving average lines
plot ln1 = MA1;
ln1.SetDefaultColor(CreateColor(145, 210, 144));
ln1.SetLineWeight(2);
plot ln2 = MA2;
ln2.SetDefaultColor(CreateColor(111, 183, 214));
ln2.SetLineWeight(2);
plot ln3 = MA3;
ln3.SetDefaultColor(CreateColor(249, 140, 182));
ln3.SetLineWeight(2);

# Draw vertical line to indicate call and put signals
AddVerticalLine(SignalUp && show_vertical_line, "Up", Color.UPTICK);
AddVerticalLine(SignalDn && show_vertical_line, "Down", Color.LIGHT_RED);

# Show Call / Put Signal in a Chart Bubble
AddChartBubble(SignalUp && show_bubble_labels, low - 0.3, "Up", Color.UPTICK, no);
AddChartBubble(SignalDn && show_bubble_labels, high + 0.3, "Dn", Color.LIGHT_RED);

# Add label for Eup or Edn
AddLabel(Eup, "E Up", Color.GREEN);
AddLabel(Edn, "E Dn", Color.RED);
Shareable Link
https://tos.mx/XxwhcPAll credit goes to Robert.
Last edited:

