This thread is locked. For the newest version of Mike Webster's Really Simple Indicator:This thread is still available for reading.To navigate this thread, here is a great hack for searching many-paged threads.
Hi, all
Couldn't find this anywhere in here so I thought I would share. Mike originally wrote this for TradeStation but recently shared his translation via ThinkScript for TOS.
Per Mike Webster:
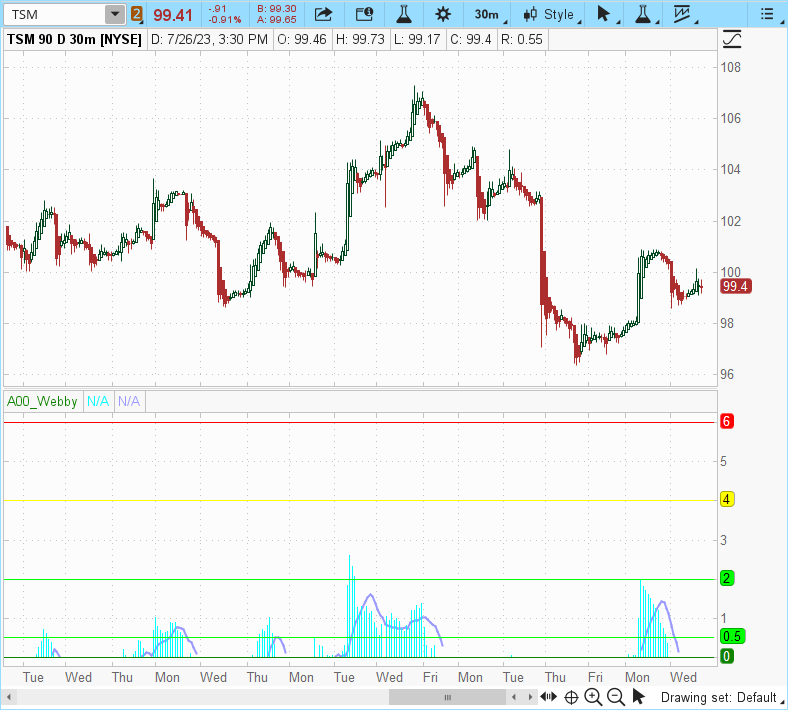
In 1978, the famous technician J. Welles Wilder Jr. introduced the Relative Strength Index (RSI) overbought/oversold indicator, which has become very popular. This RSI has nothing to do with that great invention. Webster's RSI (aka Webby's RSI or MW-RSI) is something the Stock Market Update uses to gauge the health of an uptrend. It's simply the percentage of the low vs. the 21-day moving average.
That's it. Therefore the name Really Simple Indicator (MW-RSI). The MW-RSI is plotted at the bottom of the chart. Because it's a bull market indicator, only positive values are shown. So if the low goes below the 21-day, no value will be displayed. The two green lines on the bottom represent the ideal, between 0.5% to 2.0% above the 21-day. The yellow line is 4.0% above the 21-day and the red line is 6.0% above.
The very beginning of a bull market should show power. This translates into high values. The higher, the better. You can see we had several days between 4% and 5%. Once the trend is established, the ideal area is between 0.5% and 2.0%.
Here is the lower indicator code:
Code:
# Webby's RSI (Really Simple Indicator)
# Plot percentage of the day's low vs 21-day EMA.
#
# More details on Webby's RSI
# https://www.investors.com/market-trend/stock-market-update-raging-bull-rests/
#
# Webby's RSI is featured each week in IBD's Weekend Stock Market Update
# https://www.investors.com/tag/weekend-stock-market-update/
#
# Webby's RSI was written by Mike Webster in EasyLanguage for TradeStation
# Follow Mike on Twitter: @mwebster1971 http://twitter.com/mwebster1971
#
# Ported to ThinkScript by John Muchow
# Follow John on Twitter: @JohnMuchow http://twitter.com/JohnMuchow
# Web: https://PlayTheTrade.com

#----------------------------------------------------------
# Setup
#----------------------------------------------------------
# Show data in lower window
declare lower;

# Calculate 21-day EMA of close
def _21DayExpMovingAverage = ExpAverage(close, 21);

# Webby RSI data point - percent of day's low vs 21-day EMA
def lowVs21DayMovingAverage = (((low - _21DayExpMovingAverage) / close) * 100);

# Calculate simple moving average of data points over 10 days
def _10DayMovingAverage = Average(lowVs21DayMovingAverage, 10);

#----------------------------------------------------------
# Show lines on graph at various intervals
#----------------------------------------------------------
plot _0Line = 0;
_0Line.HideTitle();

plot _pt5Line = .5;
_pt5Line.setDefaultColor(Color.GREEN);
_pt5Line.HideTitle();

plot _2line = 2;
_2line.setDefaultColor(Color.GREEN);
_2line.HideTitle();

plot _4line = 4;
_4line.setDefaultColor(Color.YELLOW);
_4line.HideTitle();

plot _6Line = 6;
_6Line.setDefaultColor(Color.RED);
_6line.HideTitle();

#----------------------------------------------------------
# Plot histogram for Webby RSI, ignoring negative values
#----------------------------------------------------------
def isPointNegative = Sign(lowVs21DayMovingAverage) == -1;
plot histogram = if !isPointNegative then AbsValue(lowVs21DayMovingAverage) else double.nan;
histogram.SetPaintingStrategy(PaintingStrategy.HISTOGRAM);
histogram.setDefaultColor(Color.CYAN);

#----------------------------------------------------------
# Plot line showing moving average across the histogram
#----------------------------------------------------------
def isMovingAveragePointNegative = Sign(_10DayMovingAverage) == -1;
plot line = if !isMovingAveragePointNegative then AbsValue(_10DayMovingAverage) else double.nan;
line.setDefaultColor(Color.VIOLET);
line.setLineWeight(2);
Last edited by a moderator:

