



Scroll down to check out this week's must reads, carefully selected by uTS Moderators!

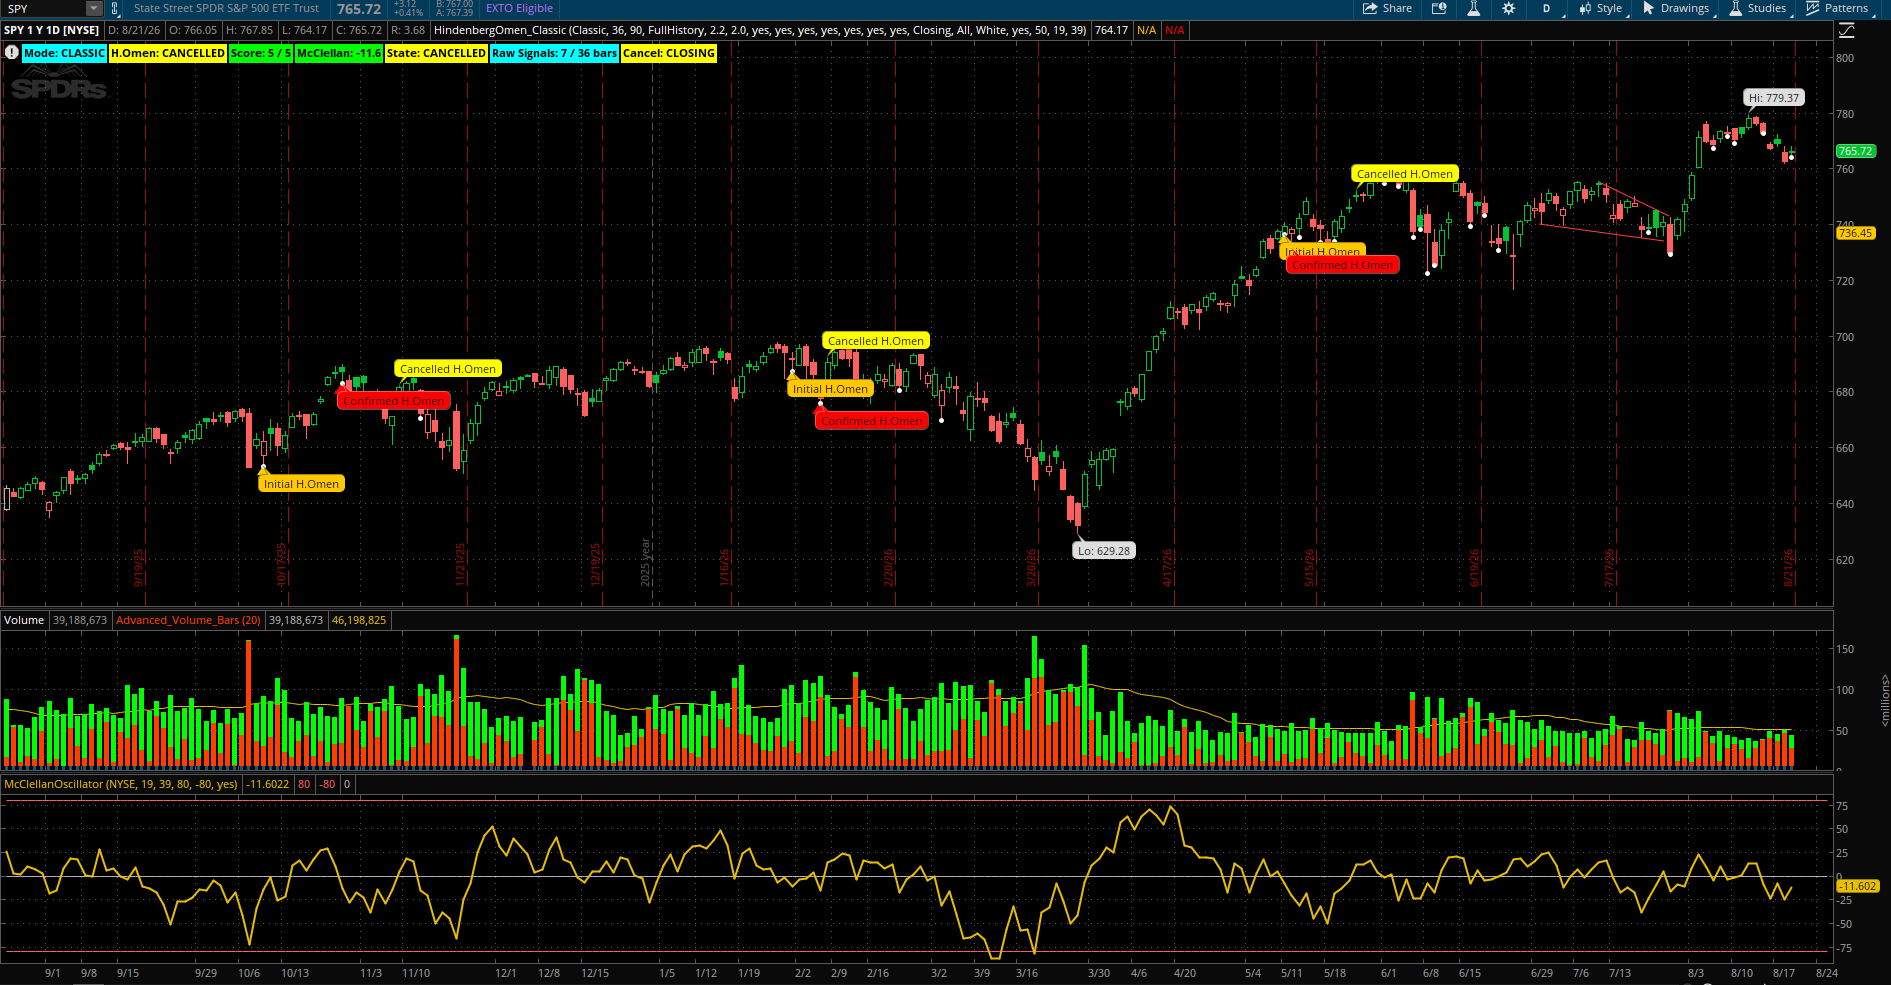
Intelligent Hindenburg Omen
Popeious said:Built a ThinkorSwim study to identify and monitor Classic Hindenburg Omen conditions, while making the signal logic transparent, configurable, and historically testable. (and to also refute the Twitter DoomSayers using this signal as a fear-fud-sell-crash indicator).
Read more:
https://usethinkscript.com/threads/intelligent-hindenburg-omen-for-thinkorswim.22649/
MAD Volatility Trail [BackQuant]
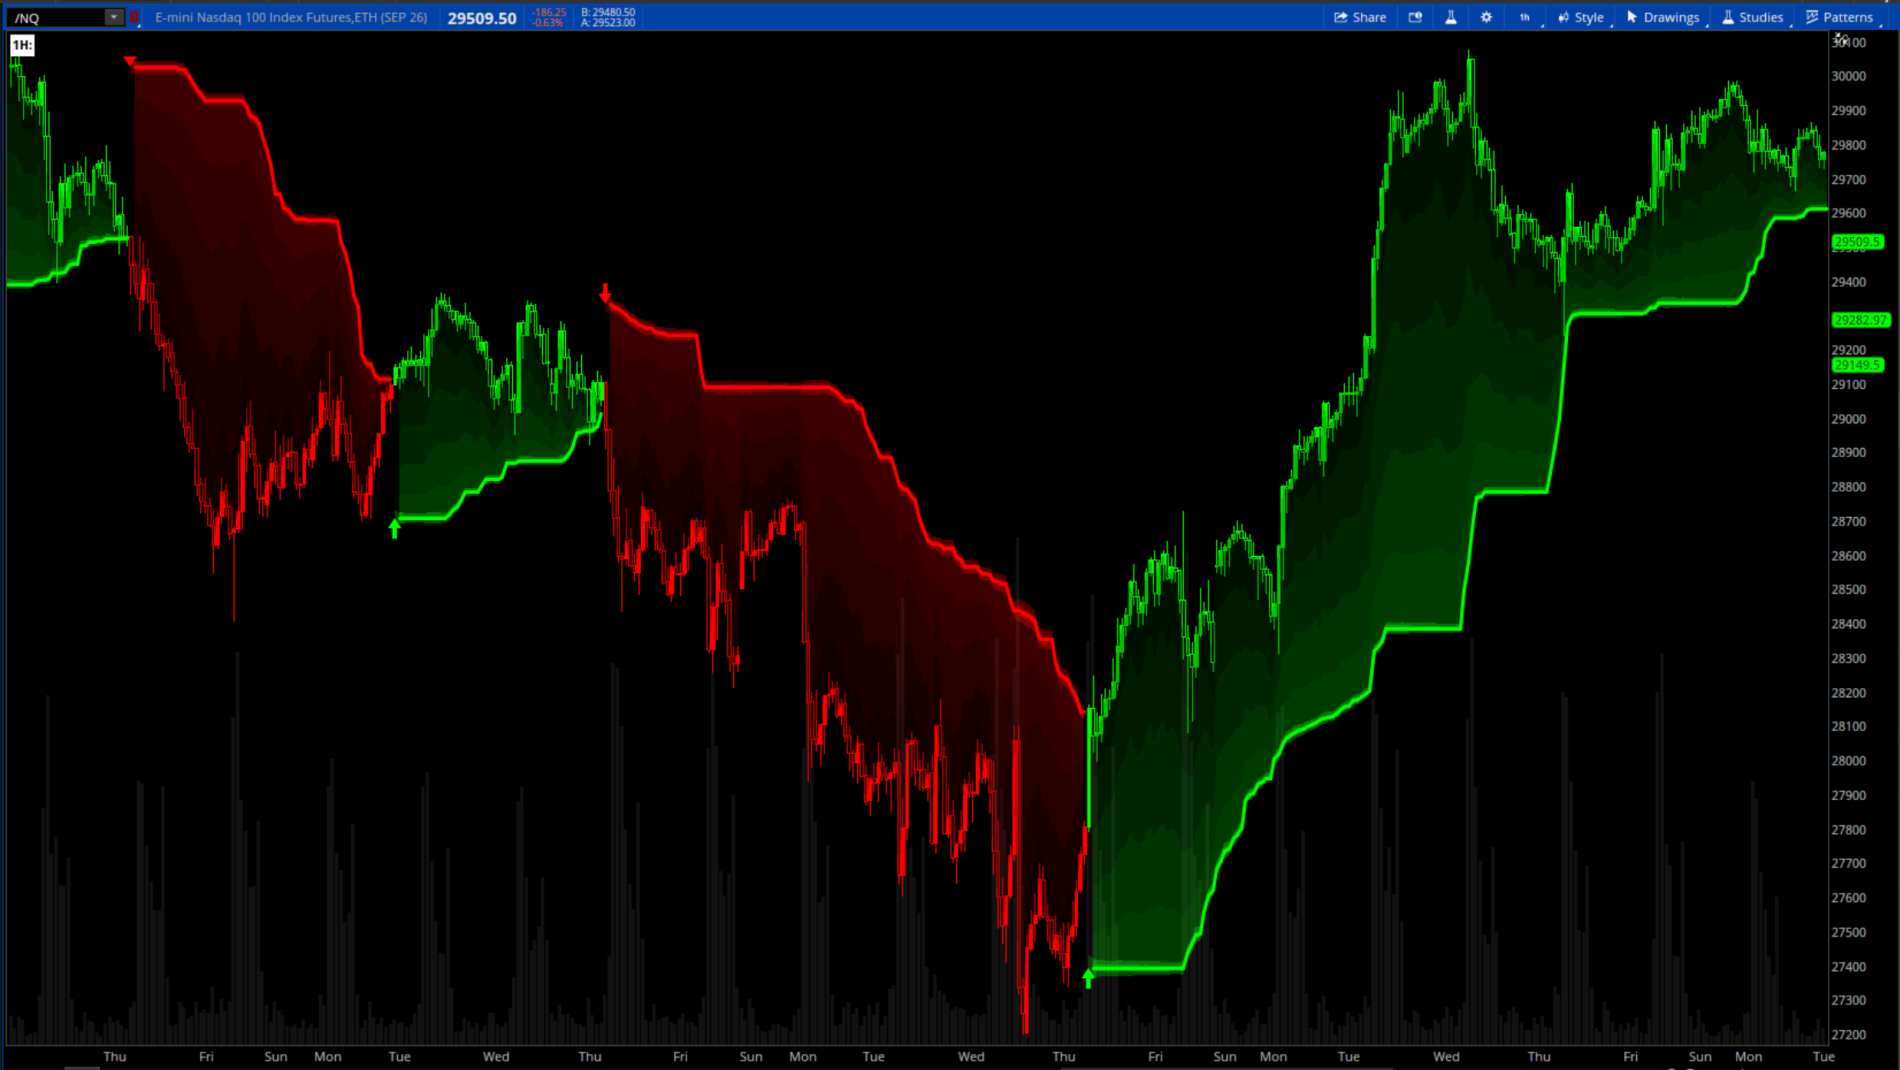
chewie76 said:MAD Volatility Trail is a robust trend-following overlay built from a rolling median and Median Absolute Deviation rather than a conventional moving average and standard deviation.
The indicator estimates a central price using the rolling median, measures how widely recent prices are distributed around that median using MAD, converts that dispersion into adaptive upper and lower bands, and then transforms those bands into one-sided trailing boundaries.
Read more:
https://usethinkscript.com/threads/mad-volatility-trail-backquant-for-thinkorswim.22663/
VIP SUBSCRIBERS ONLY |
SG² Equilibrium Support & Resistance Ladder
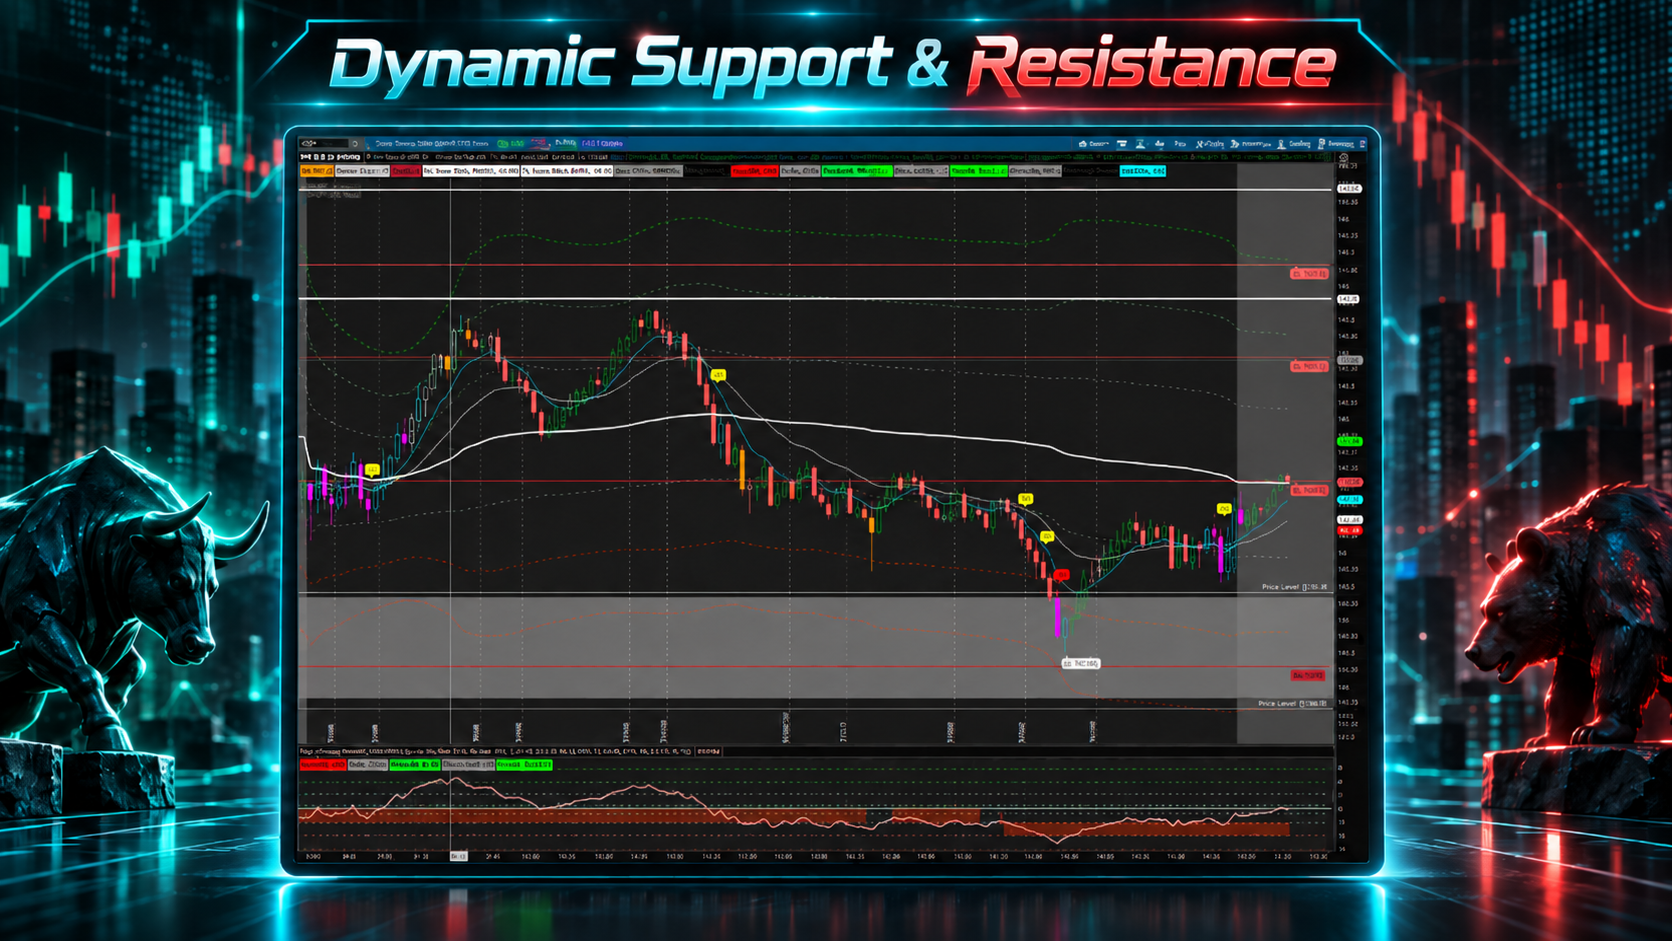
Ajordan930 said:After messing with some other volume related tools with focus on VSCORE as well as some other tools I have been playing around with this set up on both 3 and 5 minute charts. The first indicator doesn’t rely on volume but generates potential support and resistance levels or potential pivot levels.
Dynamic Support & Resistance — Quick Overview
This indicator automatically builds a daily support/resistance ladder around a central Equilibrium (EQ) price. It is designed to work during premarket, regular hours, postmarket, and into the chart expansion area.
It creates 11 key levels:
R1–R5 = Resistance — R1 is nearest; R5 is extreme resistance.
EQ = Equilibrium/Pivot — the day's central decision point.
S1–S5 = Support — S1 is nearest; S5 is extreme support.
Read more
https://usethinkscript.com/threads/sg²-equilibrium-support-resistance-ladder.22674/
Unlock ThreadJoin our VIP Members Club to get access to our premium indicators including Buy The Dip, Advanced Market Moves and Take Profit.
Your VIP membership includes:
✓Full access to public & private forums
✓No Ads
✓Priority community support
✓Unlimited Postings
✓Premium thinkorswim indicators
✓Exclusive strategies, scanners, add-ons
✓Discord chatroom with Trade Alerts
VIP Membership
AGAIG SPY Overnight Trading Indicator
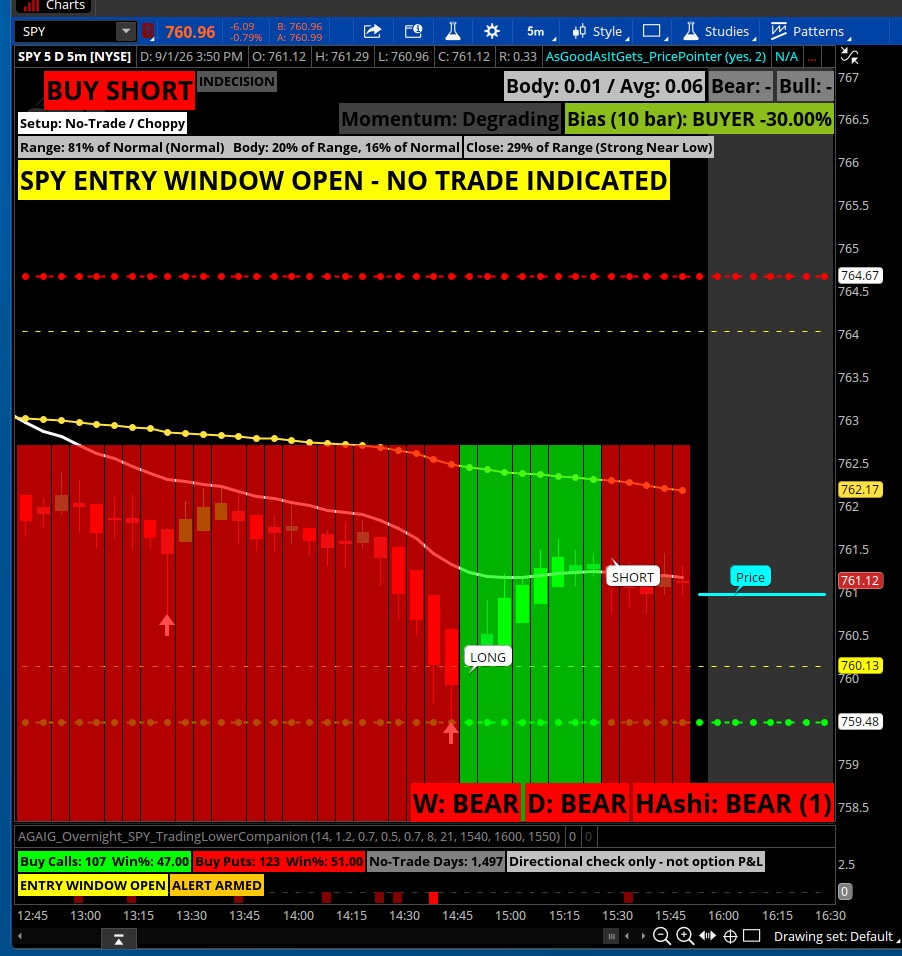
csricksdds shared:This is a new indicator whose purpose is to place trades on the SPY two days out (2 DTE) near the end of current trading day. The object of the trade is to close it the next day for a profit and not let it run the last day.
As the indicator is currently set the “SPY ENTRY WINDOW OPEN” shows on the chart at 3:40 p.m. when one of three choices will show at 3:50 p.m.: “BUY CALL INDICATED”, “BUY PUT INDICATED”, or “NO TRADE INDICATED.” We are placing trades (if any) close to the end of the trading day. Window entry time closes at 4:15 p.m. (all of the times can be personally set in the “Added studies and strategies” dropdown by clicking on the wheel at end of indicator.
Read more:
https://usethinkscript.com/threads/agaig-spy-overnight-trading-indicator-for-thinkorswim.22678/
FROM THE ARCHIVES |
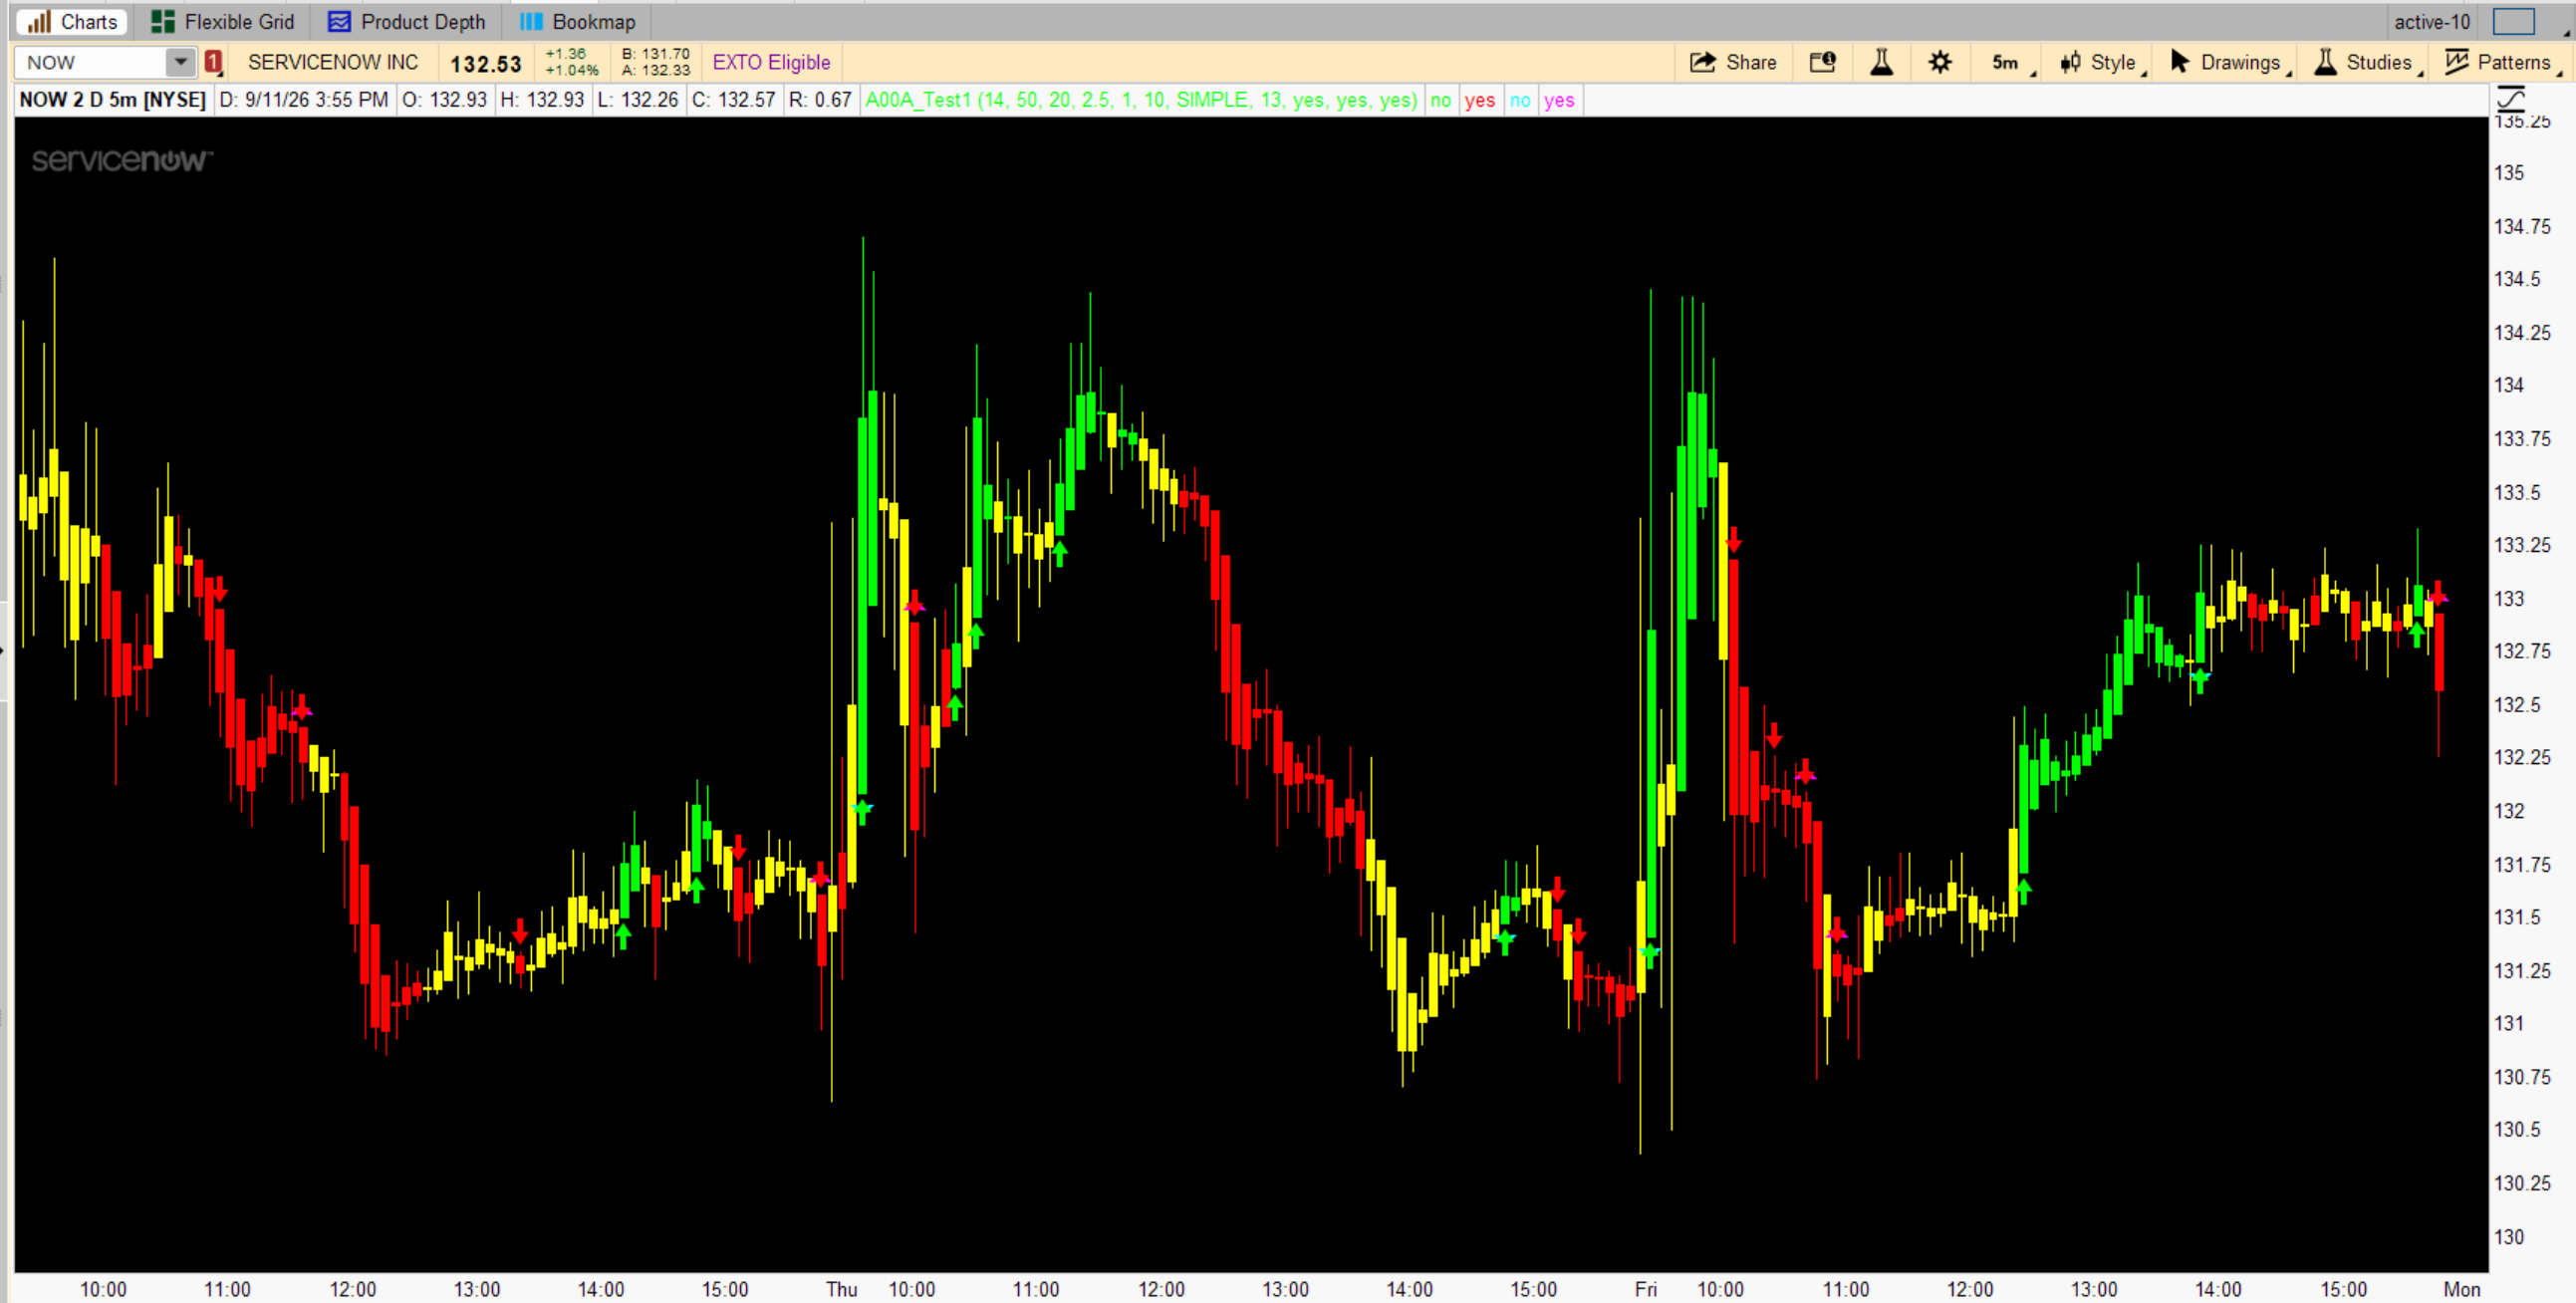
VolumeFlow/DirectionFE Signal indicator for the price window
Pelonsax shared:Hi guys. For my first contribution, I want to share this arrow study that I wrote based on VFI (which I recoded in order to add a signal line). I started using OBVModified and I liked it but I like VFI better for spike dampening, so I switched. The next component takes the direction of the instrument into account using 13EMA. Then I added a Fractal Energy confirmation signal.
The basic red an green arrows are when VFI(1, 10) is over the signal line and the direction is above or below the 13EMA. The FE portion is what I consider to be a confirmation that looks at whether FE(14) is above or below a threshold of 50. I have been playing around with adding an ADX filter for chop but it loses some of the good signals.
Like everything else, this is not meant to be used as a primary trigger to enter or exit, but it can provide a valuable layer of situational awareness. It gets very good signals on the 1 minute chart when there is a clear trend forming or present, particularly the FE confirmation signals.
Read more
https://usethinkscript.com/threads/...e-signal-indicator-for-the-price-window.3142/
Last edited by a moderator:

