



Scroll down to check out this week's must reads, carefully selected by uTS Moderators!

Gaussian Maximum‑Entropy Preserver
Adeodatus said:The script takes raw price movement, removes trend and scale, converts it into a standardized Gaussian signal, and then smooths it without destroying its statistical shape.
What traders get is a clean, stable z‑score oscillator that behaves consistently across symbols, volatility regimes, and timeframes.
Read more
https://usethinkscript.com/threads/gaussian-maximum‑entropy-preserver-for-thinkorswim.22177/

Premarket ORB with Targets
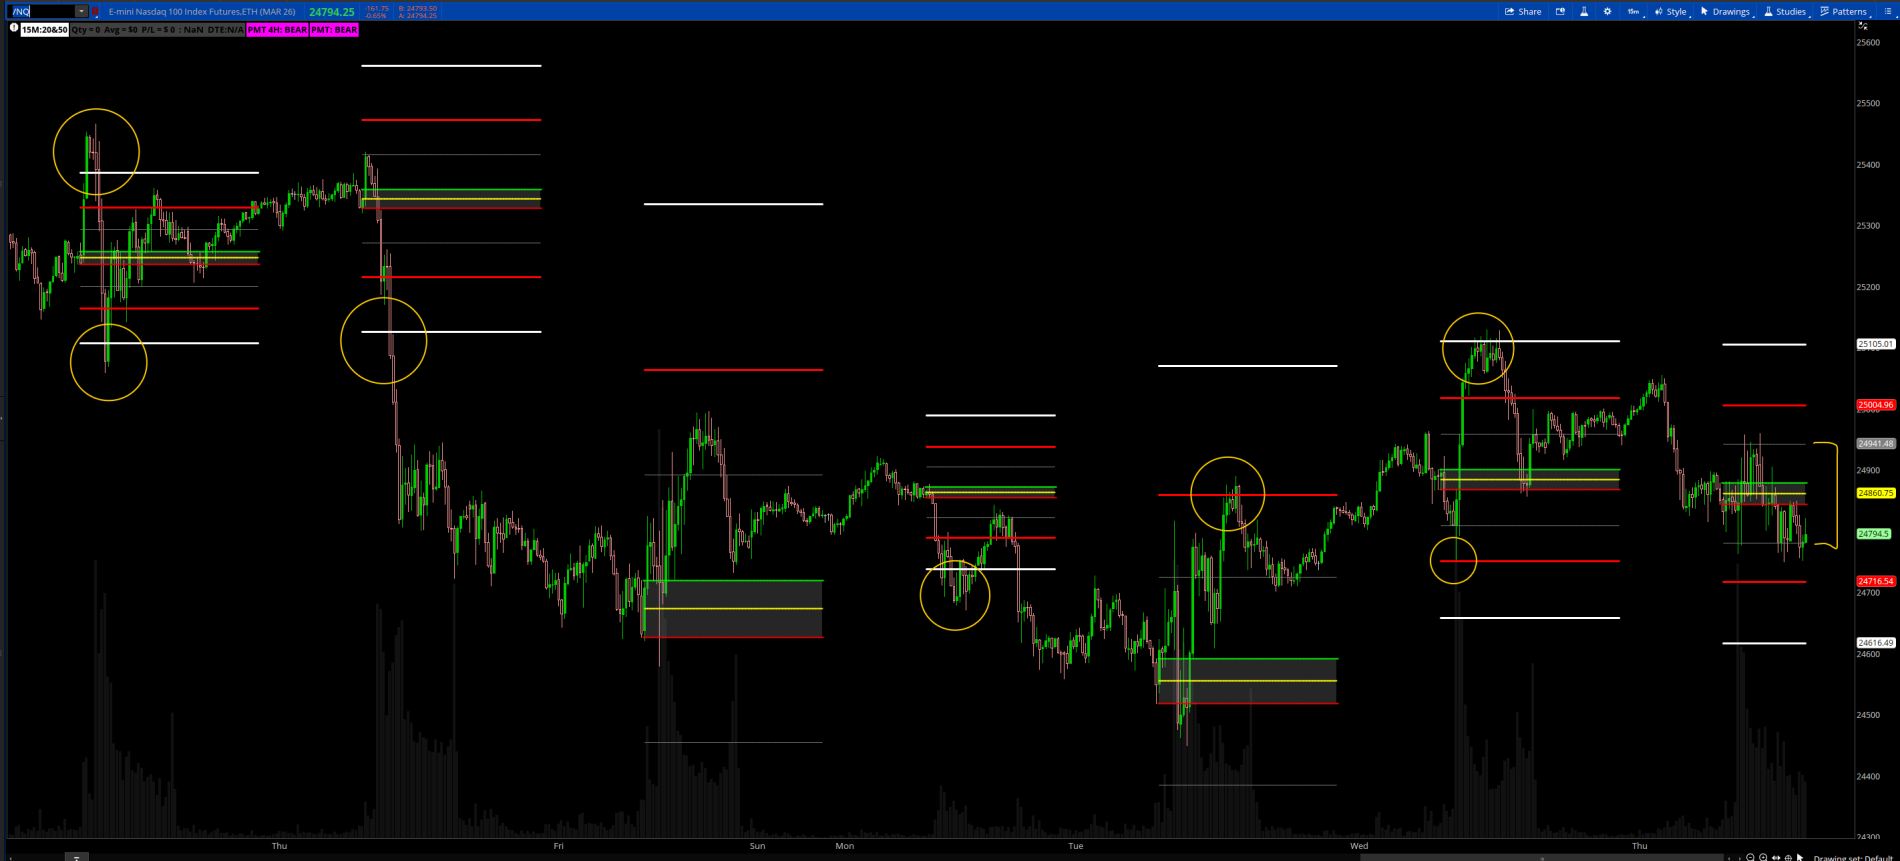
chewie76 asked:Before the market opens, this indicator generates daily targets for the upside and downside. It calculates the "In the Zone" shaded area between 8-8:15am EST. Price will typically move away from this zone and hit at least one of the target levels every day. Sometimes price will breach far beyond the third target as shown in the second day of the below picture.
Read more
https://usethinkscript.com/threads/premarket-orb-with-targets-for-thinkorswim.22162/
VIP SUBSCRIBERS ONLY |
Ehlers CyclePeriod Volume Heatmap
rewardiaz said:Yep, me again with CyclePeriod, but what can I say? I like Ehlers’ vision of the market. So here’s my attempt to create a zone heatmap by calculating a slow and fast MA based on the High Period and Low Period.
Based on Ehlers’ idea that strength can be measured by the separation of two MAs, I figured: why not test volume the same way
Here goes: This study is a cycle-adaptive participation regime indicator. It compresses raw volume into higher-timeframe “period groups” (24H / Week / Month / custom), then measures whether participation is expanding or contracting by comparing a fast vs slow average of completed period volume, where the fast/slow lengths are adapted to the market’s Dominant Cycle Period (DCP).
Read more
https://usethinkscript.com/threads/ehlers-cycleperiod-volume-heatmap.22070/

Join our VIP Members Club to get access to our premium indicators including Buy The Dip, Advanced Market Moves and Take Profit.
Your VIP membership includes:
✓Full access to public & private forums
✓No Ads
✓Priority community support
✓Unlimited Postings
✓Premium thinkorswim indicators
✓Exclusive strategies, scanners, add-ons
✓Discord chatroom with Trade Alerts
VIP Membership
MTF Floor Trader Pivots
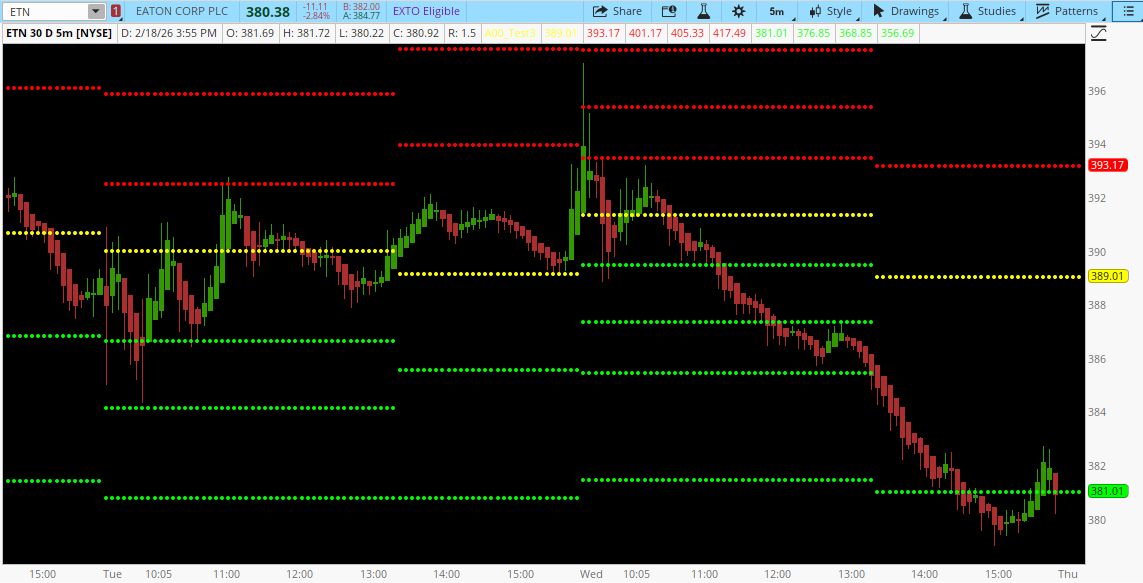
cando13579 shared:Calculates classic floor‑trader pivot levels using 4‑hour candles, then projects those levels onto any intraday chart.
A day trader wants 4‑hour levels because they give a clean, higher‑timeframe map that doesn’t flicker or recalc intraday, letting you instantly see where price is likely to react, stall, or break with conviction. They act as stable decision zones—helping you avoid bad entries directly into support or resistance, time exits more cleanly, and judge strength or weakness without adding noise or clutter to the chart.
Read more
https://usethinkscript.com/threads/mtf-floor-trader-pivots-for-thinkorswim.22157/
FROM THE ARCHIVES |
Implied Volatility (IV) Rank & Percentile
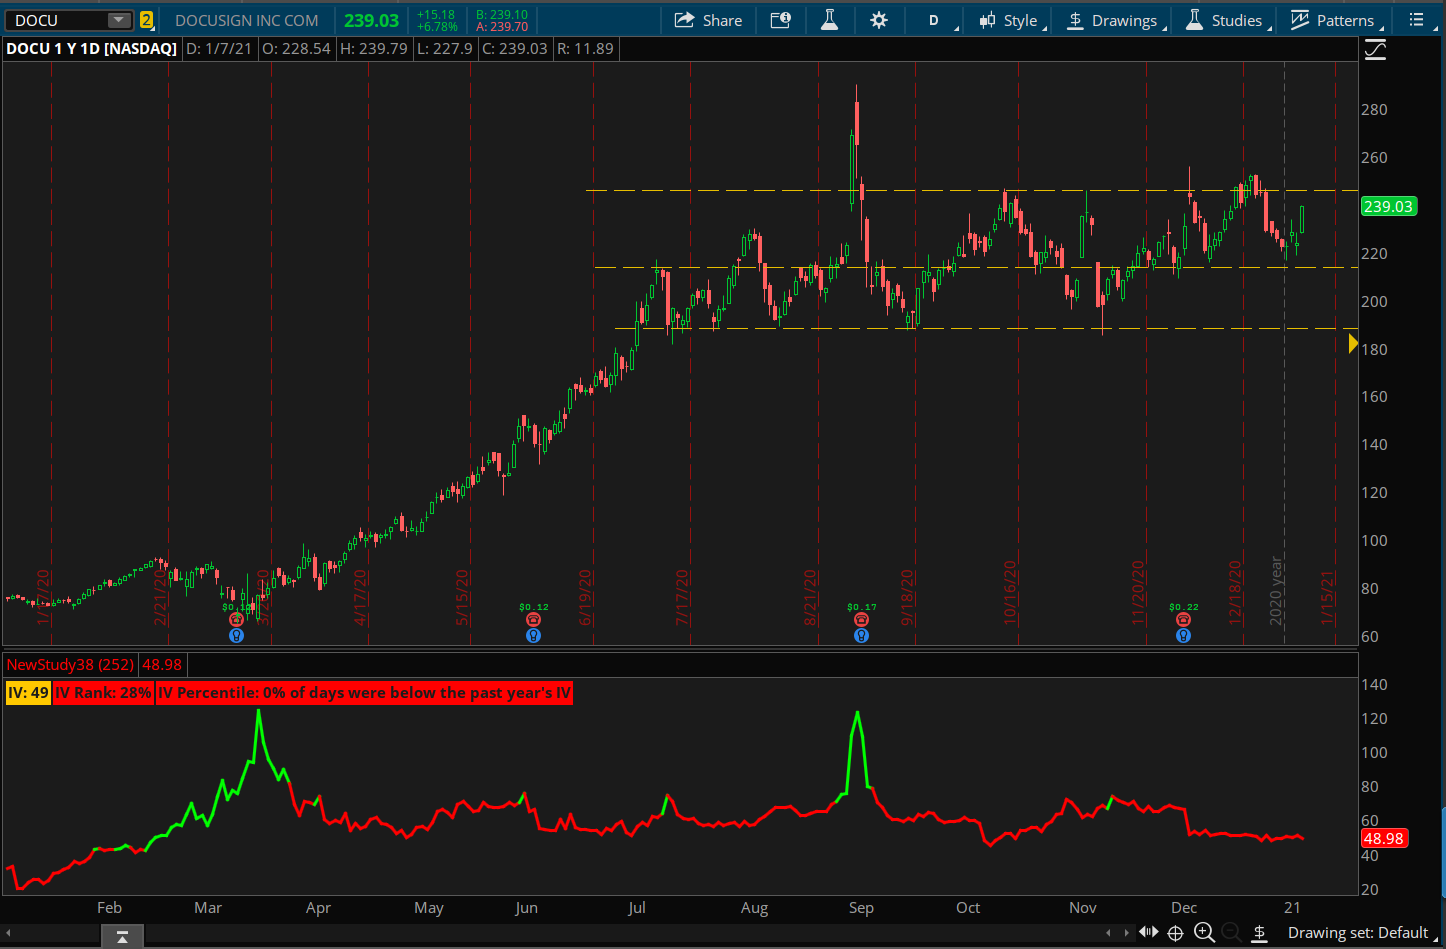
cos251 shared:IV Rank and IV Percentile are widely used in options trading to evaluate whether implied volatility is relatively high or low compared to its own historical context. This helps traders assess premium richness, mean‑reversion potential, and whether conditions favor selling or buying volatility.
This script is designed for DAILY charts only.
A warning label appears if used on intraday timeframes.
The IV line is colored green when IV Rank > 50%, otherwise red.
Some futures symbols use ETF‑based IV proxies (labeled accordingly).
Read more
https://usethinkscript.com/threads/implied-volatility-iv-rank-percentile-for-thinkorswim.674/
https://usethinkscript.com/threads/gaussian-maximum‑entropy-preserver-for-thinkorswim.22177/
Last edited:

