



Scroll down to check out this week's must reads, carefully selected by uTS Moderators!

Overwatch – Take Profit Zones and Trend Reversals
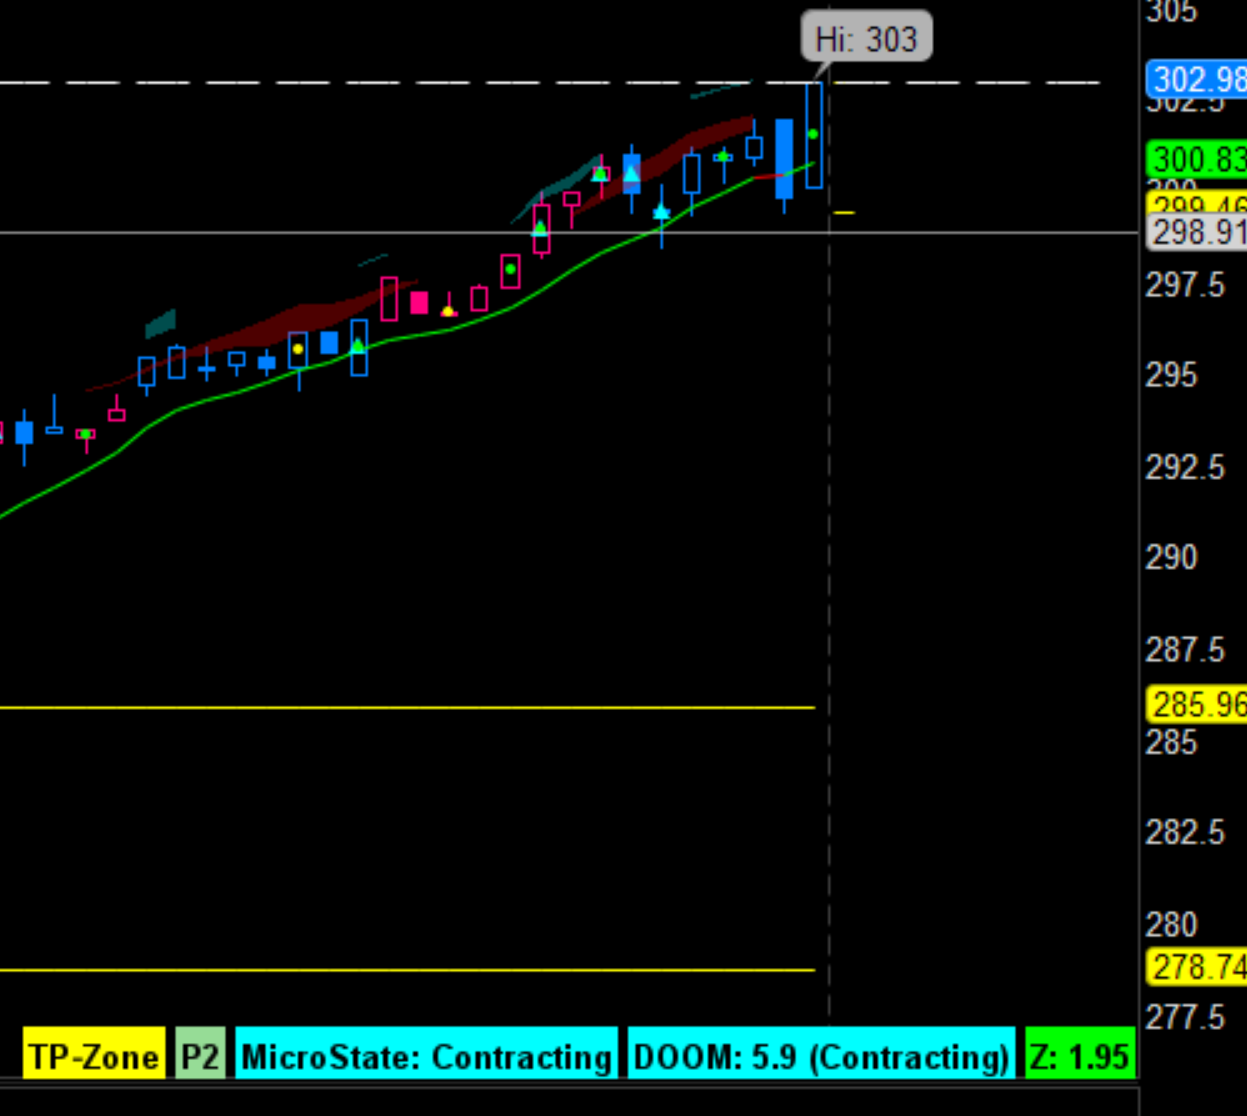
atcsam said:Overwatch acts as a magnifying lens when the tape stretches, revealing how structure and volatility behave as the environment bends, compresses, expands, or destabilizes. It overcomes the limitations of relying on Z‑score alone when price pushes beyond 1.5, 2, or more—showing not just how far price has stretched, but whether that stretch is healthy, pressured, unstable, or aging.
Overwatch is a compact, operator‑grade panel that quietly monitors the market’s internal state in real time. It doesn’t predict, it doesn’t hype—it simply watches and reports the truth of the tape through four core instruments.
Read more
https://usethinkscript.com/threads/z-score-probability-indicator-for-thinkorswim.15768/
Near Zero Lag ADX/DMI
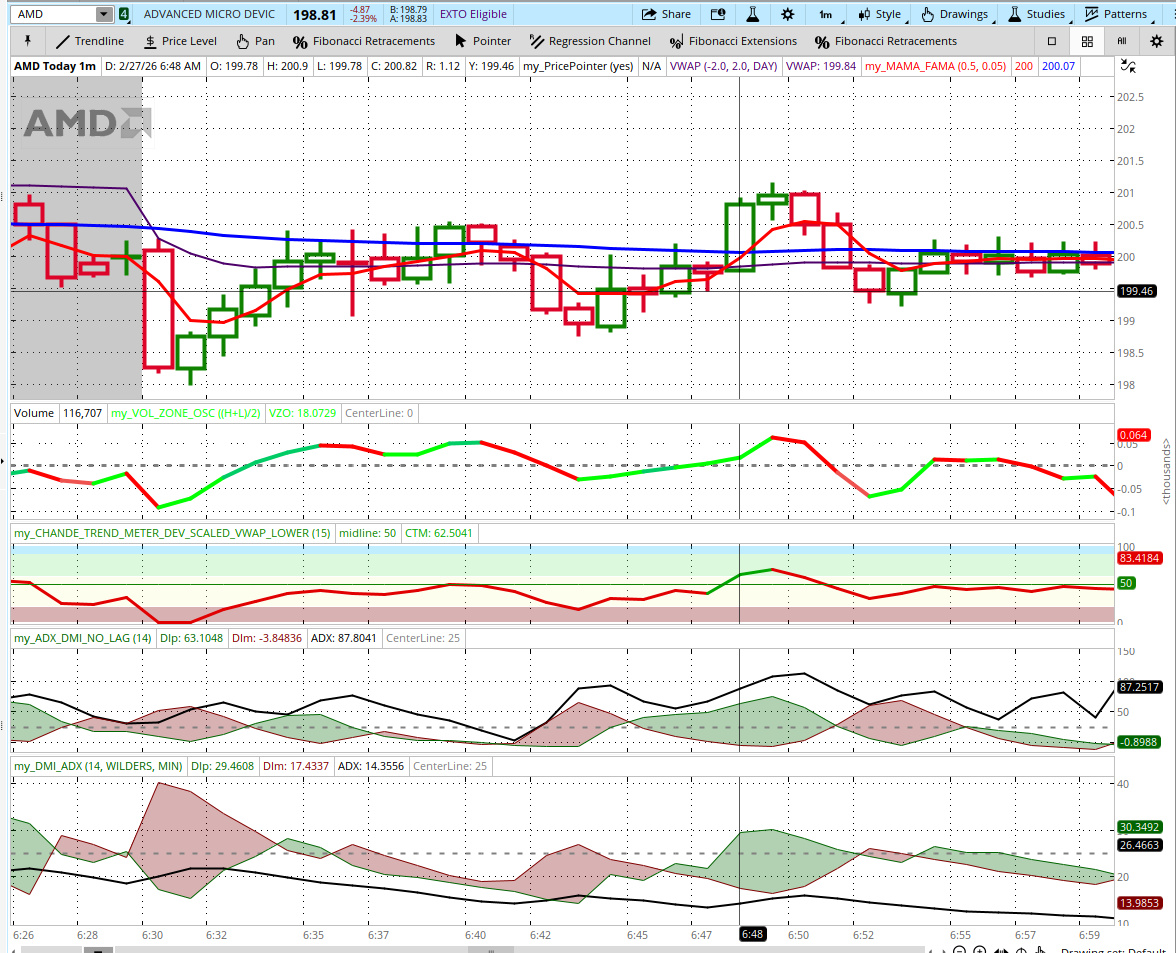
Sesqui asked:To reduce lag in the ADX/DMI indicators I replaced the moving averages, which are a significant source of lag, with the UltimateSmootherFilter.
The screenshot below compares the standard ADX/DMI indicators to this reduced lag ADX/DMI indicator.
On both lower indicators, the dashed gray line is the ADX = 25 line.
The image shows that the reduced lag ADX/DMI captures ADX values that are above 25 (trending) at times when the lagging ADX indicator reports the ADX to be < 25 (not trending). Perhaps this approach to ADX/DMI will help you.
Read more
https://usethinkscript.com/threads/near-zero-lag-adx-dmi-for-thinkorswim.22195/
VIP SUBSCRIBERS ONLY |
XStream Regime Bands
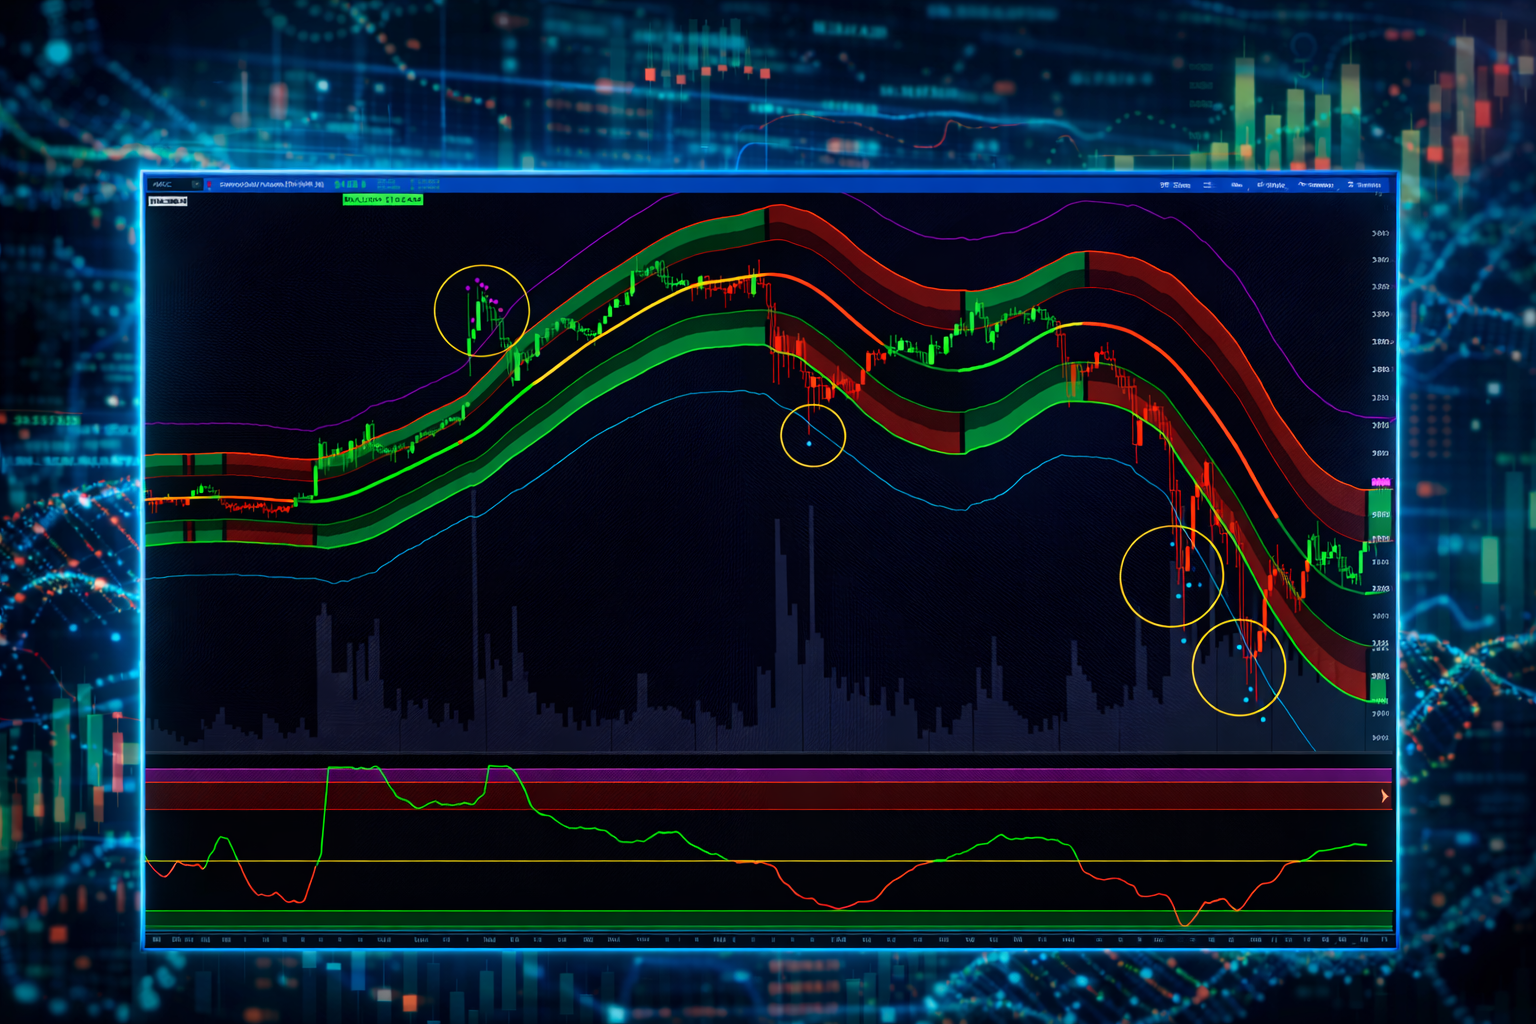
rewardiaz said:Upper chart XStream Regime Bands and Lower chart XStream Regime Oscillator.
Upper Chart indicates Market Structure + Stream Strength (trend) +Extension Zones
Lower Chart indicates Pressure + State
The XStream Regime Bands indicator is a regime-aware, multi-layer ATR volatility framework built around a smoothed regression midline with hierarchical expansion bands and extreme exhaustion detection.
It combines:
Smoothed Linear Regression structure
Multi-tier ATR volatility envelopes (2x, 3x, 4x)
Slope-based regime filtering. Middle line changes color based on the strength of the Stream (trend).
6.8 ATR anomaly detection (X-band): Points indicate unsustainable strength. Price will come back inside the bands.
Visual cloud-based trend structure
It tells you:
What phase the market is in
How stretched it is
When extension becomes statistically abnormal
Best Way to Think About It
2 ATR = healthy
3 ATR = strong
4 ATR = emotional
6.8 ATR = unsustainable
Read more
https://usethinkscript.com/threads/xstream-regime-bands-for-thinkorswim.22196/
Join our VIP Members Club to get access to our premium indicators including Buy The Dip, Advanced Market Moves and Take Profit.
Your VIP membership includes:
✓Full access to public & private forums
✓No Ads
✓Priority community support
✓Unlimited Postings
✓Premium thinkorswim indicators
✓Exclusive strategies, scanners, add-ons
✓Discord chatroom with Trade Alerts
VIP Membership
Waddah Attar Explosion
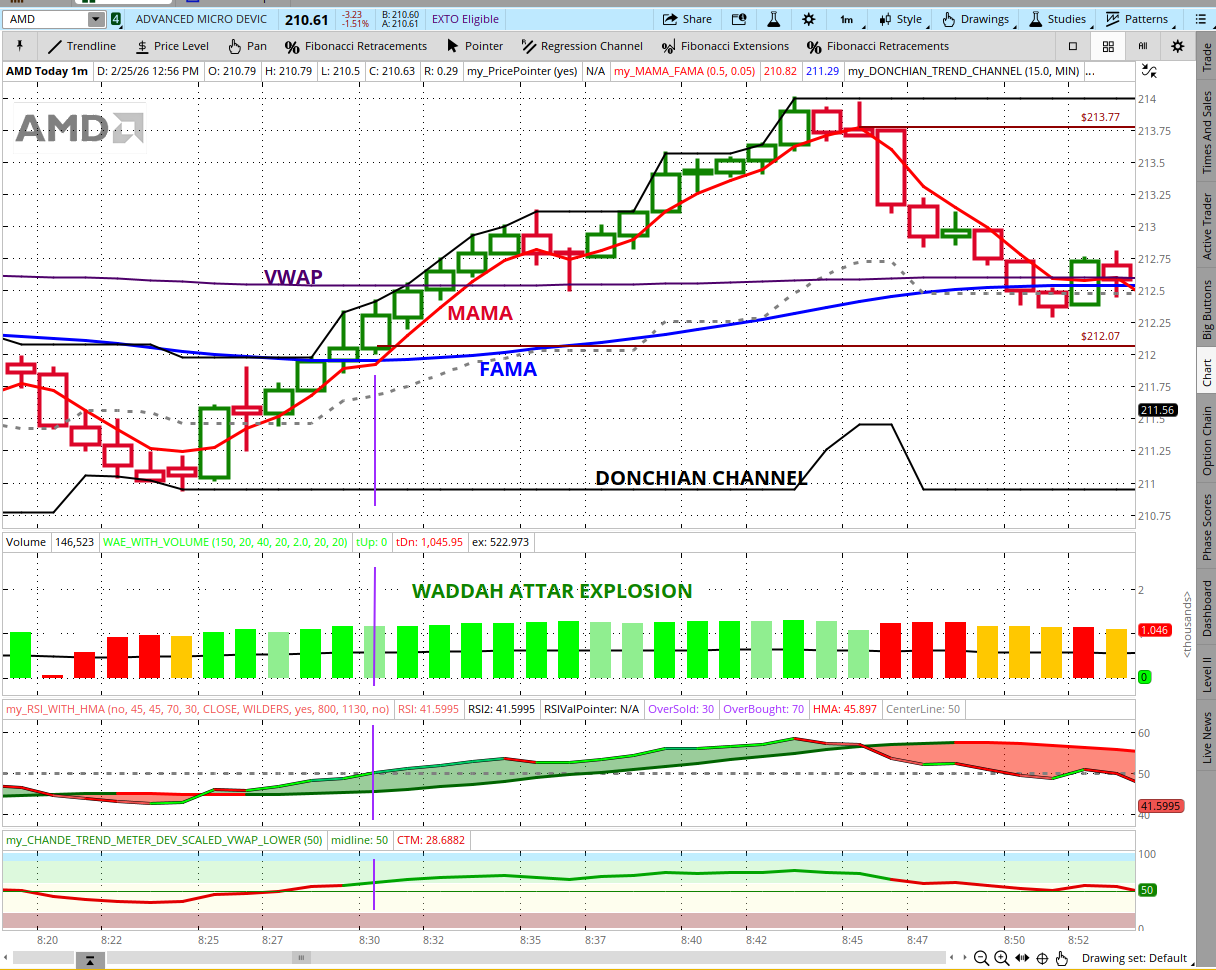
Sesqui shared:I really enjoyed using the Waddah Attar Explosion (WAE) indicator posted on this forum here, WAE for TOS, and since several replies to the post for that indicator asked about a WAE with volume, I made this variant incorporating volume in the analysis.
To incorporate volume it uses the following:
Value = (MACD value - Previous MACD value) * Volume
BollingerBandUpper - BollingerBandLower + Average(Volume,VolAvgLength)/sensitivity;
Read more
https://usethinkscript.com/threads/waddah-attar-explosion-with-volume-for-thinkorswim.22192/
FROM THE ARCHIVES |
Z-Score Probability Indicator
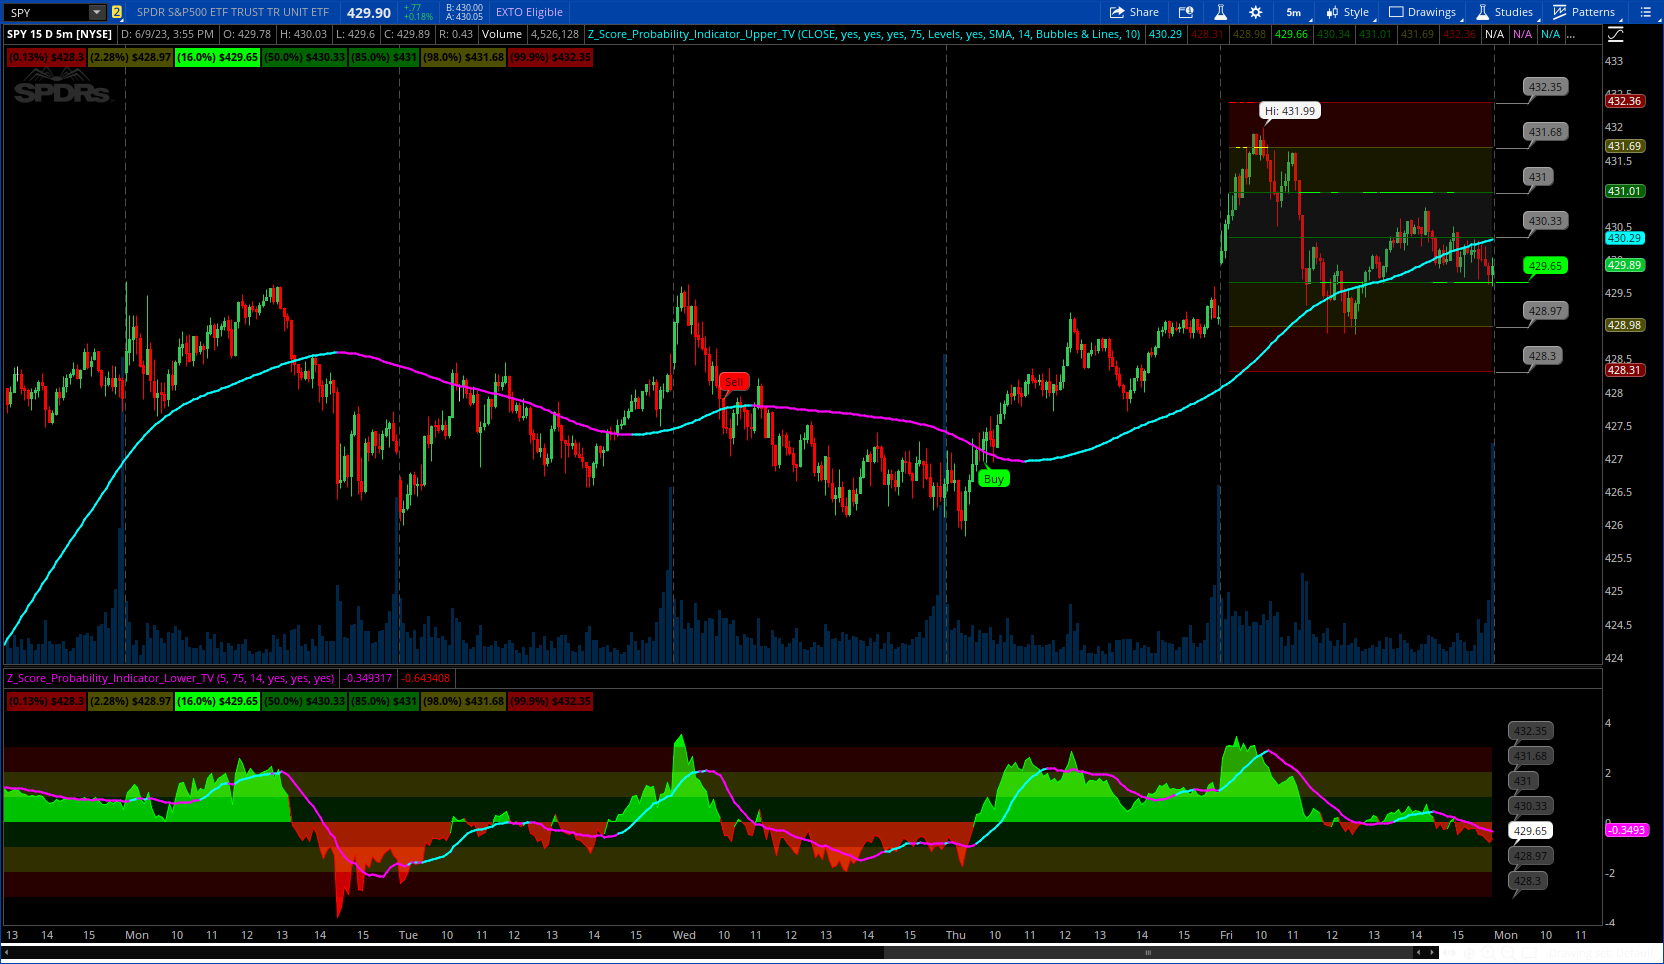
samer800 shared:This is the Z-Score Probability indicator. As many people like my original Z-Score indicator and have expressed more interest in the powers of the Z, I decided to make this indicator which shows additional powers of the Z-Score.
Z-Score is not only useful for measuring a ticker or any other variable’s distance from the mean, it is also useful to calculate general probability in a normal distribution set. Not only can it calculate probability in a dataset, but it can also calculate the variables within said dataset by using the Standard Deviation and the Mean of the dataset.
Using these 2 aspects of the Z-Score, you can, In principle, have an indicator that operates similar to Fibonacci retracement levels with the added bonus of being able to actually ascertain the realistic probability of said retracement.
Read more
https://usethinkscript.com/threads/z-score-probability-indicator-for-thinkorswim.15768/
Last edited:

