



Scroll down to check out this week's must reads, carefully selected by uTS Moderators!

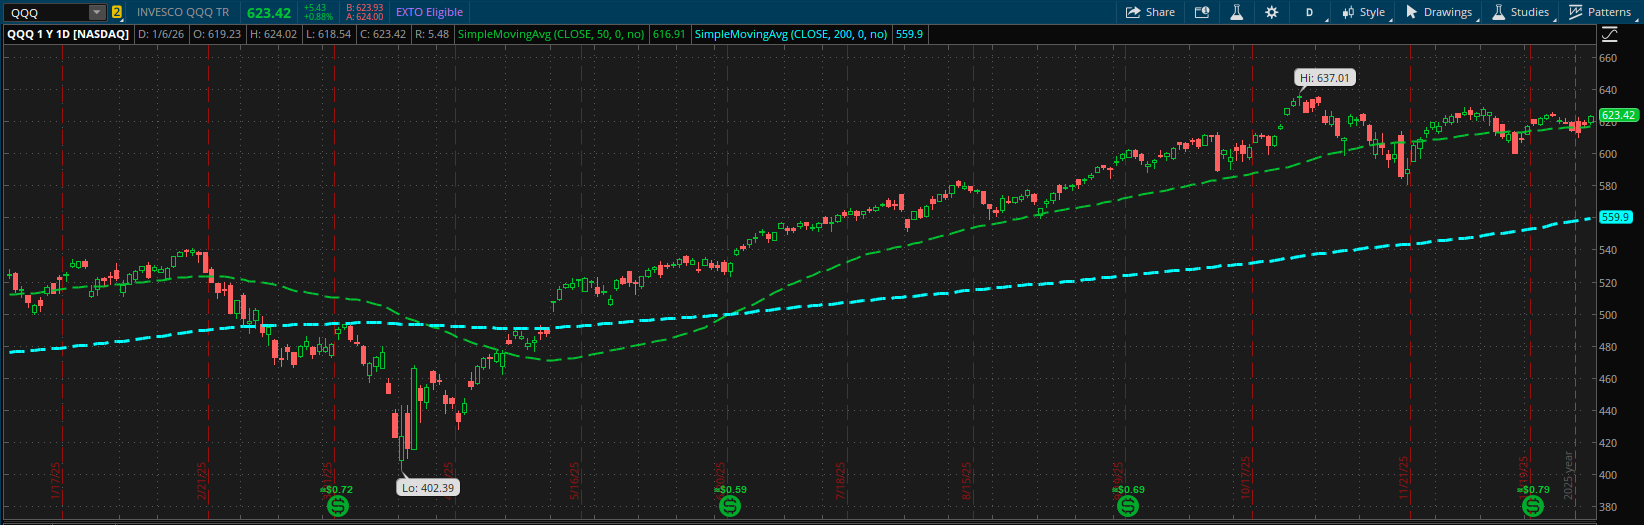
MACD-V Variation and Use Case
justAnotherTrader said:Whats up my fellow Trend Followers!
As someone who trades trends I have to ask myself 3 questions everytime I look at a potential trade.
1) Is There a Trend?
2) How long has it been a Trend?
3) Do I think the Trend will continue?
The downside to being a trend trader is you never show up first, you just hope you dont show up last. That's what this indicator is for. It is super simple, and would be a useful indicator, label, watchlist column and screen.
I am just going to give you the logic, a pretty picture, and some code and if you want to spin it up into something else that awesome sauce =)
https://usethinkscript.com/threads/macd-v-variation-and-use-case-for-thinkorswim.22012/
Triple Sine Oscillator
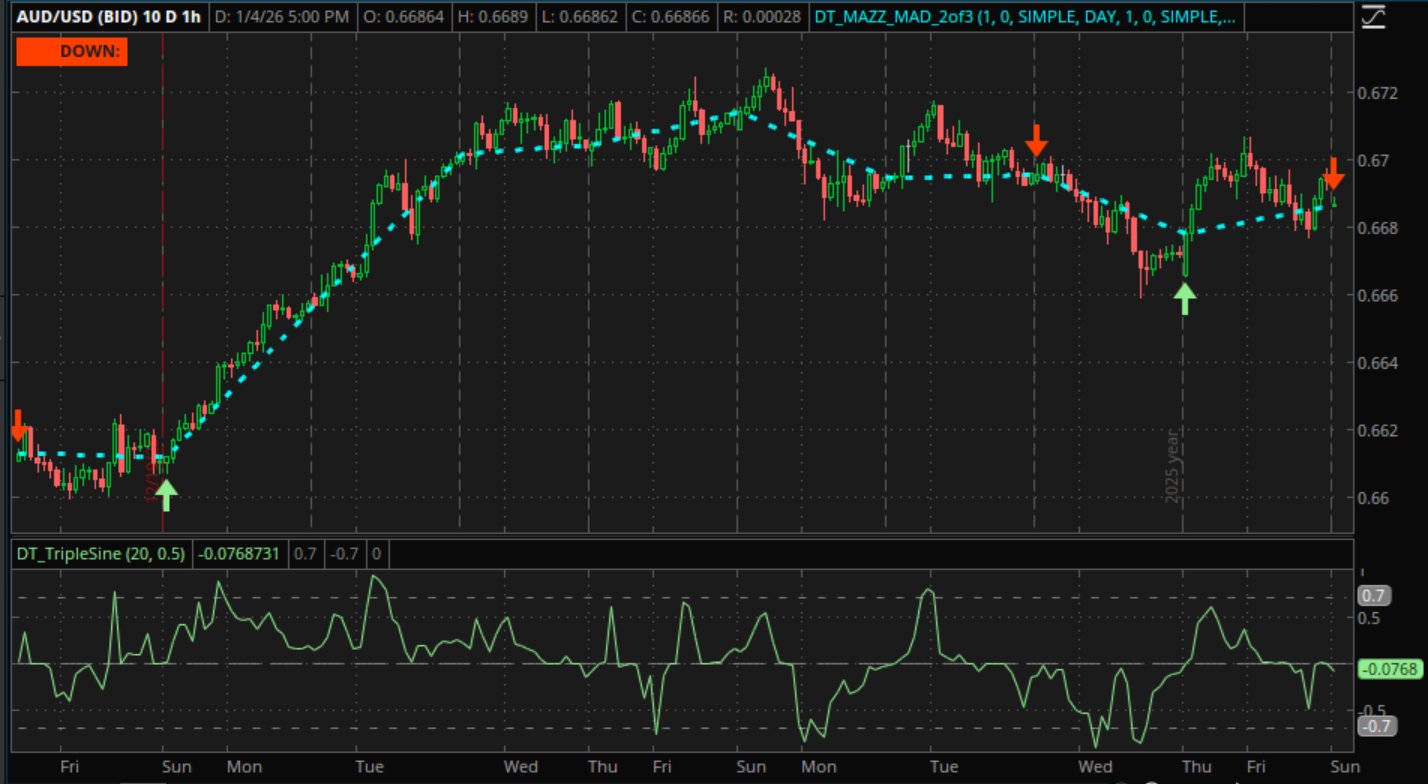
whoDAT asked:The Triple Sine Oscillator is a responsive mean reversion indicator. Due to the math of the sine cubed function, smaller changes around the mean cause larger movement of the indicator; and conversely smaller moves near the peaks. This causes the indicator to quickly and decisively show reversion from the mean.
https://usethinkscript.com/threads/triple-sine-oscillator-for-thinkorswim.22007/
VIP SUBSCRIBERS ONLY |
dATR Directional ATR
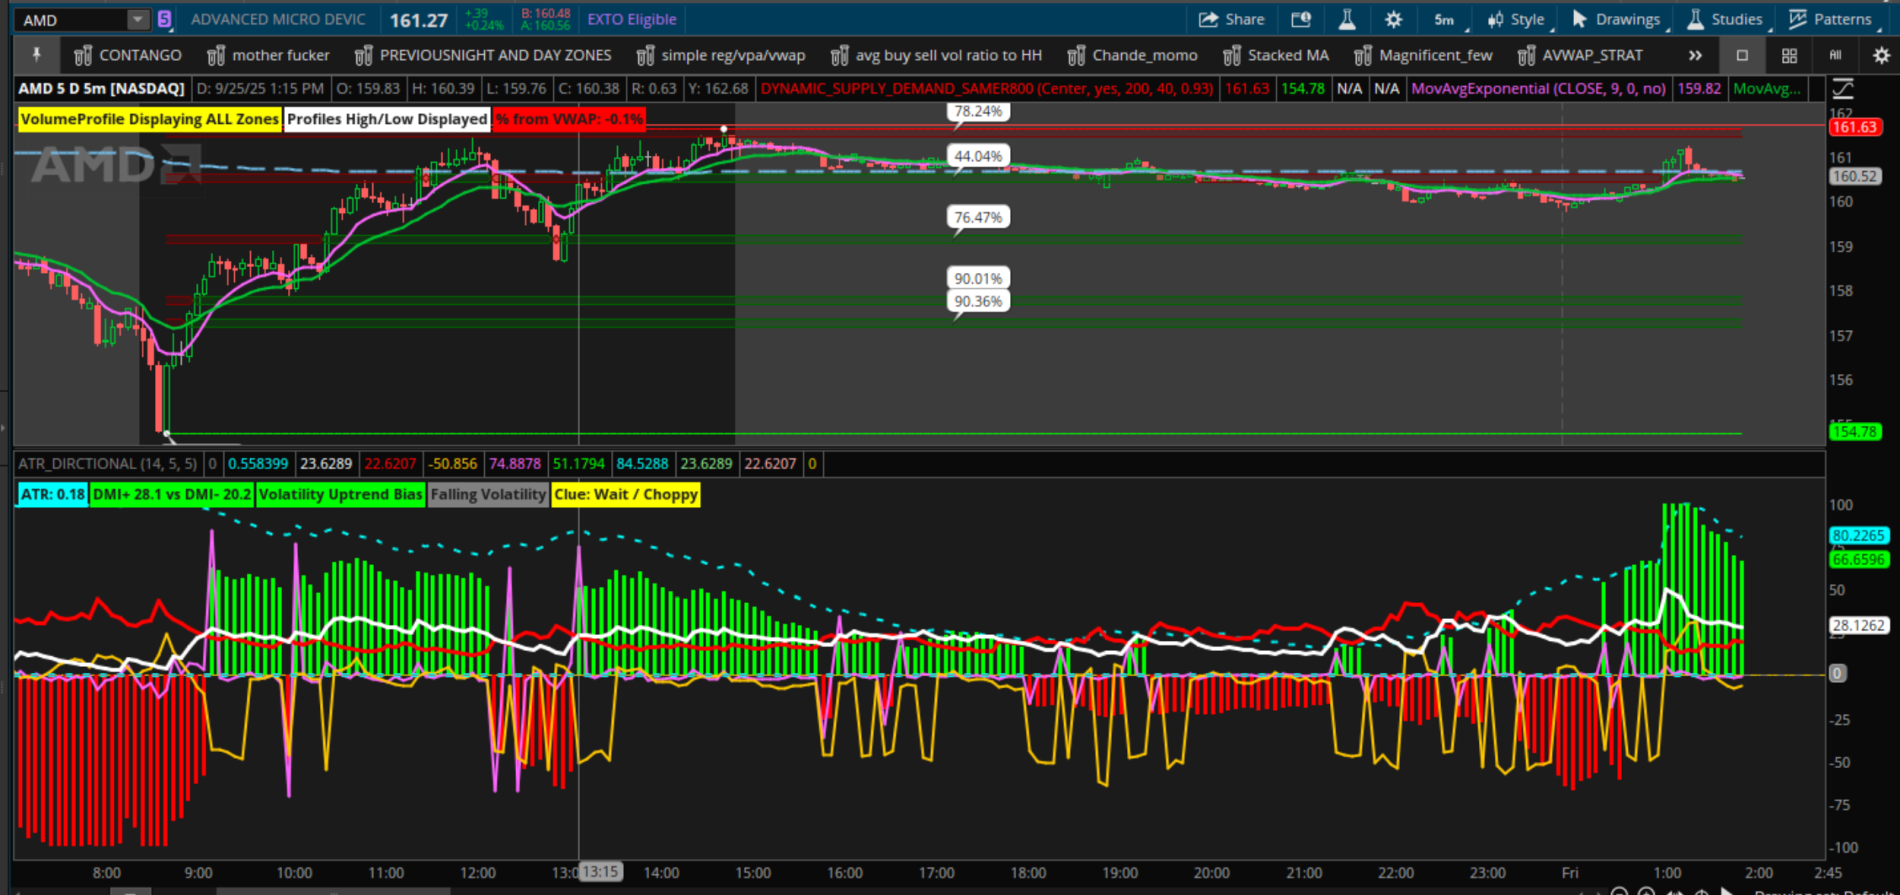
antwerks said:The "Directional ATR with DMI Overlay" script is a lower study indicator designed for ThinkOrSwim (TOS) that combines the Average True Range (ATR) with the Directional Movement Index (DMI) to provide insights into market volatility and directional bias.
Its primary purpose is to help traders identify the strength and direction of price movements, assess volatility trends, and generate actionable clues for trading decisions (e.g., favoring longs, shorts, or waiting).
The script enhances traditional ATR by incorporating DMI’s directional indicators (DI+ and DI-) to create a "Directional ATR" (dATR), which is then visualized with histograms, lines, and labels for easy interpretation. This gives clues to what direction is driving volatility.
Read more
https://usethinkscript.com/threads/datr-directional-atr.21620/
Join our VIP Members Club to get access to our premium indicators including Buy The Dip, Advanced Market Moves and Take Profit.
Your VIP membership includes:
✓Full access to public & private forums
✓No Ads
✓Priority community support
✓Unlimited Postings
✓Premium thinkorswim indicators
✓Exclusive strategies, scanners, add-ons
✓Discord chatroom with Trade Alerts
VIP Membership
Fibonacci MAs – 8-Slot Engine
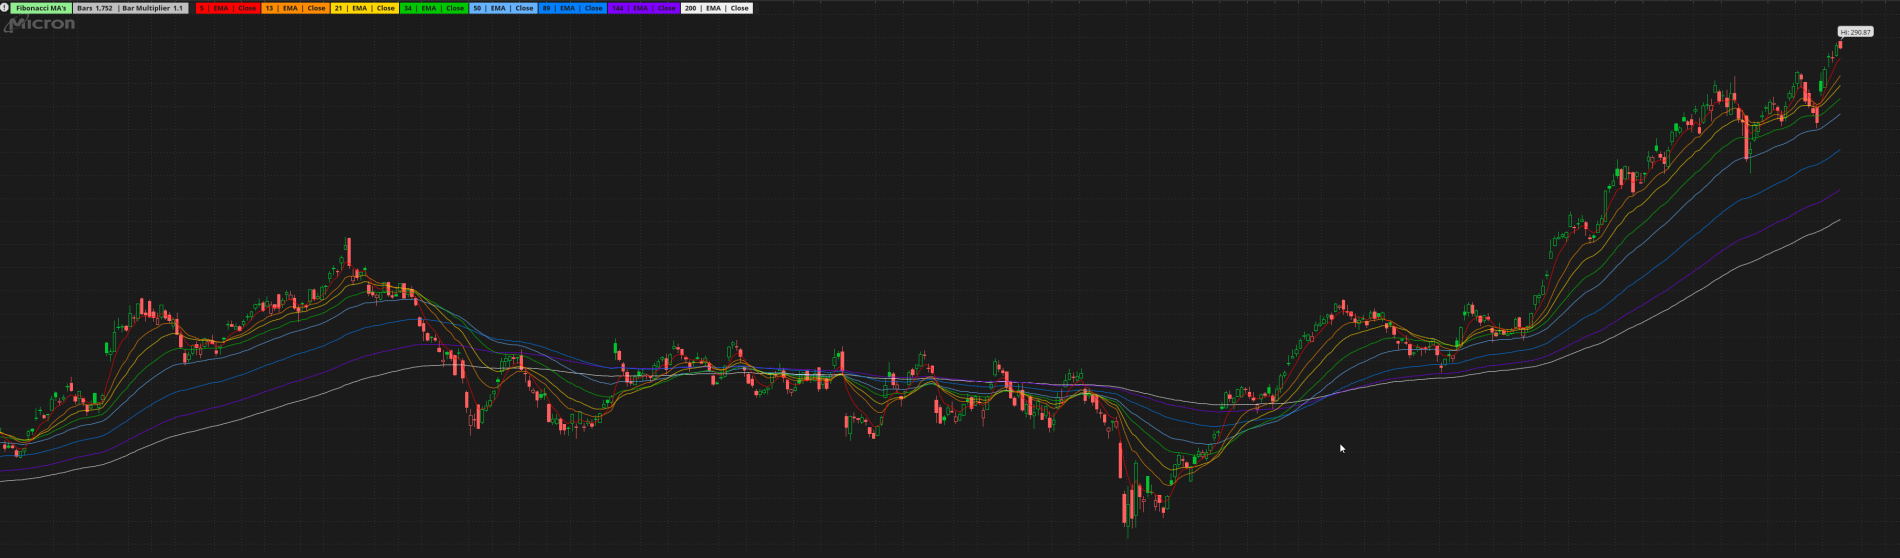
Ricky_005 shared:This is my first time posting a study on the UseThinkScript forum, so I’m coming in straight and simple: this is a Moving Average stack I built for day-to-day chart work and quick visual alignment.
What it is
Fibonacci MAs – 8-Slot Engine (Per-MA AvgType + Per-MA PriceSource)
It plots up to 8 MA “slots” (default Fib lengths like 3/5/8/13/21/55/144/377), but you can change anything. Each slot has:
On/Off toggle
Length
Average type (AvgType per slot)
Price source per slot (Close/Open/High/Low/HL2/HLC3/OHLC4)
Why I made it
I wanted a clean way to run multiple MA lengths without constantly rewriting studies or juggling separate indicators. This keeps everything in one place, gives you consistent color mapping by slot, and prints useful labels so you always know exactly what’s on your chart.
https://usethinkscript.com/threads/datr-directional-atr.21620/
FROM THE ARCHIVES |
Climatic Volume Indicator
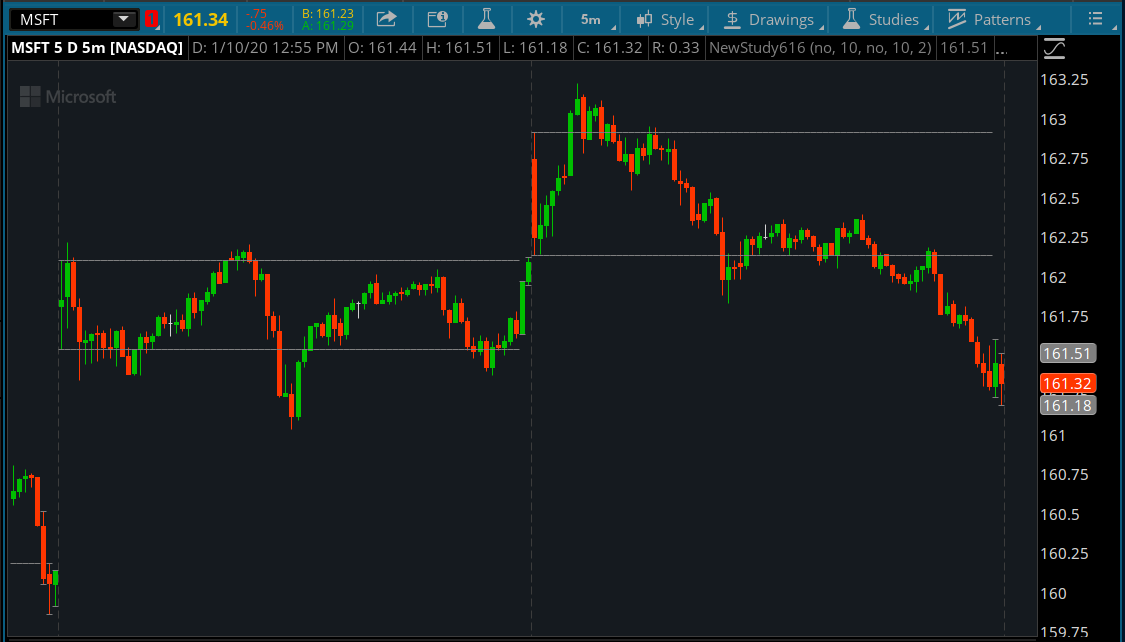
BenTen shared:Found this one to be quite interesting, so I converted it over to ThinkorSwim. I also added paintbars (turned off by default) to highlight climatic volume bars.
This script is essentially a “volume shock detector” that marks the high and low of any bar where volume is 2× above average (or whatever threshold you set). After that, it draws a horizontal zone for up to cloud_length bars (default 10).
So what you get is:
A Climactic Volume Bar (CVB)
A zone defined by that bar’s high/low
A 10‑bar window where price interacts with that zone
Read more
https://usethinkscript.com/threads/climatic-volume-indicator-for-thinkorswim.1464/
Last edited by a moderator:

