



Scroll down to check out this week's must reads, carefully selected by uTS Moderators!

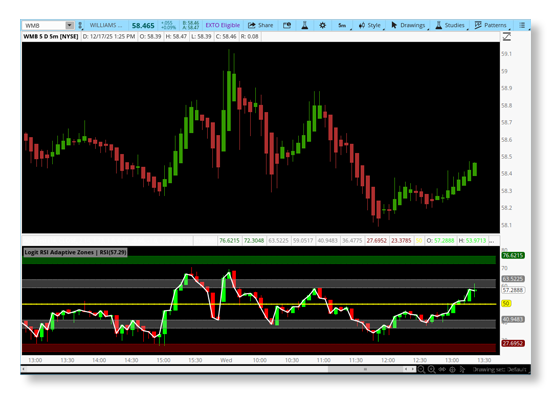
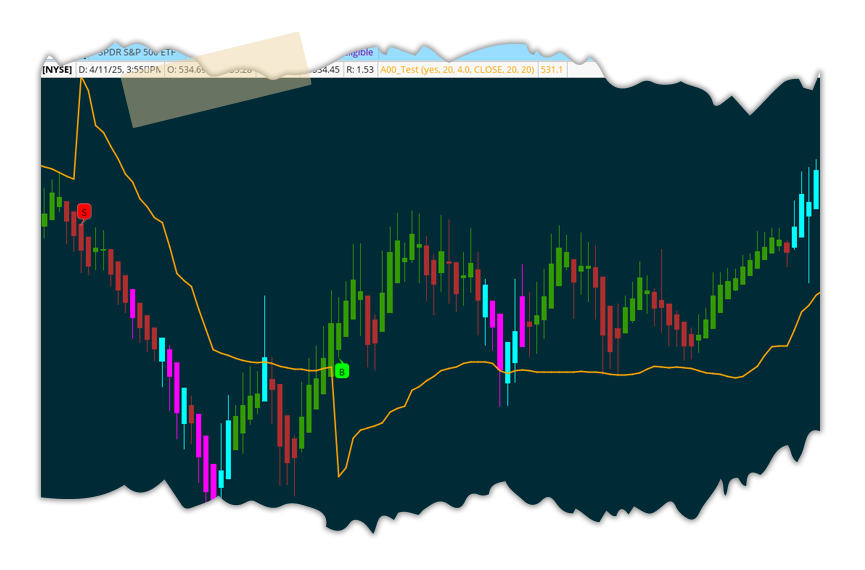
RSI Adaptive zones (AdaptiveRSI)
JP782 said:This script introduces a unified mathematical framework that auto-scales oversold/overbought and support/resistance zones for any period length. It also adds true RSI candles for spotting intrabar signals.
Built on the Logit RSI foundation, this indicator converts RSI into a statistically normalized space, allowing all RSI lengths to share the same mathematical footing.
https://usethinkscript.com/threads/rsi-adaptive-zones-adaptiversi-for-thinkorswim.21869/
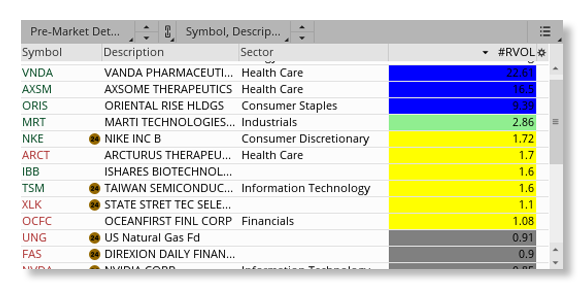
RVOL Watchlist
hboogie asked:After some tinkering, I wanted to share some code that gives me what I'm looking for specifically. Try it out and if there are enhancements or errors, let me know. Otherwise, enjoy.
I use it against a watchlist of stocks primarily.
https://usethinkscript.com/threads/rvol-watchlist-for-thinkorswim.21669/
VIP SUBSCRIBERS ONLY |
Ehlers Loop - Price/Volume Cycle Indicator
rewardiaz said:Diving into Ehlers’ genius mind has opened my eyes to the market in ways I can’t even express here. With that said, here’s my interpretation of the Ehlers Loop.
This study implements an “Ehlers Loops”-style framework by transforming price and volume into comparable, cycle-focused oscillators:
PriceRMS = a filtered, normalized “cycle component” of price
VolRMS = a filtered, normalized “cycle component” of volume
Both signals are produced using an Ehlers-inspired pipeline:
Roofing filter (2-pole Butterworth high-pass): removes slow drift/trend and isolates cyclical movement
Super Smoother: reduces noise while keeping low lag
RMS normalization: scales the output to its own recent “energy,” allowing price and volume to be compared on the same axis.
Read more
https://usethinkscript.com/threads/ehlers-loop-price-volume-cycle-indicator.21979/
Join our VIP Members Club to get access to our premium indicators including Buy The Dip, Advanced Market Moves and Take Profit.
Your VIP membership includes:
✓Full access to public & private forums
✓No Ads
✓Priority community support
✓Unlimited Postings
✓Premium thinkorswim indicators
✓Exclusive strategies, scanners, add-ons
✓Discord chatroom with Trade Alerts
VIP Membership
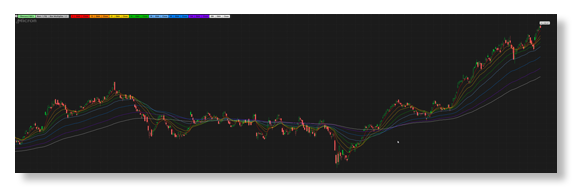
Fibonacci MAs – 8-Slot Engine
antwerks shared:This is my first time posting a study on the UseThinkScript forum, so I’m coming in straight and simple: this is a Moving Average stack I built for day-to-day chart work and quick visual alignment.
What it is
Fibonacci MAs – 8-Slot Engine (Per-MA AvgType + Per-MA PriceSource)
It plots up to 8 MA “slots” (default Fib lengths like 3/5/8/13/21/55/144/377), but you can change anything. Each slot has:
On/Off toggle
Length
Average type (AvgType per slot)
Price source per slot (Close/Open/High/Low/HL2/HLC3/OHLC4)
Why I made it
I wanted a clean way to run multiple MA lengths without constantly rewriting studies or juggling separate indicators. This keeps everything in one place, gives you consistent color mapping by slot, and prints useful labels so you always know exactly what’s on your chart.
https://usethinkscript.com/threads/fibonacci-mas-–-8-slot-engine.21986/
FROM THE ARCHIVES |
ATR + Volume Spikes
OGK shared:The Average True Range (ATR) indicator is a technical analysis tool that measures the volatility of an asset. It can be used to create a trading strategy by identifying periods of high volatility and making trades based on those conditions.
Here is an example of a simple ATR trading strategy:
Calculate the ATR for the asset you are trading. This can typically be done using a charting platform or software.
Identify the average ATR over a period of time (such as 14 days). This will be your "threshold" for determining high volatility.
When the current ATR is above the threshold, enter a long position (buy) in the asset.
When the current ATR is below the threshold, exit the long position (sell) and wait for the next period of high volatility.
Repeat the process for the next period of time.
Read more
https://usethinkscript.com/threads/atr-volume-spikes-for-thinkorswim.20874/
Last edited by a moderator:

