



Scroll down to check out this week's must reads, carefully selected by uTS Moderators!

Risk/Reward Visual Aid
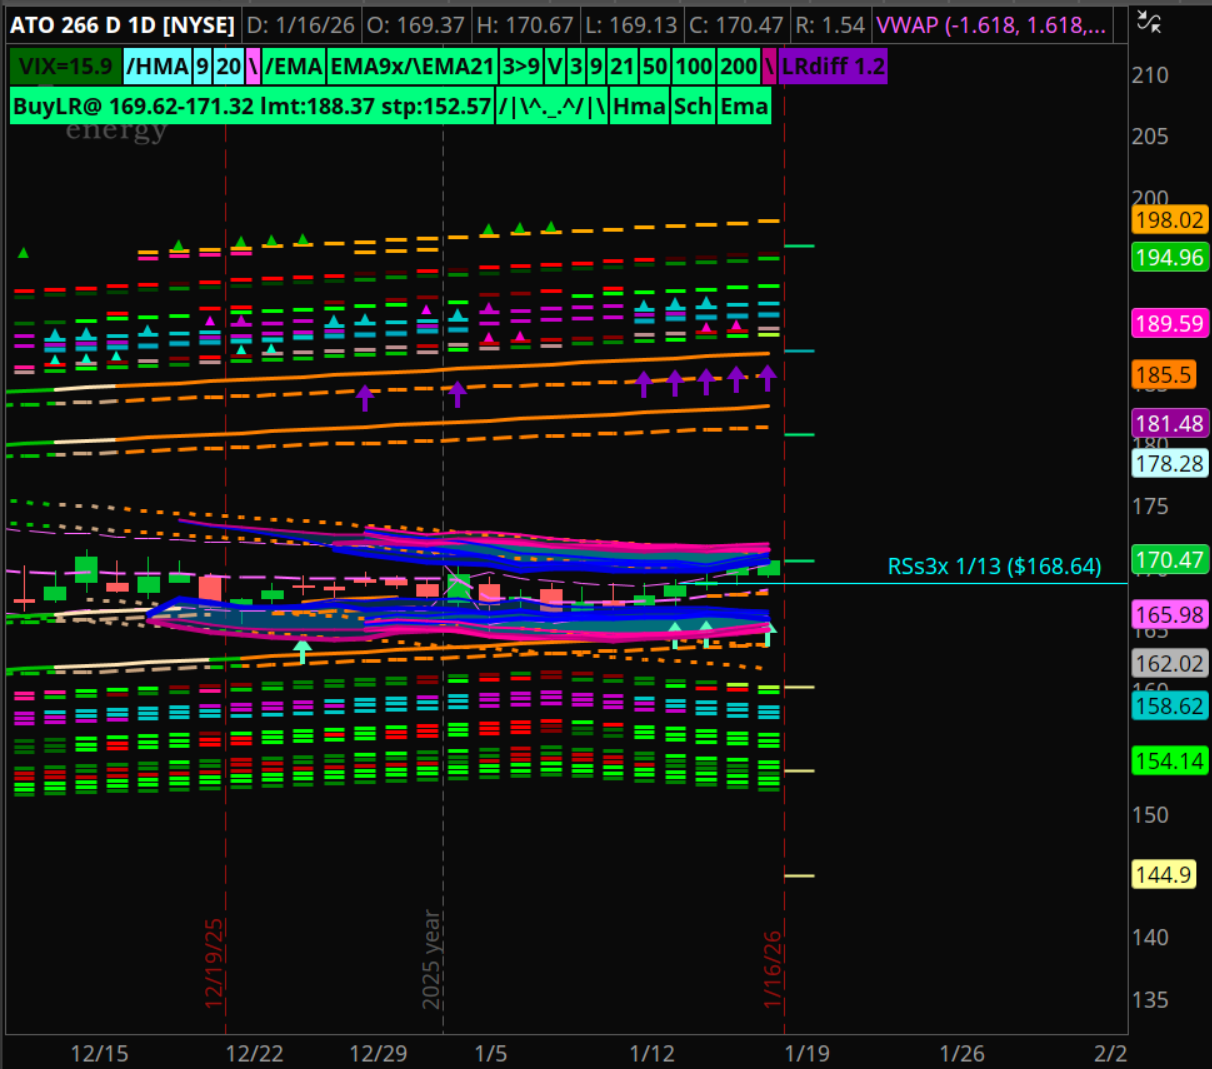
carey3 said:A script to show where +/-6%, 10% and 15% are from close for a visual aid in risk/reward decision making
#hint: This draws a horizontal bar at the close or PinValue and 3 set percentages above and below that value./n I wanted a visual line to show where plus and minus 6%, 10% and 15% or 20% was when walking through my watch list./n The PinValue will be used instead of the close value if it is set to anything other than 0.0.
Read more
https://usethinkscript.com/threads/risk-reward-visual-aid-for-thinkorswim.22040/
Markov Candle Prediction
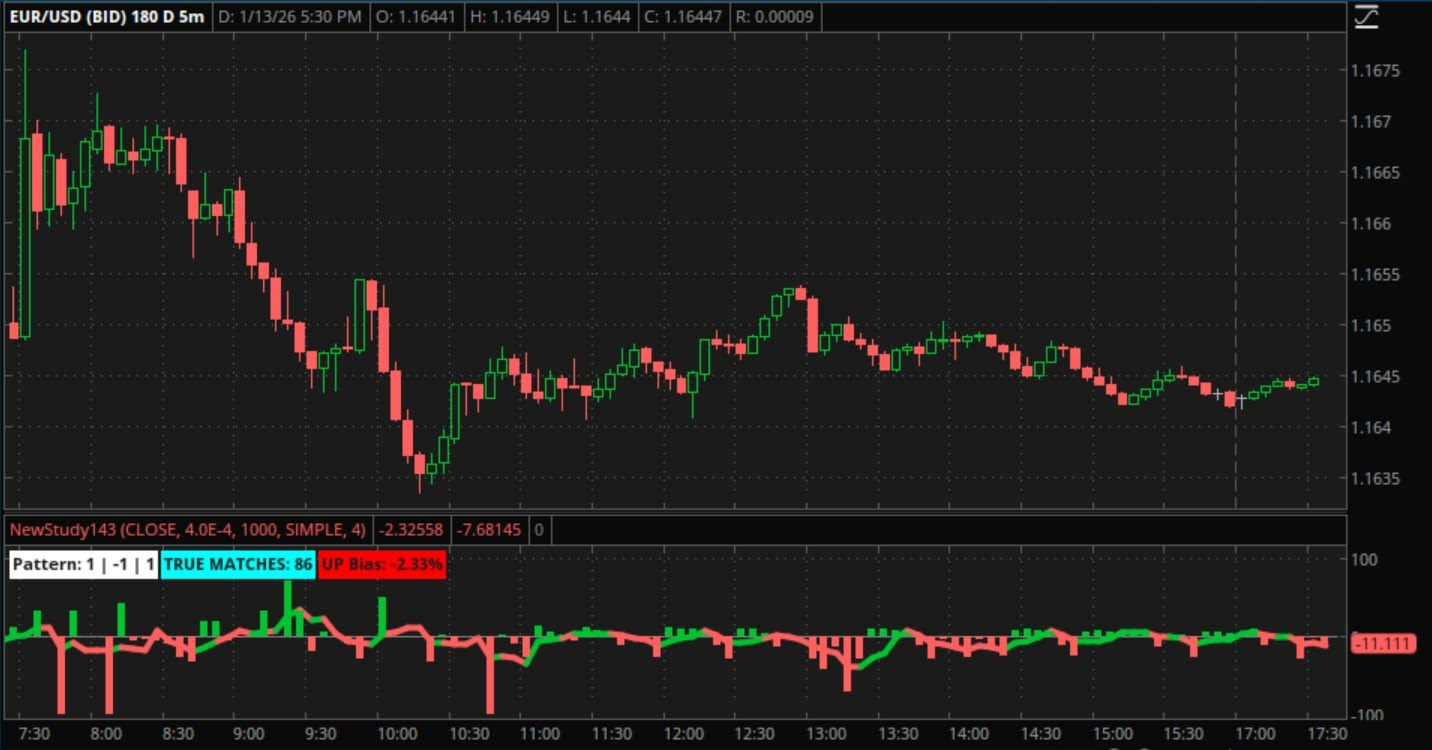
whoDAT asked:Caution - This study is resource intensive, doing over 2000 calculations per candle.
-- Oh, that got your attention didn't it.
-- You should really be here because the title says Markov Candle Prediction.
Markov uses chains of previous events to predict future events. This is how Google knows I'm about to mistype the word 'mistype' and offers me corrections. How does it do that? I predicted you'd ask, and here is that link you want...
Read more
https://usethinkscript.com/threads/markov-candle-prediction-for-thinkorswim.22035/
VIP SUBSCRIBERS ONLY |
Open_Close vs High_Low (candle visualization indicator)
antwerks said:TOS Candle Envelope Script with Timeframe Awareness
This updated ThinkOrSwim (TOS) lower study visually highlights candlestick structure using open/close, midpoint, high/low range envelopes, and real-time dynamic labeling. It now includes timeframe awareness, adjusting signal sensitivity based on whether you're using an intraday or higher timeframe chart.
Key Features
Cyan line: Candle open/close midpoint
Gray bands: High and low of each candle
Colored cloud fill based on signal type (reversal, strong close, neutral)
Signal dots for key conditions (reversal, strong bullish/bearish close)
Labels that explain candle behavior and signal interpretation
Adaptive logic for high vs. low timeframe charts
Timeframe-Aware Logic
Automatically detects if chart is daily or higher
Adjusts body percentage threshold for indecision detection
Adjusts compression sensitivity for low-volatility signals
Displays a label indicating the active timeframe mode
Read more
https://usethinkscript.com/threads/open_close-vs-high_low-candle-visualization-indicator.22046/
Join our VIP Members Club to get access to our premium indicators including Buy The Dip, Advanced Market Moves and Take Profit.
Your VIP membership includes:
✓Full access to public & private forums
✓No Ads
✓Priority community support
✓Unlimited Postings
✓Premium thinkorswim indicators
✓Exclusive strategies, scanners, add-ons
✓Discord chatroom with Trade Alerts
VIP Membership
Double Pass - Auto Adjusting Kalman Filter
whoDAT shared:The auto-adjusting Kalman filter dynamically updates its estimate for noise. A single pass of the Kalman filter provides good information on the direction and magnitude of the signal in noisy data. Processing any filtered data again through the same filter produces even smoother data (think how double exponential moving averages are compared to the exponential moving average.)
This study allows you to process your chart through the Kalman filter once (magenta line in the image below) and/or process that result again producing double Kalman filtered data (yellow line).
Kalman filters were used extensively for trajectory calculations during the Apollo moon missions. Hope this can also take you to the moon!
Read more
https://usethinkscript.com/threads/double-pass-auto-adjusting-kalman-filter-for-thinkorswim.22048/

FROM THE ARCHIVES |
Relative Vigor Index (RVI)
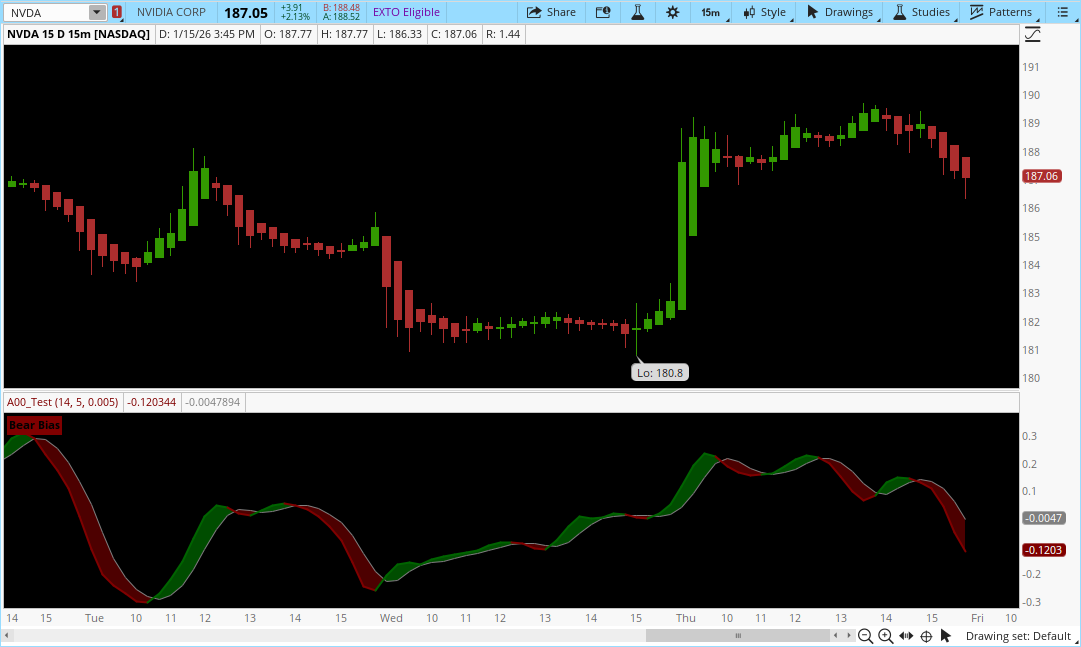
BenTen shared:Why the Relative Vigor Index (RVI) Can Be a Better Confirmation Study Than RSI or Stochastics.
The problem with the classic tools — RSI and Stochastics — is that they are extremely sensitive to bar‑to‑bar noise. They twitch, they overreact, and they often fire signals that have nothing to do with actual trend strength.
The Relative Vigor Index (RVI), originally developed by John Ehlers, takes a different approach. Instead of reacting to every tiny fluctuation, it measures whether price tends to close near the highs in an uptrend or near the lows in a downtrend, and it smooths that measurement with a FIR filter. The result is a calmer, more stable oscillator that behaves more like a trend confirmation tool and less like a panic generator.
Read more
https://usethinkscript.com/threads/relative-vigor-index-rvi-for-thinkorswim.874/
Last edited:

