



Scroll down to check out this week's must reads, carefully selected by uTS Moderators!

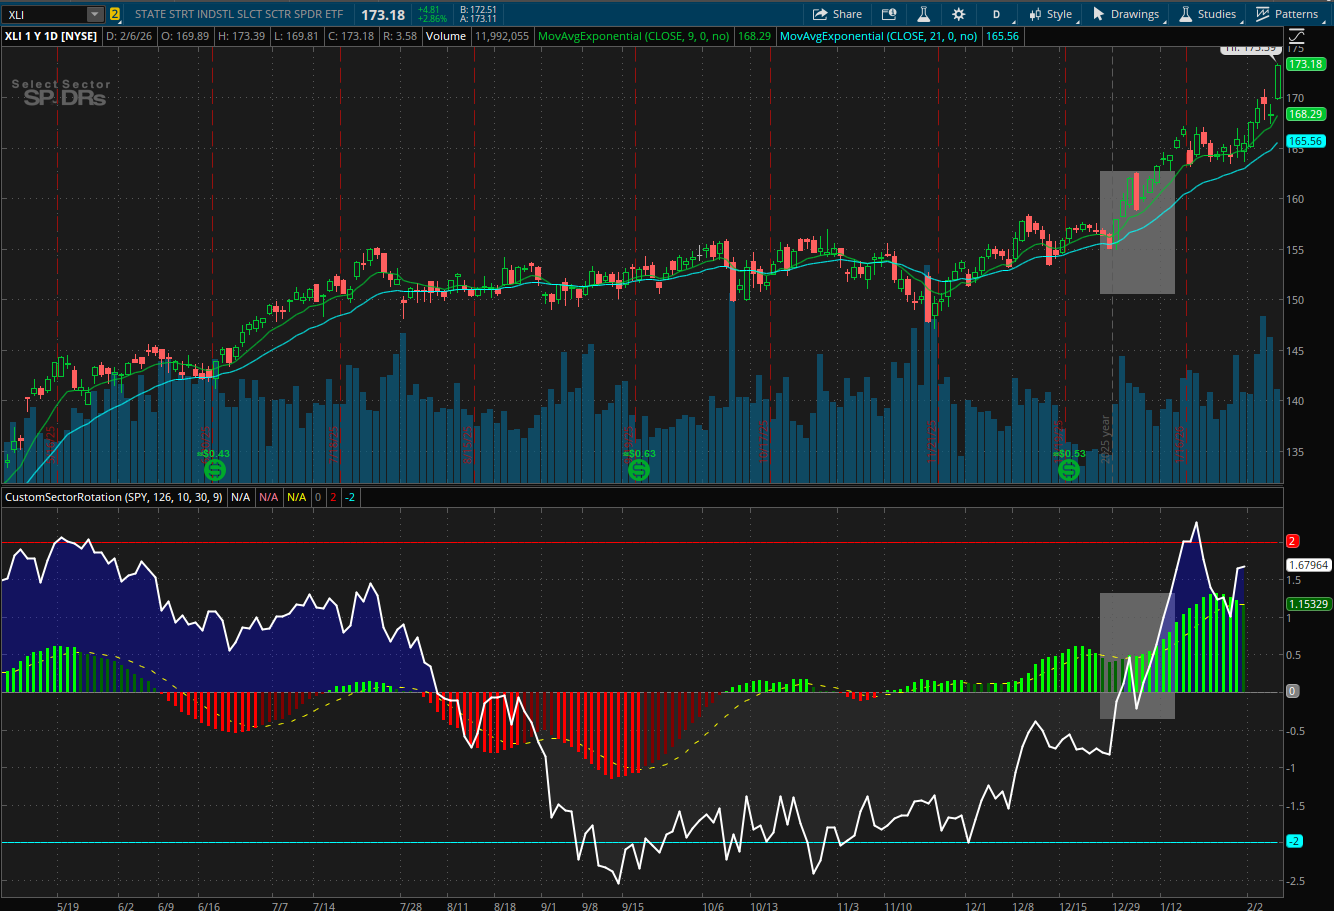
Relative Strength Z-Score Histogram
justAnotherTrader said:I built this indicator to solve a specific problem: identifying sector rotations before they become obvious. Turns out though, this thing can do a lot more than that. While price tells you where a stock is, Relative Strength (RS) Z-Scores tell you how much energy is actually behind the move compared to the rest of the market.
What started as a tool for quick rotations has evolved into a complete framework for navigating market cycles.
Read more
https://usethinkscript.com/threads/relative-strength-z-score-histogram-for-thinkorswim.22106/
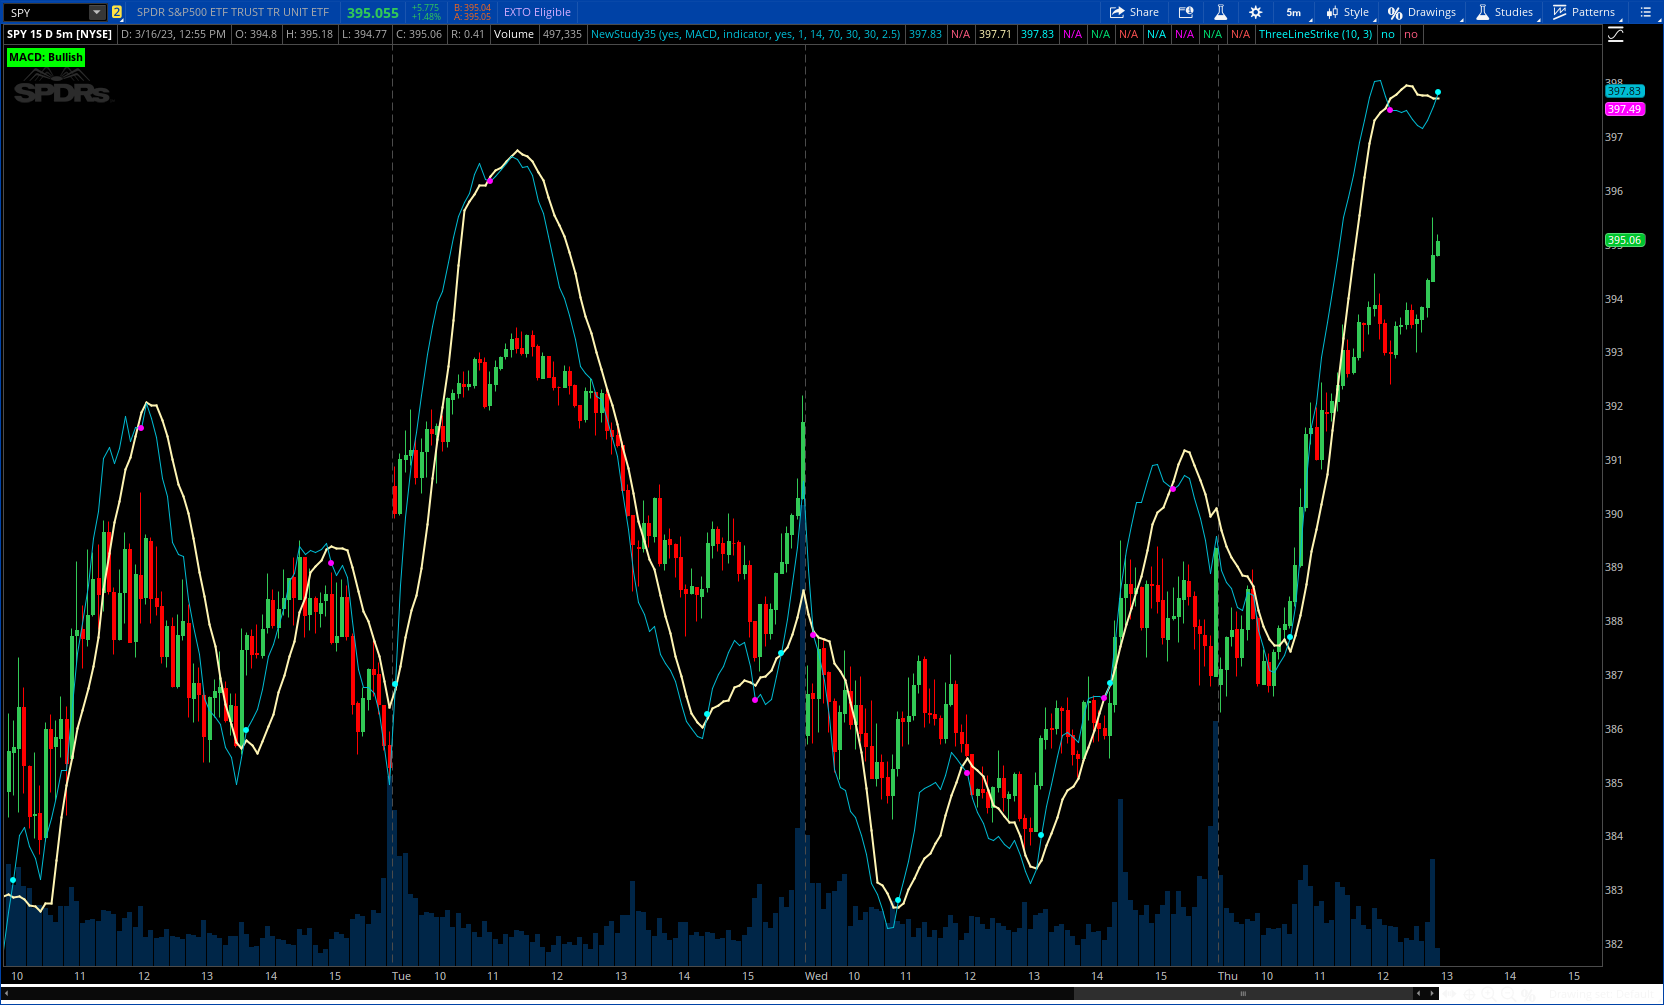
MACD & RSI Overlay (Expo)
samer800 asked:The MACD & RSI Overlay (Expo) trading indicator is a technical analysis tool that combines two popular indicators, the Relative Strength Index (RSI [14]) and the Moving Average Convergence Divergence (MACD [12,26]), and overlays them onto the price chart. The indicator oscillates relative to price, so it plots the RSI and MACD around price while still displaying the same insights as the regular MACD and RSI indicators.
This feature gives traders a unique perspective, allowing them to see the relationship between price, momentum, and trend in a single chart. This indicator is a valuable addition to any trader's technical analysis toolkit, whether they are a beginner or an experienced trader.
Read more
https://usethinkscript.com/threads/macd-rsi-overlay-expo-for-thinkorswim.14870/
VIP SUBSCRIBERS ONLY |
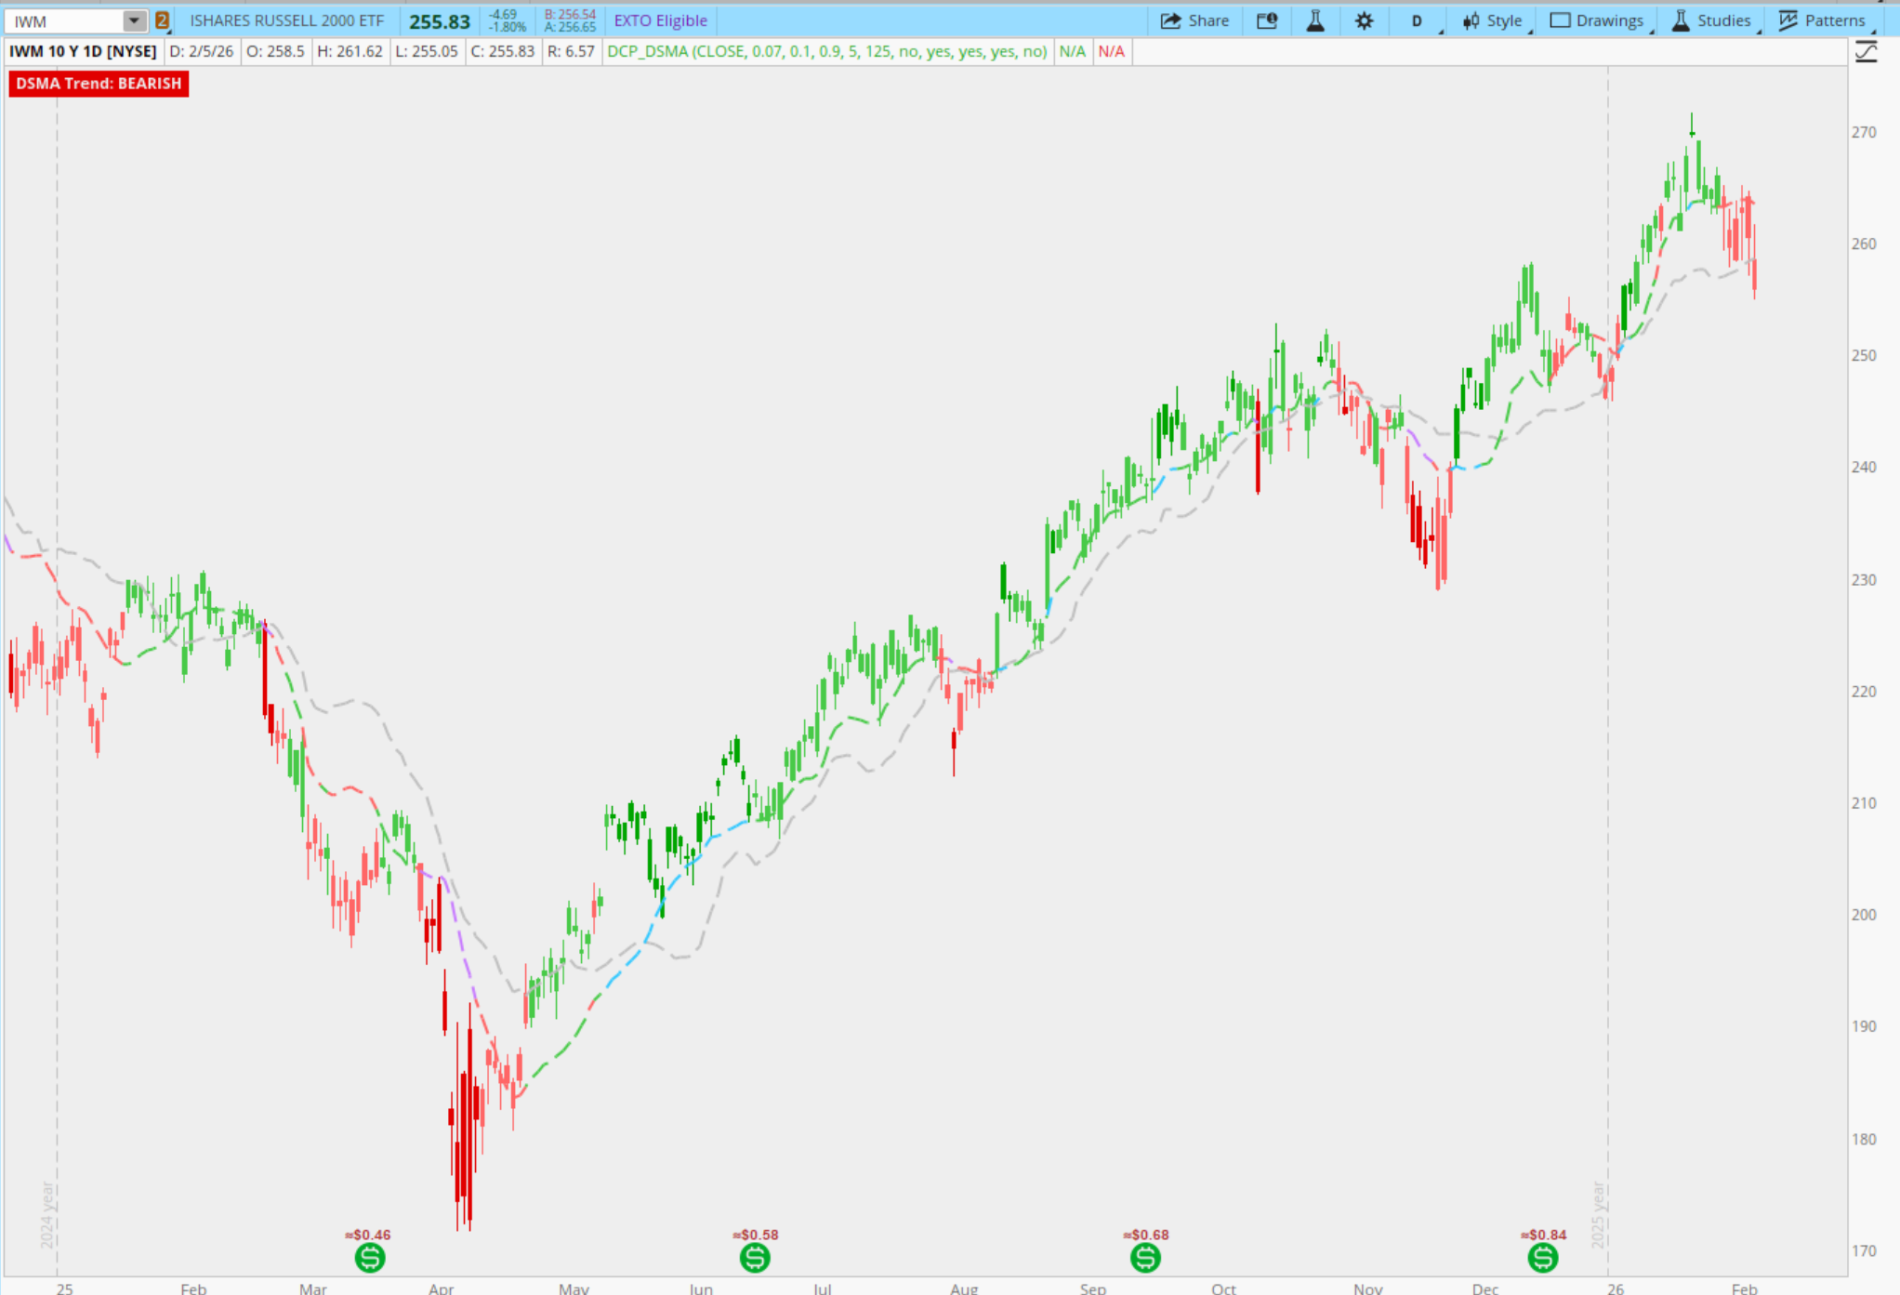
DCP/DSMA Trend
rewardiaz said:As I continue diving into Ehlers’ work, I came across his paper on the Deviation-Scaled Moving Average (DSMA). In it, he describes the EMA as a type of adaptive moving average with a smoothing filter applied. He then discusses popular adaptive MAs like VIDYA and KAMA, explaining that calculating the alpha modifier can introduce computational lag.
So, he developed DSMA, which adjusts the EMA’s alpha based on the amplitude of an oscillator scaled to the standard deviation from the mean.
Based on that, I decided to test whether applying Ehlers’ DCP with DSMA would produce a more robust trend signal with as little lag as possible.
From there, following Ehlers’ framework, I applied the same logic of calculating the RMS between DSMA(LP) and DSMA(HP) to establish trend strength.
Read more
https://usethinkscript.com/threads/dcp-dsma-trend.22100/
Join our VIP Members Club to get access to our premium indicators including Buy The Dip, Advanced Market Moves and Take Profit.
Your VIP membership includes:
✓Full access to public & private forums
✓No Ads
✓Priority community support
✓Unlimited Postings
✓Premium thinkorswim indicators
✓Exclusive strategies, scanners, add-ons
✓Discord chatroom with Trade Alerts
VIP Membership
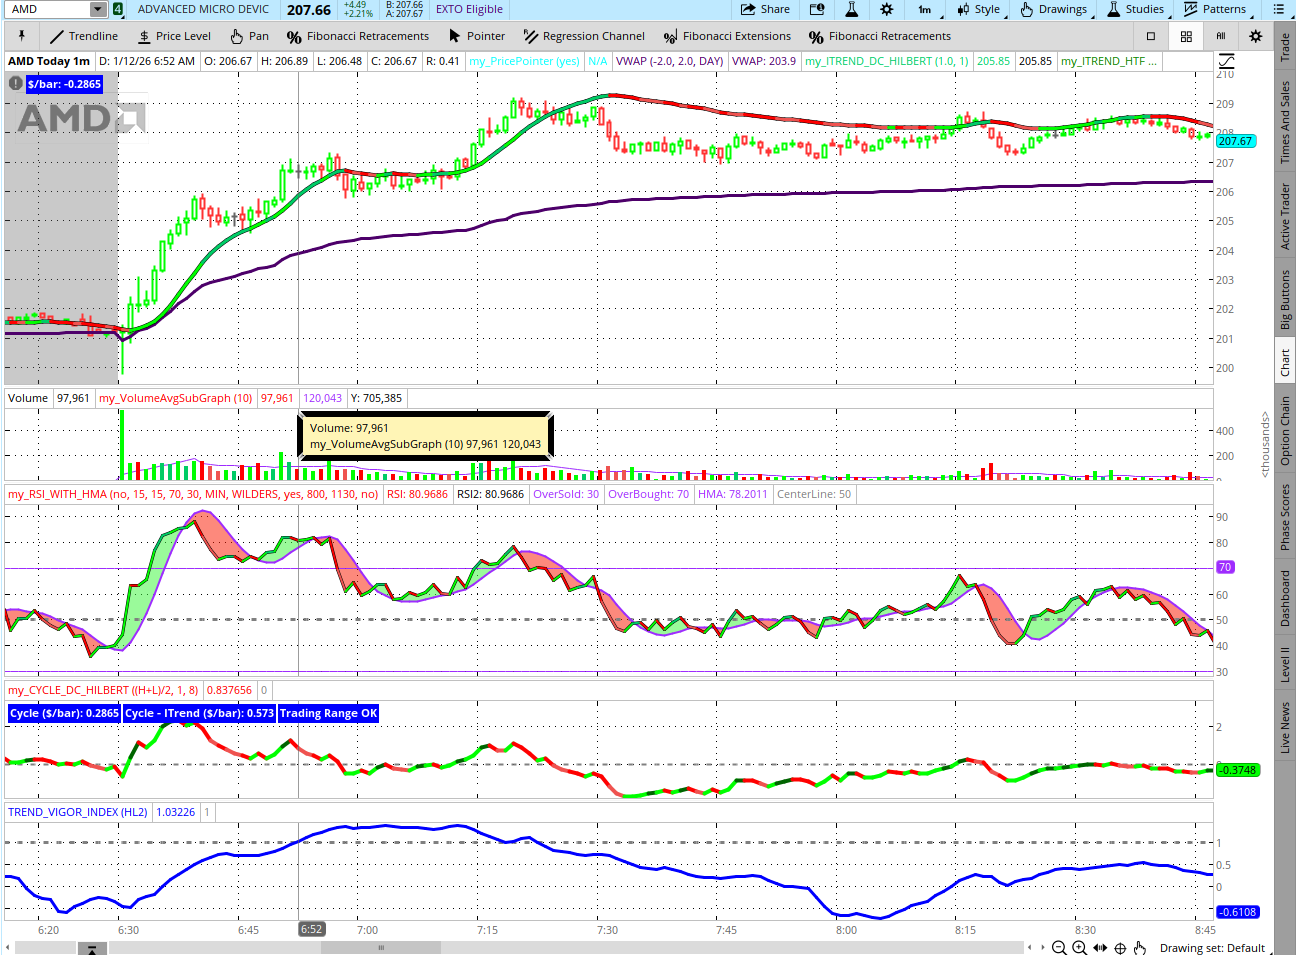
Trend Vigor
Sesqui shared:I did not find a Trend Vigor indicator so I am adding it.
Trend Vigor, per Dr Ehlers, is used to determine if the market is trending or cycling.
• Suppose an RSI signals a valley
– The trading action is to buy
• However, the market keeps going down
– In hindsight a trend mode has started
• Oscillators and Moving Averages often give opposite signals
THE REAL PROBLEM IS HOW TO IDENTIFY THE CORRECT MARKET MODE...
Read more
https://usethinkscript.com/threads/trend-vigor-for-thinkorswim.22107/
FROM THE ARCHIVES |
Bullish and Bearish Engulfing Candles
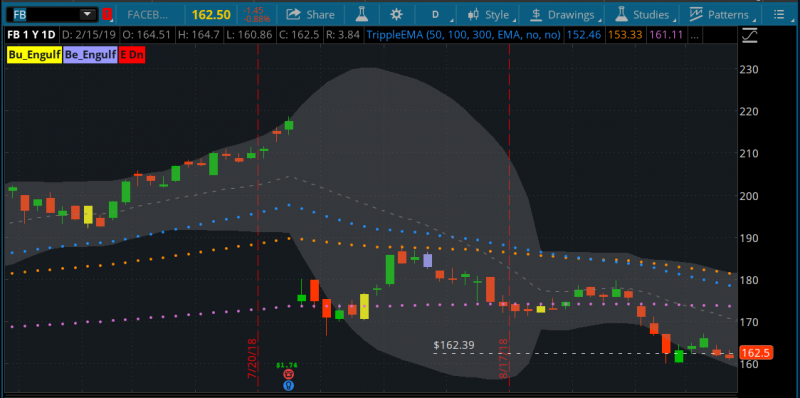
BenTen shared:Engulfing pattern on your candlestick chart can be useful for identifying trend changes, potential reversal play, etc. Here is an indicator for ThinkorSwim that will automatically find and highlight Engulfing candle on your chart. Both bullish and bearish engulfing patterns.
I also included labels and a unique color for each type of pattern. By default, a bullish engulfing candle will be yellow and a bearish engulfing candle will be purple. You can change this via the source code. This works for any timeframes.
Read more
https://usethinkscript.com/threads/bullish-and-bearish-engulfing-candles-in-thinkorswim.63/
Last edited:

