



Scroll down to check out this week's must reads, carefully selected by uTS Moderators!

Multi-CandleStick Patterns Confluences
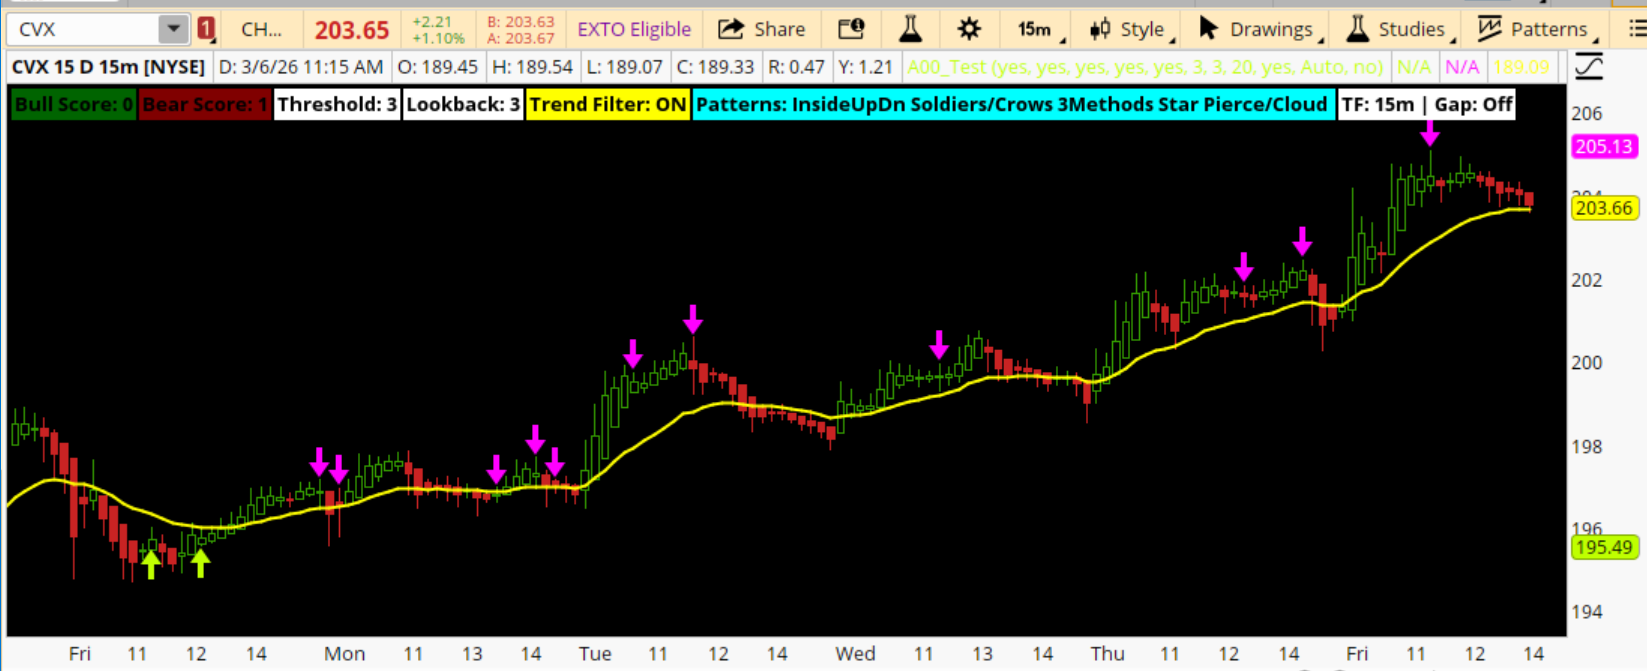
ilgarm said:The Multi-Pattern Confluence script, is a ThinkOrSwim (thinkScript) study that detects five well-known Japanese candlestick patterns and combines them into a single weighted confluence score.
Instead of acting on any single pattern in isolation, the study requires multiple patterns to align within a configurable look back window before generating a signal.
The core idea is simple: one pattern is a suggestion; multiple patterns are conviction.
https://usethinkscript.com/threads/multi-candlestick-patterns-confluences-for-thinkorswim.22246/
Regime Study
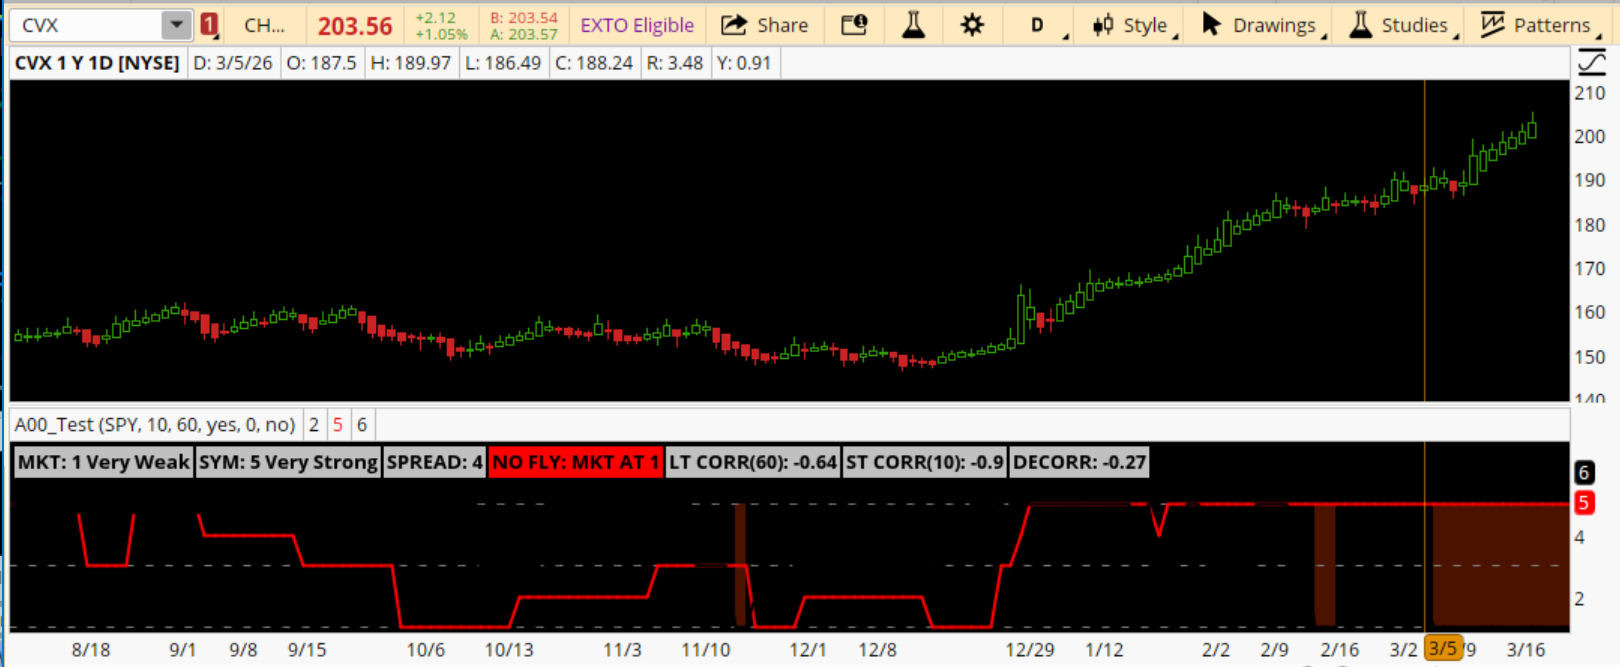
SilentPartner said:I recently developed this study to help me screen regimes for a swing trading strategy I have. It is based on the simple higher high / higher low and vise versa price action regime concept. I'm using /ES as my "Market" with a HMA of 10.
So far it is doing its job pretty well. When Market is a 1 I am filtering out 80% negative trades. The other combinations of variables I still have to test.
https://usethinkscript.com/threads/regime-study-for-thinkorswim.22201/
VIP SUBSCRIBERS ONLY |
Ehlers Loop QUAD Internals-Rotation
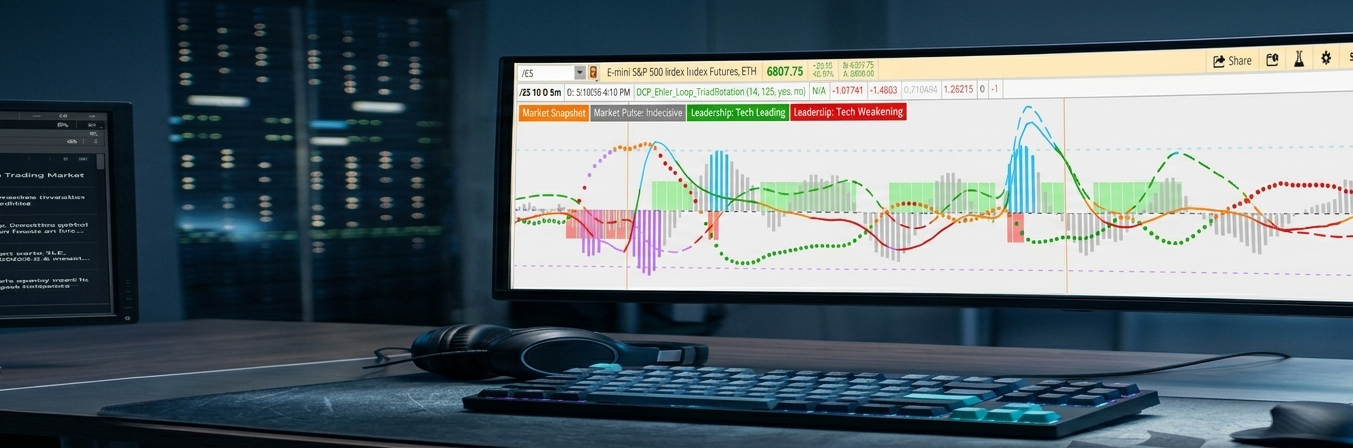
antwerks said:Reading the Admin’s brief every day has pushed me to find a way to bring everything together in a single X/Y file. For this, I used the Ehlers Loop Pair Rotation. Please note this is an experiment, and I simply compiled Merry and Admin into a single indicator. Personally, I find it very informative and useful. Is it the best route? Perhaps not, but hey, I’m giving it a shot.
I also included atcsam internal labels to stay informed.
Best settings: use it separately from the stock, remove pre-market data, and use a 15-minute chart.
Again, this is an experiment. I hope it helps others.
Dotted line > VIX
Dash Line > $ADD
Firm Line > NYSERatio
Gray Histogram > $TICK
Read more
https://usethinkscript.com/threads/ehlers-loop-quad-internals-rotation.22175/
Join our VIP Members Club to get access to our premium indicators including Buy The Dip, Advanced Market Moves and Take Profit.
Your VIP membership includes:
✓Full access to public & private forums
✓No Ads
✓Priority community support
✓Unlimited Postings
✓Premium thinkorswim indicators
✓Exclusive strategies, scanners, add-ons
✓Discord chatroom with Trade Alerts
Zanger Volume Ratio
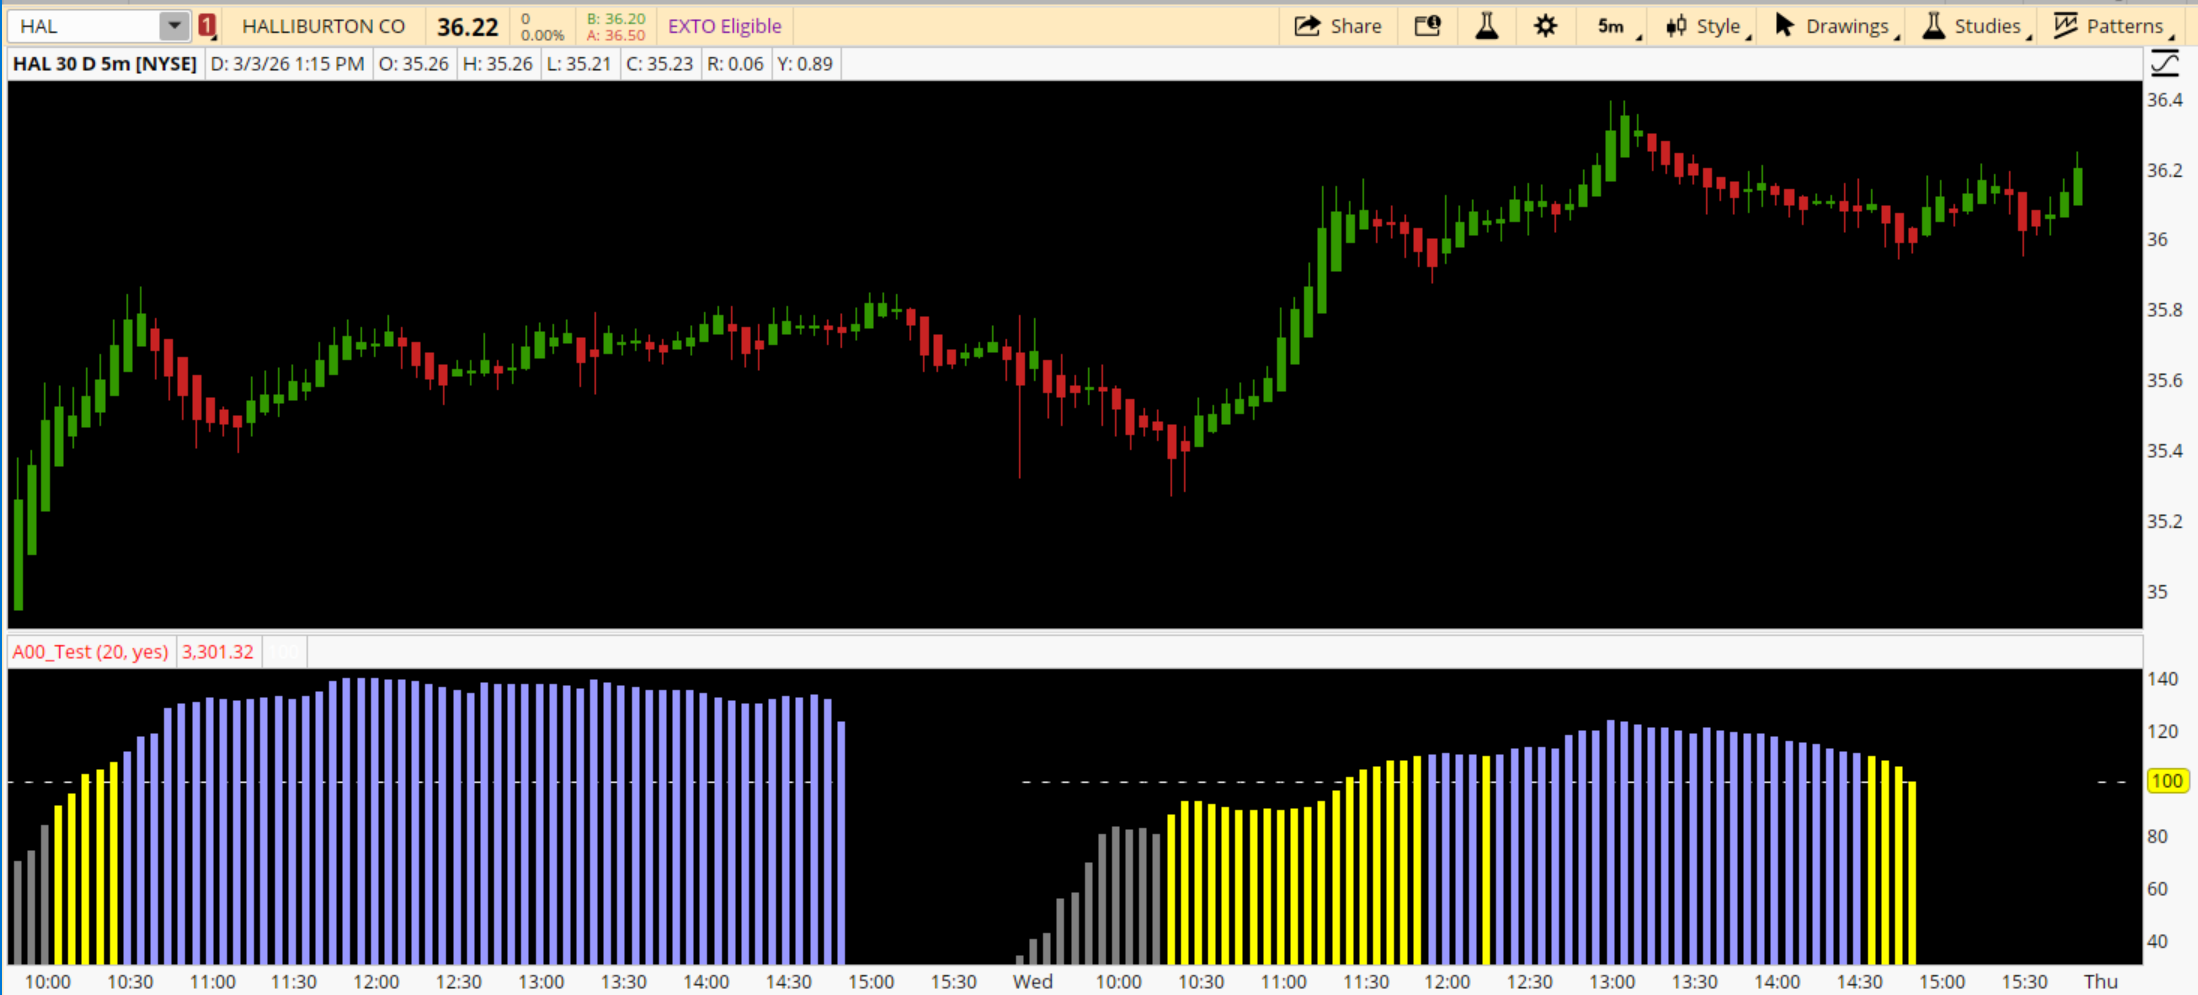
SwingIsKing shared:Zanger Volume tells you whether the move has real participation at this exact moment in the session.
The colors show how far above or below normal the volume curve is.
You don’t trade the color—you trade the setup, and the color tells you whether the setup has fuel.
https://usethinkscript.com/threads/zanger-volume-ratio-for-thinkorswim.22241/
FROM THE ARCHIVES |
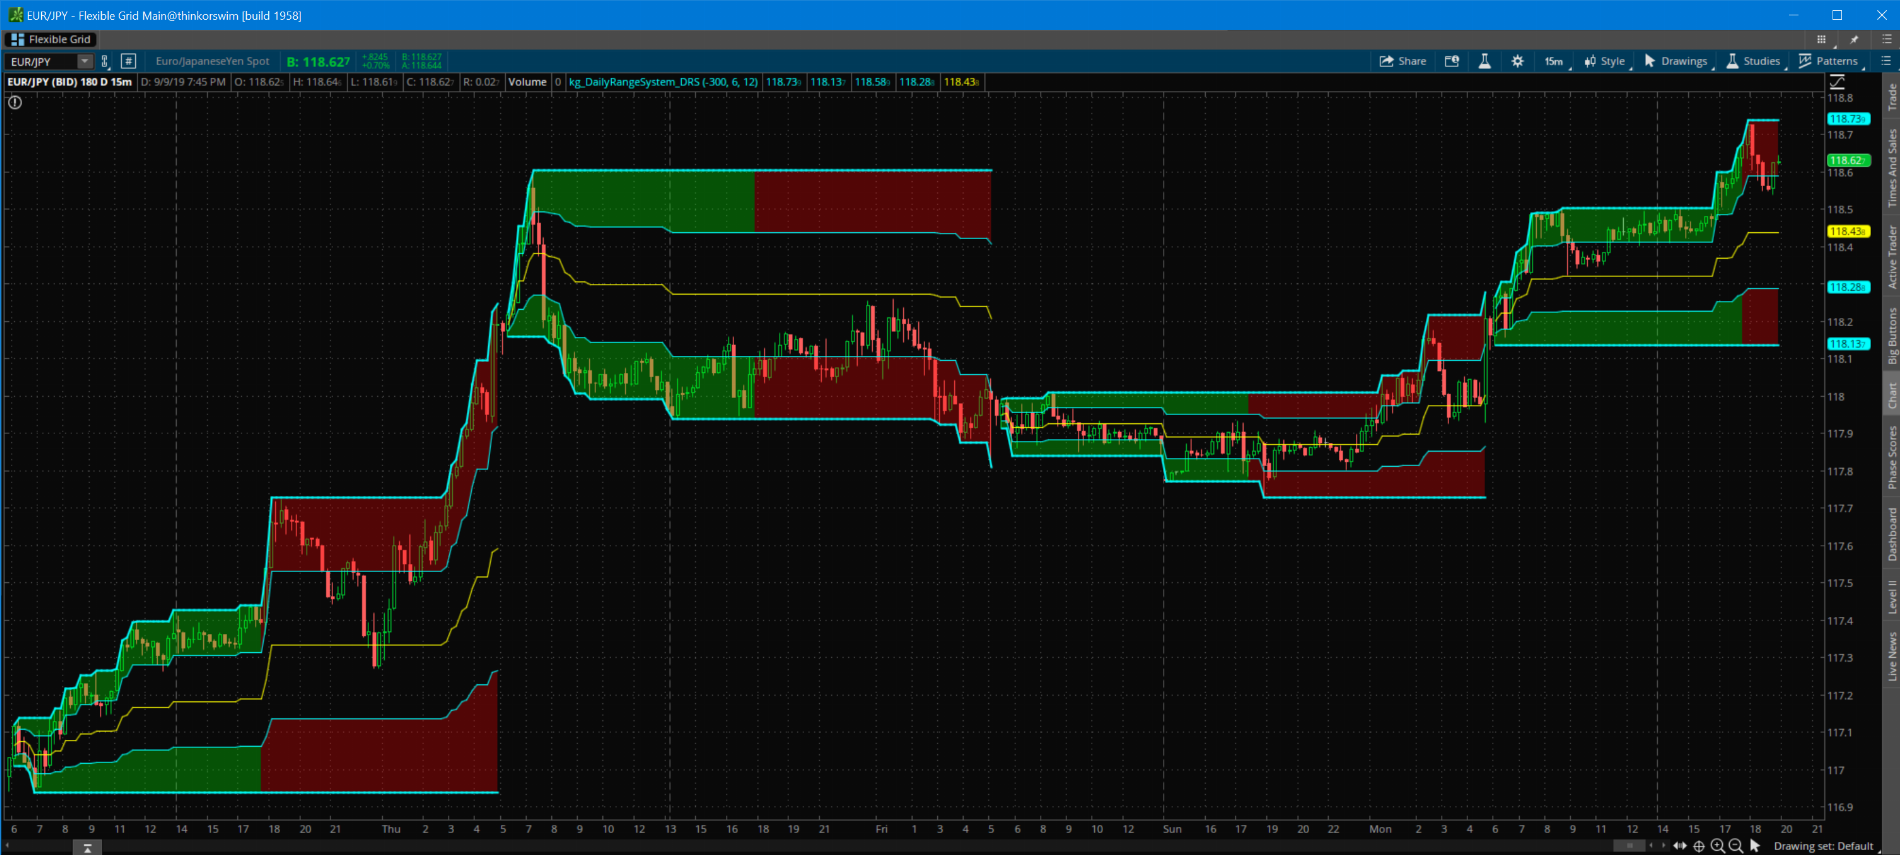
Daily Range System (DRS) Indicator
korygill shared:This DRS indicator is a stable, pre‑defined daily range map that tells where the market is likely to react.
It the day’s high, low, and key reaction levels. So you know where to avoid chasing, where to expect reversals, and where breakouts are more likely to stick.
Read more
https://usethinkscript.com/threads/daily-range-system-drs-indicator-for-thinkorswim.608/
Last edited:

