#clouds_10bar_frames_peak_00f2
#https://usethinkscript.com/threads/2-consecutive-10-bar-frames-rectangles.21032/
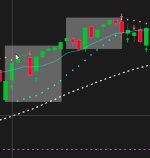
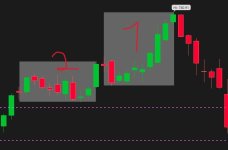
#2 consecutive 10-bar frames (rectangles)
def na = Double.NaN;
def bn = BarNumber();
#def lastBar = HighestAll(if IsNaN(close) then 0 else bn);
def lastbn = HighestAll(if IsNaN(close) then 0 else bn);
def lastbar = bn == lastbn;
#def lastbar = (!isnan(close) and isnan(close[-1]));
def big = 99999;
input find_peak_in_last_x_bars = 15;
addlabel(1, "find peak in the " + find_peak_in_last_x_bars + " bars before the last bar", color.yellow);
# find hihi and its bn in last 15 bars, before last bar
def hihi;
def hihibn;
if bn == 1 then {
hihi = 0;
hihibn = 0;
} else if bn == (lastbn - find_peak_in_last_x_bars) then {
hihi = fold a = 0 to find_peak_in_last_x_bars
with b
do max(b, getvalue(high,-a));
hihibn = bn + (fold c = 0 to find_peak_in_last_x_bars
with d
while hihi != getvalue(high, -c)
do d + 1);
} else if lastbar or isnan(close) then {
hihi = 0;
hihibn = 0;
} else {
hihi = hihi[1];
hihibn = hihibn[1];
}
def hihibn2 = highestall(hihibn);
input show_line_over_last_xbars = no;
# plot a line over the 15 bars before the last bar
plot z5 = if show_line_over_last_xbars and hihi > 0 then hihi*1.0005 else na;
#z5.SetPaintingStrategy(PaintingStrategy.HORIZONTAL);
z5.SetPaintingStrategy(PaintingStrategy.dashes);
#z5.SetStyle(Curve.short_DASH);
z5.setdefaultcolor(color.gray);
z5.hidebubble();
# plot a dot on the highest high
plot z6 = if bn >= (lastbn - find_peak_in_last_x_bars) and hihi == high then high else na;
z6.SetPaintingStrategy(PaintingStrategy.POINTS);
z6.SetDefaultColor(Color.white);
z6.setlineweight(3);
z6.hidebubble();
addchartbubble(0,low*.995,
hihi + "\n" +
bn + "\n" +
hihibn
, color.yellow, no);
#-----------------------
input rectangle1_bars = 10;
input rectangle2_bars = 10;
# rect1 before hihi
def rect1_firstbn = hihibn2 - rectangle1_bars + 1;
def rect1_lastbn = hihibn2;
# rect2 before rect1
def rect2_firstbn = rect1_firstbn - (rectangle2_bars + 0);
def rect2_lastbn = rect1_firstbn - 1;
def rect1 = (bn >= rect1_firstbn and bn <= rect1_lastbn);
def rect2 = (bn >= rect2_firstbn and bn <= rect2_lastbn);
#--------------------
# rect1
def rect1_hi;
def rect1_lo;
if rect1_firstbn == bn then {
rect1_hi = GetValue(Highest(high, rectangle1_bars), -(rectangle1_bars-1));
rect1_lo = GetValue(Lowest(low, rectangle1_bars), -(rectangle1_bars-1));
} else if rect1 then {
rect1_hi = rect1_hi[1];
rect1_lo = rect1_lo[1];
} else {
rect1_hi = 0;
rect1_lo = 0;
}
plot z1 = if 1 and rect1_hi > 0 then rect1_hi else na;
plot z2 = if 1 and rect1_lo > 0 then rect1_lo else na;
z1.SetDefaultColor(Color.cyan);
z1.setlineweight(1);
z1.hidebubble();
z2.SetDefaultColor(Color.cyan);
z2.setlineweight(1);
z2.hidebubble();
def r1top = if rect1_hi > 0 then rect1_hi else na;
def r1bot = if rect1_lo > 0 then rect1_lo else na;
addcloud(r1top,r1bot,color.gray);
#--------------------
# rect2
def rect2_hi;
def rect2_lo;
def r2sshorter;
if rect2_firstbn == bn then {
rect2_hi = GetValue(Highest(high, rectangle2_bars), -(rectangle2_bars-1));
rect2_lo = GetValue(Lowest(low, rectangle2_bars), -(rectangle2_bars-1));
r2sshorter = rect2_hi < rect1_hi[-rectangle2_bars];
} else if rect2 then {
rect2_hi = rect2_hi[1];
rect2_lo = rect2_lo[1];
r2sshorter = r2sshorter[1];
} else {
rect2_hi = 0;
rect2_lo = 0;
r2sshorter = 0;
}
plot z3 = if r2sshorter and rect2_hi > 0 then rect2_hi else na;
plot z4 = if r2sshorter and rect2_lo > 0 then rect2_lo else na;
z3.SetDefaultColor(Color.magenta);
z3.setlineweight(1);
z3.hidebubble();
z4.SetDefaultColor(Color.magenta);
z4.setlineweight(1);
z4.hidebubble();
def r2top = if r2sshorter and rect2_hi > 0 then rect2_hi else na;
def r2bot = if r2sshorter and rect2_lo > 0 then rect2_lo else na;
addcloud(r2top,r2bot,color.gray);
#--------------------
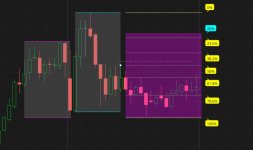
# % lines after peak
def rect2_en = if bn == 1 then 0
else if r2sshorter then 1
else rect2_en[1];
def hi;
def lo;
if bn == 1 or isnan(close[1]) then {
hi = na;
lo = na;
} else if bn == (hihibn2+1) and rect2_en then {
hi = rect1_hi[1];
lo = rect2_lo[rectangle1_bars + 1];
} else {
hi = hi[1];
lo = lo[1];
}
# hi = 0%
# lo = 100% drop
def rng = hi-lo;
input drop_percent = 20;
# purple line
#23.6%, 38.2%, 50%, 61.8%, and 78.6%.
input line_percent1 = 23.6;
input line_percent2 = 38.2;
input line_percent3 = 50.0;
input line_percent4 = 61.8;
input line_percent5 = 78.6;
#hint line_percent1: Enter 0 to turn line off
#hint line_percent2: Enter 0 to turn line off
#hint line_percent3: Enter 0 to turn line off
#hint line_percent4: Enter 0 to turn line off
#hint line_percent5: Enter 0 to turn line off
plot drop00 = hi;
plot drop100 = lo;
drop00.setdefaultcolor(getcolor(8));
drop100.setdefaultcolor(getcolor(8));
plot drop1 = if drop_percent == line_percent1 or line_percent1 == 0 then na else (drop00 - (line_percent1/100*rng));
plot drop2 = if drop_percent == line_percent2 or line_percent2 == 0 then na else (drop00 - (line_percent2/100*rng));
plot drop3 = if drop_percent == line_percent3 or line_percent3 == 0 then na else (drop00 - (line_percent3/100*rng));
plot drop4 = if drop_percent == line_percent4 or line_percent4 == 0 then na else (drop00 - (line_percent4/100*rng));
plot drop5 = if drop_percent == line_percent5 or line_percent5 == 0 then na else (drop00 - (line_percent5/100*rng));
drop1.setdefaultcolor(color.gray);
drop2.setdefaultcolor(color.gray);
drop3.setdefaultcolor(color.gray);
drop4.setdefaultcolor(color.gray);
drop5.setdefaultcolor(color.gray);
plot drop_per = drop00 - (drop_percent/100*rng);
drop_per.setdefaultcolor(color.magenta);
input show_sell_cloud = yes;
def cldtop = if show_sell_cloud then drop_per else na;
addcloud(cldtop, drop100, color.magenta);
input show_percent_bubbles = yes;
def bub_off = 2;
addchartbubble(show_percent_bubbles and rect2_en[bub_off] and !isnan(close[bub_off]) and isnan(close[bub_off-1]), drop00[bub_off],
"0%"
, color.yellow, yes);
addchartbubble(show_percent_bubbles and rect2_en[bub_off] and !isnan(close[bub_off]) and isnan(close[bub_off-1]), drop1[bub_off],
line_percent1 + "%"
, color.yellow, no);
addchartbubble(show_percent_bubbles and rect2_en[bub_off] and !isnan(close[bub_off]) and isnan(close[bub_off-1]), drop2[bub_off],
line_percent2 + "%"
, color.yellow, no);
addchartbubble(show_percent_bubbles and rect2_en[bub_off] and !isnan(close[bub_off]) and isnan(close[bub_off-1]), drop3[bub_off],
line_percent3 + "%"
, color.yellow, no);
addchartbubble(show_percent_bubbles and rect2_en[bub_off] and !isnan(close[bub_off]) and isnan(close[bub_off-1]), drop4[bub_off],
line_percent4 + "%"
, color.yellow, no);
addchartbubble(show_percent_bubbles and rect2_en[bub_off] and !isnan(close[bub_off]) and isnan(close[bub_off-1]), drop5[bub_off],
line_percent5 + "%"
, color.yellow, no);
addchartbubble(show_percent_bubbles and rect2_en[bub_off] and !isnan(close[bub_off]) and isnan(close[bub_off-1]), drop100[bub_off],
"100%"
, color.yellow, no);
# target %
addchartbubble(show_percent_bubbles and rect2_en[bub_off] and !isnan(close[bub_off]) and isnan(close[bub_off-1]), drop_per[bub_off],
drop_percent + "%"
, color.cyan, yes);
# close is in sell range x% to 100%
def x = (close <= drop_per and close > drop100);
#alert(a, "crossed up" ,alert.BAR, sound.DING);
alert(x, "sell" ,alert.BAR, sound.bell);
#--------------------
# test stuff
addchartbubble(0, low*0.995,
r2sshorter + "\n" +
rect2_en + "\n" +
rect2_hi + "\n" +
rect1_hi + "\n" +
rect1_hi[-rectangle2_bars]
, color.yellow, no);
input test1_bub = no;
addchartbubble(test1_bub, low*0.99,
bn + " BN\n" +
hihibn2 + " pk bn\n" +
rect1_firstbn + "-" + rect1_lastbn + "\n" +
rect1_hi + " R1\n" +
rect1_lo + " R1\n" +
rect2_firstbn + "-" + rect2_lastbn + "\n" +
rect2_hi + " R2\n" +
rect2_lo + " R2\n"
, (if rect1 then color.green else if rect2 then color.magenta else color.gray), no);
addchartbubble(0, low,
drop_per + "\n" +
close + "\n" +
drop100
, color.yellow, no);
#addverticalline(rect2, "-");
#

 Logic: