0 DTE option flow for SPX (WIP)

ChocolateVol

New member
see code fix in next post
Hi, I'm stuck with this script. Syntax appears to be right but for some reason I cant figure out why its not working. Issue is popping up at the ATM_option line.

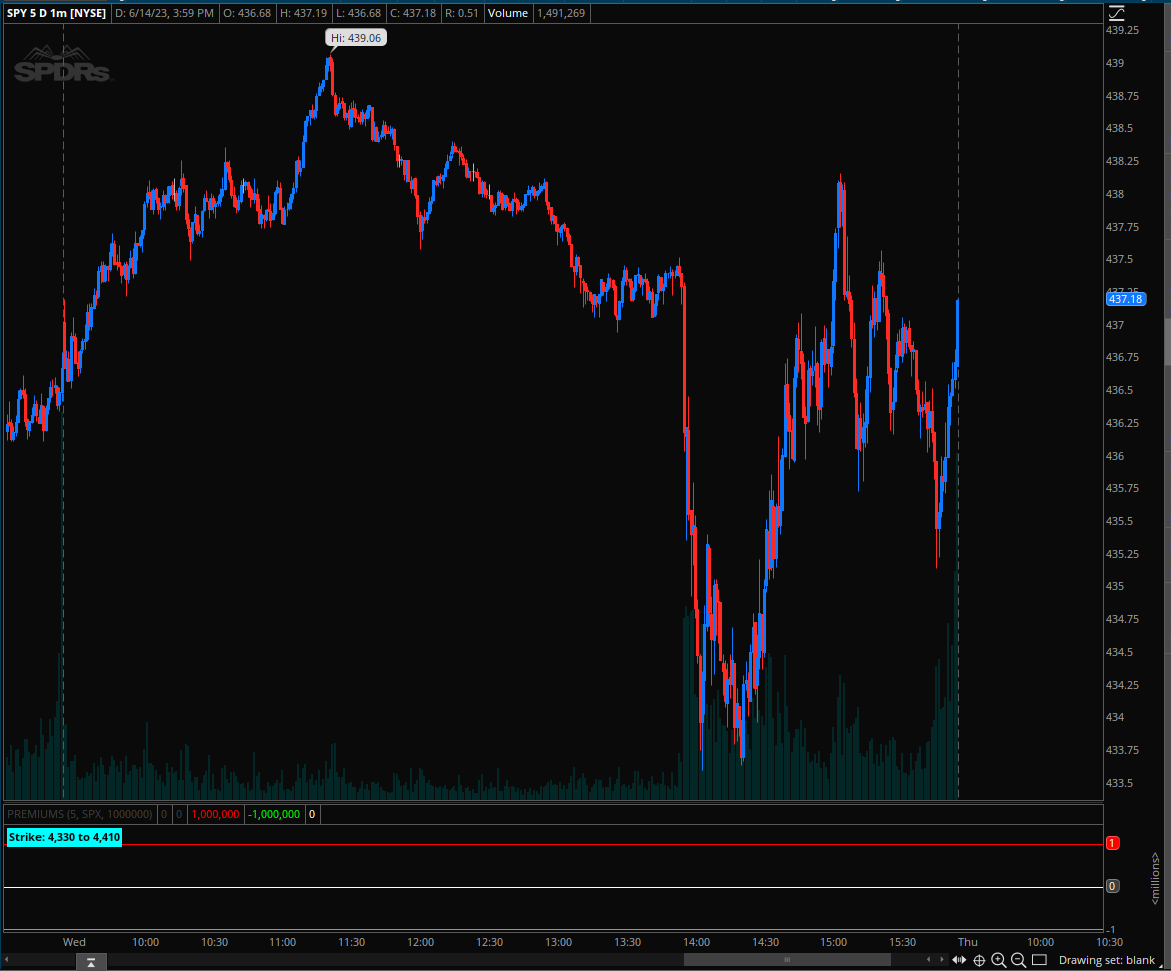
My goal is to track the intraday 0 DTE option volume for ATM calls and puts for SPX and SPY that are within the daily market maker's expected move (using the prior day's VIX close).

Once I can make it work for SPX calls I want to replicate for SPY and also use it on PUTS in a lower study or as an inverted negative histogram in the same plot.
I'm trying to track institutional buying/selling pressure (hence the threshold for size).

When the script is valid, ideally I want to explore beyond volume to track premium (price*volume) and gamma.

This on itself would ultimately always be a bias confirmation not an isolated trading signal.
 
Last edited by a moderator:
Solution
This study is great, thanks to all in this thread sharing.

One question, I am unable to get SPX premiums to display (even if my upper chart is SPY or /ES), I have also tried using SPXW as ticker as done with other scripts in this thread. Any idea why this isn't working?

Try this:
set show extended hours to off

Code:
# Run on 1 min chart only.  Calculates Premium. ( 1 min volume x 1 min OHLC4)
# Starts at 945. First 15 min lots of chaos and false signals.

declare lower;
declare once_per_bar;

input chain_width = 5;
input symbol = "SPXW"; #"SPXW"
input premium_extreme = 1000000;

def after945 = SecondsFromTime(945) >= 0;

def vix = close("VIX", AggregationPeriod.DAY)[1];
#def price = round(close(symbol...
This study is great, thanks to all in this thread sharing.

One question, I am unable to get SPX premiums to display (even if my upper chart is SPY or /ES), I have also tried using SPXW as ticker as done with other scripts in this thread. Any idea why this isn't working?

Try this:
set show extended hours to off

Code:
# Run on 1 min chart only.  Calculates Premium. ( 1 min volume x 1 min OHLC4)
# Starts at 945. First 15 min lots of chaos and false signals.

declare lower;
declare once_per_bar;

input chain_width = 5;
input symbol = "SPXW"; #"SPXW"
input premium_extreme = 1000000;

def after945 = SecondsFromTime(945) >= 0;

def vix = close("VIX", AggregationPeriod.DAY)[1];
#def price = round(close(symbol, AggregationPeriod.day)[1],0);
def price = round(close("SPX", AggregationPeriod.day)[1],0);


def move = vix / Sqrt(252) / 100;
def strike_down =  Round (price * (1 - move) / chain_width, 0.01) * chain_width;
def strike_up = Round (price * (1 + move) / chain_width, 0.01) * chain_width;
addlabel(yes, "Strike: " + strike_down + " to " + strike_up, color.cyan);


# get 0DTE expiration
def CurrentYear = GetYear()-2000;
def CurrentMonth = GetMonth();
def CurrentDay = GetDayOfMonth(GetYYYYMMDD());
def DateString = CurrentYear * 10000 + CurrentMonth * 100 + CurrentDay;

def Call_VolumexOHLC = fold strike_c = strike_down to strike_up with v do v +
                if IsNaN(volume("." + symbol +  AsPrice(DateString) + "C" + AsPrice(strike_c))) then 0
                else (volume("." + symbol +  AsPrice(DateString) + "C" + AsPrice(strike_c))
                *ohlc4("." + symbol +  AsPrice(DateString) + "C" + AsPrice(strike_c))
                );

def Put_VolumexOHLC = fold strike_p = strike_down to strike_up with v_p do v_p +
                if IsNaN(volume("." + symbol +  AsPrice(DateString) + "P" + AsPrice(strike_p)))then 0
                else (volume("." + symbol +  AsPrice(DateString) + "P" + AsPrice(strike_p))
                *ohlc4("." + symbol +  AsPrice(DateString) + "P" + AsPrice(strike_p))
                );

plot calls_total = if after945 then Call_VolumexOHLC*100 else 0;
calls_total.SetPaintingStrategy(PaintingStrategy.SQUARED_HISTOGRAM);
calls_total.AssignValueColor(if calls_total > premium_extreme then Color.GREEN else Color.DARK_GRAY);


plot puts_total = if after945 then -1.0 * put_VolumexOHLC*100 else 0;
puts_total.SetPaintingStrategy(PaintingStrategy.SQUARED_HISTOGRAM);
puts_total.AssignValueColor(if puts_total < -1.0 * premium_extreme then Color.RED else Color.DARK_GRAY);

plot highline = premium_extreme;
plot lowline = -1*premium_extreme;
highline.SetDefaultColor(Color.red);
lowline.SetDefaultColor(Color.green);
 
Last edited by a moderator:
Solution
Yes I'm on a 1 min chart with extended trading hours turned off, the same settings work with SPY as an input.

Also it looks like valid strikes are being pulled, just no data is being plotted

OksP4CW.png


maybe its possible that in between the two edge strikes being displayed the script is checking invalid ones?
Hey. Try setting Time Interval = Today
 
I need to work on top of @2187Nick awesome script above that uses premium, but below is just a teaser of what 1) SPX option volume flow around the ATM strikes (excluding SPY and /ES and above an arbitrary threshold) using 2min bars, combined with 2) a VVIX signal I started playing with would have looked like today. More to come before Friday hopefully.


View attachment 18712
This is awesome, can you please share the code?

Try this:

Code:
# Run on 1 min chart only.  Calculates Premium. ( 1 min volume x 1 min OHLC4)
# Starts at 945. First 15 min lots of chaos and false signals.

declare lower;
declare once_per_bar;

input chain_width = 5;
input symbol = "SPXW"; #"SPXW"
input premium_extreme = 1000000;

def after945 = SecondsFromTime(945) >= 0;

def vix = close("VIX", AggregationPeriod.DAY)[1];
#def price = round(close(symbol, AggregationPeriod.day)[1],0);
def price = round(close("SPX", AggregationPeriod.day)[1],0);


def move = vix / Sqrt(252) / 100;
def strike_down =  Round (price * (1 - move) / chain_width, 0.01) * chain_width;
def strike_up = Round (price * (1 + move) / chain_width, 0.01) * chain_width;
addlabel(yes, "Strike: " + strike_down + " to " + strike_up, color.cyan);


# get 0DTE expiration
def CurrentYear = GetYear()-2000;
def CurrentMonth = GetMonth();
def CurrentDay = GetDayOfMonth(GetYYYYMMDD());
def DateString = CurrentYear * 10000 + CurrentMonth * 100 + CurrentDay;

def Call_VolumexOHLC = fold strike_c = strike_down to strike_up with v do v +
                if IsNaN(volume("." + symbol +  AsPrice(DateString) + "C" + AsPrice(strike_c))) then 0
                else (volume("." + symbol +  AsPrice(DateString) + "C" + AsPrice(strike_c))
                *ohlc4("." + symbol +  AsPrice(DateString) + "C" + AsPrice(strike_c))
                );

def Put_VolumexOHLC = fold strike_p = strike_down to strike_up with v_p do v_p +
                if IsNaN(volume("." + symbol +  AsPrice(DateString) + "P" + AsPrice(strike_p)))then 0
                else (volume("." + symbol +  AsPrice(DateString) + "P" + AsPrice(strike_p))
                *ohlc4("." + symbol +  AsPrice(DateString) + "P" + AsPrice(strike_p))
                );

plot calls_total = if after945 then Call_VolumexOHLC*100 else 0;
calls_total.SetPaintingStrategy(PaintingStrategy.SQUARED_HISTOGRAM);
calls_total.AssignValueColor(if calls_total > premium_extreme then Color.GREEN else Color.DARK_GRAY);


plot puts_total = if after945 then -1.0 * put_VolumexOHLC*100 else 0;
puts_total.SetPaintingStrategy(PaintingStrategy.SQUARED_HISTOGRAM);
puts_total.AssignValueColor(if puts_total < -1.0 * premium_extreme then Color.RED else Color.DARK_GRAY);

plot highline = premium_extreme;
plot lowline = -1*premium_extreme;
highline.SetDefaultColor(Color.red);
lowline.SetDefaultColor(Color.green);
yup...this doesn't work for /ES or /MES. May be it works only during cash session? after 9:45 AM EST?
 
Last edited by a moderator:
This worked for a day then it stopped working. I made some modifications to the code, but I can't get it to plot.

Can anyone please help? I have Time interval set today and aggregation period = 1 minute.

I get Strike: 432 to 454 - so it's looking alright, but it won't plot anything.

I do see this on my chart though "folding: intger 'from' is expected. NaN"


Code:
# Run on 1 min chart only.  Calculates Premium. ( 1 min volume x 1 min OHLC4)
# Starts at 630.

declare lower;
declare once_per_bar;

input chain_width = 1;
input symbol = "SPY"; #"SPXW"
input premium_extreme = 400000;

def after945 = SecondsFromTime(630) >= 0;

def vix = close("VIX", AggregationPeriod.DAY)[1];
def price = round(close(symbol, AggregationPeriod.day)[1],0);
#def price = round(close("SPX", AggregationPeriod.day)[1],0);


def move = vix / Sqrt(252)*3 / 100;
def strike_down =  Round (price * (1 - move) / chain_width, 0.01) * chain_width;
def strike_up = Round (price * (1 + move) / chain_width, 0.01) * chain_width;
addlabel(yes, "Strike: " + strike_down + " to " + strike_up, color.cyan);


# get 0DTE expiration
def CurrentYear = GetYear()-2000;
def CurrentMonth = GetMonth();
def CurrentDay = GetDayOfMonth(GetYYYYMMDD());
def DateString = CurrentYear * 10000 + CurrentMonth * 100 + CurrentDay;

def Call_VolumexOHLC = fold strike_c = strike_down to strike_up with v do v +
                if IsNaN(volume("." + symbol +  AsPrice(DateString) + "C" + AsPrice(strike_c))) then 0
                else (volume("." + symbol +  AsPrice(DateString) + "C" + AsPrice(strike_c))
                *ohlc4("." + symbol +  AsPrice(DateString) + "C" + AsPrice(strike_c))
                );

def Put_VolumexOHLC = fold strike_p = strike_down to strike_up with v_p do v_p +
                if IsNaN(volume("." + symbol +  AsPrice(DateString) + "P" + AsPrice(strike_p)))then 0
                else (volume("." + symbol +  AsPrice(DateString) + "P" + AsPrice(strike_p))
                *ohlc4("." + symbol +  AsPrice(DateString) + "P" + AsPrice(strike_p))
                );

plot calls_total = if after945 then Call_VolumexOHLC*100 else 0;
calls_total.SetPaintingStrategy(PaintingStrategy.SQUARED_HISTOGRAM);
calls_total.AssignValueColor(if calls_total > premium_extreme then Color.GREEN else Color.DARK_GRAY);


plot puts_total = if after945 then -1.0 * put_VolumexOHLC*100 else 0;
puts_total.SetPaintingStrategy(PaintingStrategy.SQUARED_HISTOGRAM);
puts_total.AssignValueColor(if puts_total < -1.0 * premium_extreme then Color.RED else Color.DARK_GRAY);

plot highline = premium_extreme;
plot lowline = -1*premium_extreme;
highline.SetDefaultColor(Color.red);
lowline.SetDefaultColor(Color.green);
 
Last edited:
This is awesome, can you please share the code?


yup...this doesn't work for /ES or /MES. May be it works only during cash session? after 9:45 AM EST?
Hey. I think it's having issue with holiday hours. Try it on SPY chart and make sure show extended hours is turned off.

This worked for a day then it stopped working. I made some modifications to the code, but I can't get it to plot.

Can anyone please help? I have Time interval set today and aggregation period = 1 minute.

I get Strike: 432 to 454 - so it's looking alright, but it won't plot anything.

I do see this on my chart though "folding: intger 'from' is expected. NaN"


Code:
# Run on 1 min chart only.  Calculates Premium. ( 1 min volume x 1 min OHLC4)
# Starts at 630.

declare lower;
declare once_per_bar;

input chain_width = 1;
input symbol = "SPY"; #"SPXW"
input premium_extreme = 400000;

def after945 = SecondsFromTime(630) >= 0;

def vix = close("VIX", AggregationPeriod.DAY)[1];
def price = round(close(symbol, AggregationPeriod.day)[1],0);
#def price = round(close("SPX", AggregationPeriod.day)[1],0);


def move = vix / Sqrt(252)*3 / 100;
def strike_down =  Round (price * (1 - move) / chain_width, 0.01) * chain_width;
def strike_up = Round (price * (1 + move) / chain_width, 0.01) * chain_width;
addlabel(yes, "Strike: " + strike_down + " to " + strike_up, color.cyan);


# get 0DTE expiration
def CurrentYear = GetYear()-2000;
def CurrentMonth = GetMonth();
def CurrentDay = GetDayOfMonth(GetYYYYMMDD());
def DateString = CurrentYear * 10000 + CurrentMonth * 100 + CurrentDay;

def Call_VolumexOHLC = fold strike_c = strike_down to strike_up with v do v +
                if IsNaN(volume("." + symbol +  AsPrice(DateString) + "C" + AsPrice(strike_c))) then 0
                else (volume("." + symbol +  AsPrice(DateString) + "C" + AsPrice(strike_c))
                *ohlc4("." + symbol +  AsPrice(DateString) + "C" + AsPrice(strike_c))
                );

def Put_VolumexOHLC = fold strike_p = strike_down to strike_up with v_p do v_p +
                if IsNaN(volume("." + symbol +  AsPrice(DateString) + "P" + AsPrice(strike_p)))then 0
                else (volume("." + symbol +  AsPrice(DateString) + "P" + AsPrice(strike_p))
                *ohlc4("." + symbol +  AsPrice(DateString) + "P" + AsPrice(strike_p))
                );

plot calls_total = if after945 then Call_VolumexOHLC*100 else 0;
calls_total.SetPaintingStrategy(PaintingStrategy.SQUARED_HISTOGRAM);
calls_total.AssignValueColor(if calls_total > premium_extreme then Color.GREEN else Color.DARK_GRAY);


plot puts_total = if after945 then -1.0 * put_VolumexOHLC*100 else 0;
puts_total.SetPaintingStrategy(PaintingStrategy.SQUARED_HISTOGRAM);
puts_total.AssignValueColor(if puts_total < -1.0 * premium_extreme then Color.RED else Color.DARK_GRAY);

plot highline = premium_extreme;
plot lowline = -1*premium_extreme;
highline.SetDefaultColor(Color.red);
lowline.SetDefaultColor(Color.green);
Try switching "show extended hours" to off.
 
Thank you for this, great great and interesting indicator.
Any way you can put an alert on it ?

I have had no problems running the different indicators..
 
Last edited by a moderator:
@2187Nick is right. I also use the same concept and run the script on SPY etc. Please see below where I took both scripts above and merged relevant concepts. This should show both put/call volumes.

Rich (BB code):
declare lower;
declare once_per_bar;

input days = 1;
input chain_width = 5;
input threshold = 50;
input symbol = "SPXW";

def vix = close("VIX", AggregationPeriod.DAY)[1];
def SPX_1 = close("SPX", AggregationPeriod.DAY)[1];


def move = vix / Sqrt(252 / days) / 100;
def strike_up = Round (SPX_1 * (1 + move) / chain_width, 0.01) * chain_width;
def strike_down =  Round (SPX_1 * (1 - move) / chain_width, 0.01) * chain_width;

#get total call option volumes around the ATM strikes that are within the expected daily move

# get ATM strike
def ATM_Strike = Round (SPX_1 / chain_width, 0.01) * chain_width;

# get 0DTE expiration
def CurrentYear = GetYear()-2000;
def CurrentMonth = GetMonth();
def CurrentDay = GetDayOfMonth(GetYYYYMMDD());
def DateString = CurrentYear * 10000 + CurrentMonth * 100 + CurrentDay;

#AddLabel(yes, AsPrice(DateString));
#AddLabel(yes, "Spx_close" + strike_up + " " + strike_down  );

#define option series code


def Call_Volume = fold strike_c = ATM_Strike to strike_up with v do v +
                if IsNaN(volume("." + symbol +  AsPrice(DateString) + "C" + AsPrice(strike_c))) then 0
                else if threshold > volume("." + symbol +  AsPrice(DateString) + "C" + AsPrice(strike_c)) then 0
                else volume("." + symbol +  AsPrice(DateString) + "C" + AsPrice(strike_c));

def Put_Volume = fold strike_p = ATM_Strike to strike_up with v_p do v_p +
                if IsNaN(volume("." + symbol +  AsPrice(DateString) + "P" + AsPrice(strike_p))) then 0
                else if threshold > volume("." + symbol +  AsPrice(DateString) + "P" + AsPrice(strike_p)) then 0
                else volume("." + symbol +  AsPrice(DateString) + "P" + AsPrice(strike_p));


plot test = Call_Volume;
test.SetPaintingStrategy(PaintingStrategy.SQUARED_HISTOGRAM);
test.AssignValueColor(if Call_Volume > 1000 then Color.GREEN else Color.DARK_GRAY);

plot test_2 = -1.0 * put_Volume; #show below zero for display purposes
test_2.SetPaintingStrategy(PaintingStrategy.SQUARED_HISTOGRAM);
test_2.AssignValueColor(if put_Volume > -1.0 * 1000 then Color.RED else Color.DARK_GRAY);


i don't see like this i only see the strike on top and also the numbers never change right ? sorry i'm new on this
 

Attachments

  • error.PNG
    error.PNG
    68.5 KB · Views: 328
This stopped working for me today. Was a huge fan, if we can get someone to solve the issue, as well as specify what dates to watch(0dte etc) would be much appreciated. Thank you!
 
Try this:

Code:
# Run on 1 min chart only.  Calculates Premium. ( 1 min volume x 1 min OHLC4)
# Starts at 945. First 15 min lots of chaos and false signals.

declare lower;
declare once_per_bar;

input chain_width = 5;
input symbol = "SPXW"; #"SPXW"
input premium_extreme = 1000000;

def after945 = SecondsFromTime(945) >= 0;

def vix = close("VIX", AggregationPeriod.DAY)[1];
#def price = round(close(symbol, AggregationPeriod.day)[1],0);
def price = round(close("SPX", AggregationPeriod.day)[1],0);


def move = vix / Sqrt(252) / 100;
def strike_down =  Round (price * (1 - move) / chain_width, 0.01) * chain_width;
def strike_up = Round (price * (1 + move) / chain_width, 0.01) * chain_width;
addlabel(yes, "Strike: " + strike_down + " to " + strike_up, color.cyan);


# get 0DTE expiration
def CurrentYear = GetYear()-2000;
def CurrentMonth = GetMonth();
def CurrentDay = GetDayOfMonth(GetYYYYMMDD());
def DateString = CurrentYear * 10000 + CurrentMonth * 100 + CurrentDay;

def Call_VolumexOHLC = fold strike_c = strike_down to strike_up with v do v +
                if IsNaN(volume("." + symbol +  AsPrice(DateString) + "C" + AsPrice(strike_c))) then 0
                else (volume("." + symbol +  AsPrice(DateString) + "C" + AsPrice(strike_c))
                *ohlc4("." + symbol +  AsPrice(DateString) + "C" + AsPrice(strike_c))
                );

def Put_VolumexOHLC = fold strike_p = strike_down to strike_up with v_p do v_p +
                if IsNaN(volume("." + symbol +  AsPrice(DateString) + "P" + AsPrice(strike_p)))then 0
                else (volume("." + symbol +  AsPrice(DateString) + "P" + AsPrice(strike_p))
                *ohlc4("." + symbol +  AsPrice(DateString) + "P" + AsPrice(strike_p))
                );

plot calls_total = if after945 then Call_VolumexOHLC*100 else 0;
calls_total.SetPaintingStrategy(PaintingStrategy.SQUARED_HISTOGRAM);
calls_total.AssignValueColor(if calls_total > premium_extreme then Color.GREEN else Color.DARK_GRAY);


plot puts_total = if after945 then -1.0 * put_VolumexOHLC*100 else 0;
puts_total.SetPaintingStrategy(PaintingStrategy.SQUARED_HISTOGRAM);
puts_total.AssignValueColor(if puts_total < -1.0 * premium_extreme then Color.RED else Color.DARK_GRAY);

plot highline = premium_extreme;
plot lowline = -1*premium_extreme;
highline.SetDefaultColor(Color.red);
lowline.SetDefaultColor(Color.green);

What do you use to rule out bad 'signals'? I've been watching the past few days.. a couple would've worked great but you would've gotten killed on others.
 
Hey. Try setting Time Interval = Today
This does not seem to fix the issue, however the previous script you posted in post #20 appears to be working for me now, thank you!

In my experience with this script so far, it seems like it does very well at spotting reversals on balance days (puts closed near lows/calls closed near highs), so it is a great tool for helping to spot mean reversion trades. definitely need to be careful relying on it during trend days though
 
@2187Nick is right. I also use the same concept and run the script on SPY etc. Please see below where I took both scripts above and merged relevant concepts. This should show both put/call volumes.

Rich (BB code):
declare lower;
declare once_per_bar;

input days = 1;
input chain_width = 5;
input threshold = 50;
input symbol = "SPXW";

def vix = close("VIX", AggregationPeriod.DAY)[1];
def SPX_1 = close("SPX", AggregationPeriod.DAY)[1];


def move = vix / Sqrt(252 / days) / 100;
def strike_up = Round (SPX_1 * (1 + move) / chain_width, 0.01) * chain_width;
def strike_down =  Round (SPX_1 * (1 - move) / chain_width, 0.01) * chain_width;

#get total call option volumes around the ATM strikes that are within the expected daily move

# get ATM strike
def ATM_Strike = Round (SPX_1 / chain_width, 0.01) * chain_width;

# get 0DTE expiration
def CurrentYear = GetYear()-2000;
def CurrentMonth = GetMonth();
def CurrentDay = GetDayOfMonth(GetYYYYMMDD());
def DateString = CurrentYear * 10000 + CurrentMonth * 100 + CurrentDay;

#AddLabel(yes, AsPrice(DateString));
#AddLabel(yes, "Spx_close" + strike_up + " " + strike_down  );

#define option series code


def Call_Volume = fold strike_c = ATM_Strike to strike_up with v do v +
                if IsNaN(volume("." + symbol +  AsPrice(DateString) + "C" + AsPrice(strike_c))) then 0
                else if threshold > volume("." + symbol +  AsPrice(DateString) + "C" + AsPrice(strike_c)) then 0
                else volume("." + symbol +  AsPrice(DateString) + "C" + AsPrice(strike_c));

def Put_Volume = fold strike_p = ATM_Strike to strike_up with v_p do v_p +
                if IsNaN(volume("." + symbol +  AsPrice(DateString) + "P" + AsPrice(strike_p))) then 0
                else if threshold > volume("." + symbol +  AsPrice(DateString) + "P" + AsPrice(strike_p)) then 0
                else volume("." + symbol +  AsPrice(DateString) + "P" + AsPrice(strike_p));


plot test = Call_Volume;
test.SetPaintingStrategy(PaintingStrategy.SQUARED_HISTOGRAM);
test.AssignValueColor(if Call_Volume > 1000 then Color.GREEN else Color.DARK_GRAY);

plot test_2 = -1.0 * put_Volume; #show below zero for display purposes
test_2.SetPaintingStrategy(PaintingStrategy.SQUARED_HISTOGRAM);
test_2.AssignValueColor(if put_Volume > -1.0 * 1000 then Color.RED else Color.DARK_GRAY);


@RajB How do I know what strikes are being considered? Is it possible to display strikes within 1 ATR as a label?

I need to work on top of @2187Nick awesome script above that uses premium, but below is just a teaser of what 1) SPX option volume flow around the ATM strikes (excluding SPY and /ES and above an arbitrary threshold) using 2min bars, combined with 2) a VVIX signal I started playing with would have looked like today. More to come before Friday hopefully.


View attachment 18712
@ChocolateVol May I know if you caught the golden duck yet? Appreciate if you can share the strategy and indicator ...This looks very promising

This is a setup I have been using last couple years. It calculates the premium.

The results are counter intuitive. When we are reaching a peak high intraday there will be large levels of calls bought/sold. When near peak low we see large levels of puts bought/sold.

Around $1 million in premium in SPY is a level I monitor.

Code:
# Run on 1 min chart only.  Calculates Premium. ( 1 min volume x 1 min OHLC4)
# Starts at 945. First 15 min lots of chaos and false signals.

declare lower;
declare once_per_bar;

input chain_width = 1;
input symbol = "SPY"; #"SPXW"
input premium_extreme = 1000000;

def after945 = SecondsFromTime(945) >= 0;

def vix = close("VIX", AggregationPeriod.DAY)[1];
def price = round(close(symbol, AggregationPeriod.day)[1],0);
#def price = round(close("SPX", AggregationPeriod.day)[1],0);


def move = vix / Sqrt(252) / 100;
def strike_down =  Round (price * (1 - move) / chain_width, 0.01) * chain_width;
def strike_up = Round (price * (1 + move) / chain_width, 0.01) * chain_width;
addlabel(yes, "Strike: " + strike_down + " to " + strike_up, color.cyan);


# get 0DTE expiration
def CurrentYear = GetYear()-2000;
def CurrentMonth = GetMonth();
def CurrentDay = GetDayOfMonth(GetYYYYMMDD());
def DateString = CurrentYear * 10000 + CurrentMonth * 100 + CurrentDay;

def Call_VolumexOHLC = fold strike_c = strike_down to strike_up with v do v +
                if IsNaN(volume("." + symbol +  AsPrice(DateString) + "C" + AsPrice(strike_c))) then 0
                else (volume("." + symbol +  AsPrice(DateString) + "C" + AsPrice(strike_c))
                *ohlc4("." + symbol +  AsPrice(DateString) + "C" + AsPrice(strike_c))
                );

def Put_VolumexOHLC = fold strike_p = strike_down to strike_up with v_p do v_p +
                if IsNaN(volume("." + symbol +  AsPrice(DateString) + "P" + AsPrice(strike_p)))then 0
                else (volume("." + symbol +  AsPrice(DateString) + "P" + AsPrice(strike_p))
                *ohlc4("." + symbol +  AsPrice(DateString) + "P" + AsPrice(strike_p))
                );

plot calls_total = if after945 then Call_VolumexOHLC*100 else 0;
calls_total.SetPaintingStrategy(PaintingStrategy.SQUARED_HISTOGRAM);
calls_total.AssignValueColor(if calls_total > premium_extreme then Color.GREEN else Color.DARK_GRAY);


plot puts_total = if after945 then -1.0 * put_VolumexOHLC*100 else 0;
puts_total.SetPaintingStrategy(PaintingStrategy.SQUARED_HISTOGRAM);
puts_total.AssignValueColor(if puts_total < -1.0 * premium_extreme then Color.RED else Color.DARK_GRAY);

plot highline = premium_extreme;
plot lowline = -1*premium_extreme;
highline.SetDefaultColor(Color.red);
lowline.SetDefaultColor(Color.green);

View attachment 18705
@2187Nick may i know how you got those extreme bubbles on the top? I'm getting them on the bottom as the code indicates is in the bottom study.
 
This was my favorite indicator for the few days I was able to use it, but unfortunately it currently doesn't work for me as well. I tried turning off the extended sessions, still no luck. Any ideas how to get this running again? Thanks!
 
@RajB How do I know what strikes are being considered? Is it possible to display strikes within 1 ATR as a label?
You can uncomment this line and it will show the strike range. Please note that I was helping the OP achieve their needs. My script only looks at "half" the strikes as to what OP was asking.
#AddLabel(yes, "Spx_close" + strike_up + " " + strike_down );
 
How can you use this for the qqq´s ? Input symbol cannot be spxw.. obviously.
def price = round(close("SPX", AggregationPeriod.day)[1],0);


- change 3: change change_width to 1 , this will make sure you follow QQQ's option strike prices, which seem to be 1 apart, rather than 5 strike like SPX.
 
def price = round(close("SPX", AggregationPeriod.day)[1],0);


- change 3: change change_width to 1 , this will make sure you follow QQQ's option strike prices, which seem to be 1 apart, rather than 5 strike like SPX.
Width has been changed to 800,000.
 

Attachments

  • qqq.png
    qqq.png
    42.6 KB · Views: 250
For some reason the script didn't work yesterday. I tried setting time interval to Today, turning off the extended hours, etc. I am not sure what causes the script to work on some days and not on hours.

Is there some way to identify what causes this to happen? Also is there the option to cycle between multiple tickers (e.g., SPY, SPX, QQQ, etc) from a drop down menu vs modifying the script manually?

Thank you experts for your input and help, it has been amazing!
 
This is a setup I have been using last couple years. It calculates the premium.

The results are counter intuitive. When we are reaching a peak high intraday there will be large levels of calls bought/sold. When near peak low we see large levels of puts bought/sold.

Around $1 million in premium in SPY is a level I monitor.

Code:
# Run on 1 min chart only.  Calculates Premium. ( 1 min volume x 1 min OHLC4)
# Starts at 945. First 15 min lots of chaos and false signals.

declare lower;
declare once_per_bar;

input chain_width = 1;
input symbol = "SPY"; #"SPXW"
input premium_extreme = 1000000;

def after945 = SecondsFromTime(945) >= 0;

def vix = close("VIX", AggregationPeriod.DAY)[1];
def price = round(close(symbol, AggregationPeriod.day)[1],0);
#def price = round(close("SPX", AggregationPeriod.day)[1],0);


def move = vix / Sqrt(252) / 100;
def strike_down =  Round (price * (1 - move) / chain_width, 0.01) * chain_width;
def strike_up = Round (price * (1 + move) / chain_width, 0.01) * chain_width;
addlabel(yes, "Strike: " + strike_down + " to " + strike_up, color.cyan);


# get 0DTE expiration
def CurrentYear = GetYear()-2000;
def CurrentMonth = GetMonth();
def CurrentDay = GetDayOfMonth(GetYYYYMMDD());
def DateString = CurrentYear * 10000 + CurrentMonth * 100 + CurrentDay;

def Call_VolumexOHLC = fold strike_c = strike_down to strike_up with v do v +
                if IsNaN(volume("." + symbol +  AsPrice(DateString) + "C" + AsPrice(strike_c))) then 0
                else (volume("." + symbol +  AsPrice(DateString) + "C" + AsPrice(strike_c))
                *ohlc4("." + symbol +  AsPrice(DateString) + "C" + AsPrice(strike_c))
                );

def Put_VolumexOHLC = fold strike_p = strike_down to strike_up with v_p do v_p +
                if IsNaN(volume("." + symbol +  AsPrice(DateString) + "P" + AsPrice(strike_p)))then 0
                else (volume("." + symbol +  AsPrice(DateString) + "P" + AsPrice(strike_p))
                *ohlc4("." + symbol +  AsPrice(DateString) + "P" + AsPrice(strike_p))
                );

plot calls_total = if after945 then Call_VolumexOHLC*100 else 0;
calls_total.SetPaintingStrategy(PaintingStrategy.SQUARED_HISTOGRAM);
calls_total.AssignValueColor(if calls_total > premium_extreme then Color.GREEN else Color.DARK_GRAY);


plot puts_total = if after945 then -1.0 * put_VolumexOHLC*100 else 0;
puts_total.SetPaintingStrategy(PaintingStrategy.SQUARED_HISTOGRAM);
puts_total.AssignValueColor(if puts_total < -1.0 * premium_extreme then Color.RED else Color.DARK_GRAY);

plot highline = premium_extreme;
plot lowline = -1*premium_extreme;
highline.SetDefaultColor(Color.red);
lowline.SetDefaultColor(Color.green);

View attachment 18705
 

Attachments

  • spy.png
    spy.png
    37 KB · Views: 238

Join useThinkScript to post your question to a community of 21,000+ developers and traders.

Similar threads

Not the exact question you're looking for?

Start a new thread and receive assistance from our community.

87k+ Posts
344 Online
Create Post

Similar threads

Similar threads

The Market Trading Game Changer

Join 2,500+ subscribers inside the useThinkScript VIP Membership Club
  • Exclusive indicators
  • Proven strategies & setups
  • Private Discord community
  • ‘Buy The Dip’ signal alerts
  • Exclusive members-only content
  • Add-ons and resources
  • 1 full year of unlimited support

Frequently Asked Questions

What is useThinkScript?

useThinkScript is the #1 community of stock market investors using indicators and other tools to power their trading strategies. Traders of all skill levels use our forums to learn about scripting and indicators, help each other, and discover new ways to gain an edge in the markets.

How do I get started?

We get it. Our forum can be intimidating, if not overwhelming. With thousands of topics, tens of thousands of posts, our community has created an incredibly deep knowledge base for stock traders. No one can ever exhaust every resource provided on our site.

If you are new, or just looking for guidance, here are some helpful links to get you started.

What are the benefits of VIP Membership?
VIP members get exclusive access to these proven and tested premium indicators: Buy the Dip, Advanced Market Moves 2.0, Take Profit, and Volatility Trading Range. In addition, VIP members get access to over 50 VIP-only custom indicators, add-ons, and strategies, private VIP-only forums, private Discord channel to discuss trades and strategies in real-time, customer support, trade alerts, and much more. Learn all about VIP membership here.
How can I access the premium indicators?
To access the premium indicators, which are plug and play ready, sign up for VIP membership here.
Back
Top