
petergluis
Active member
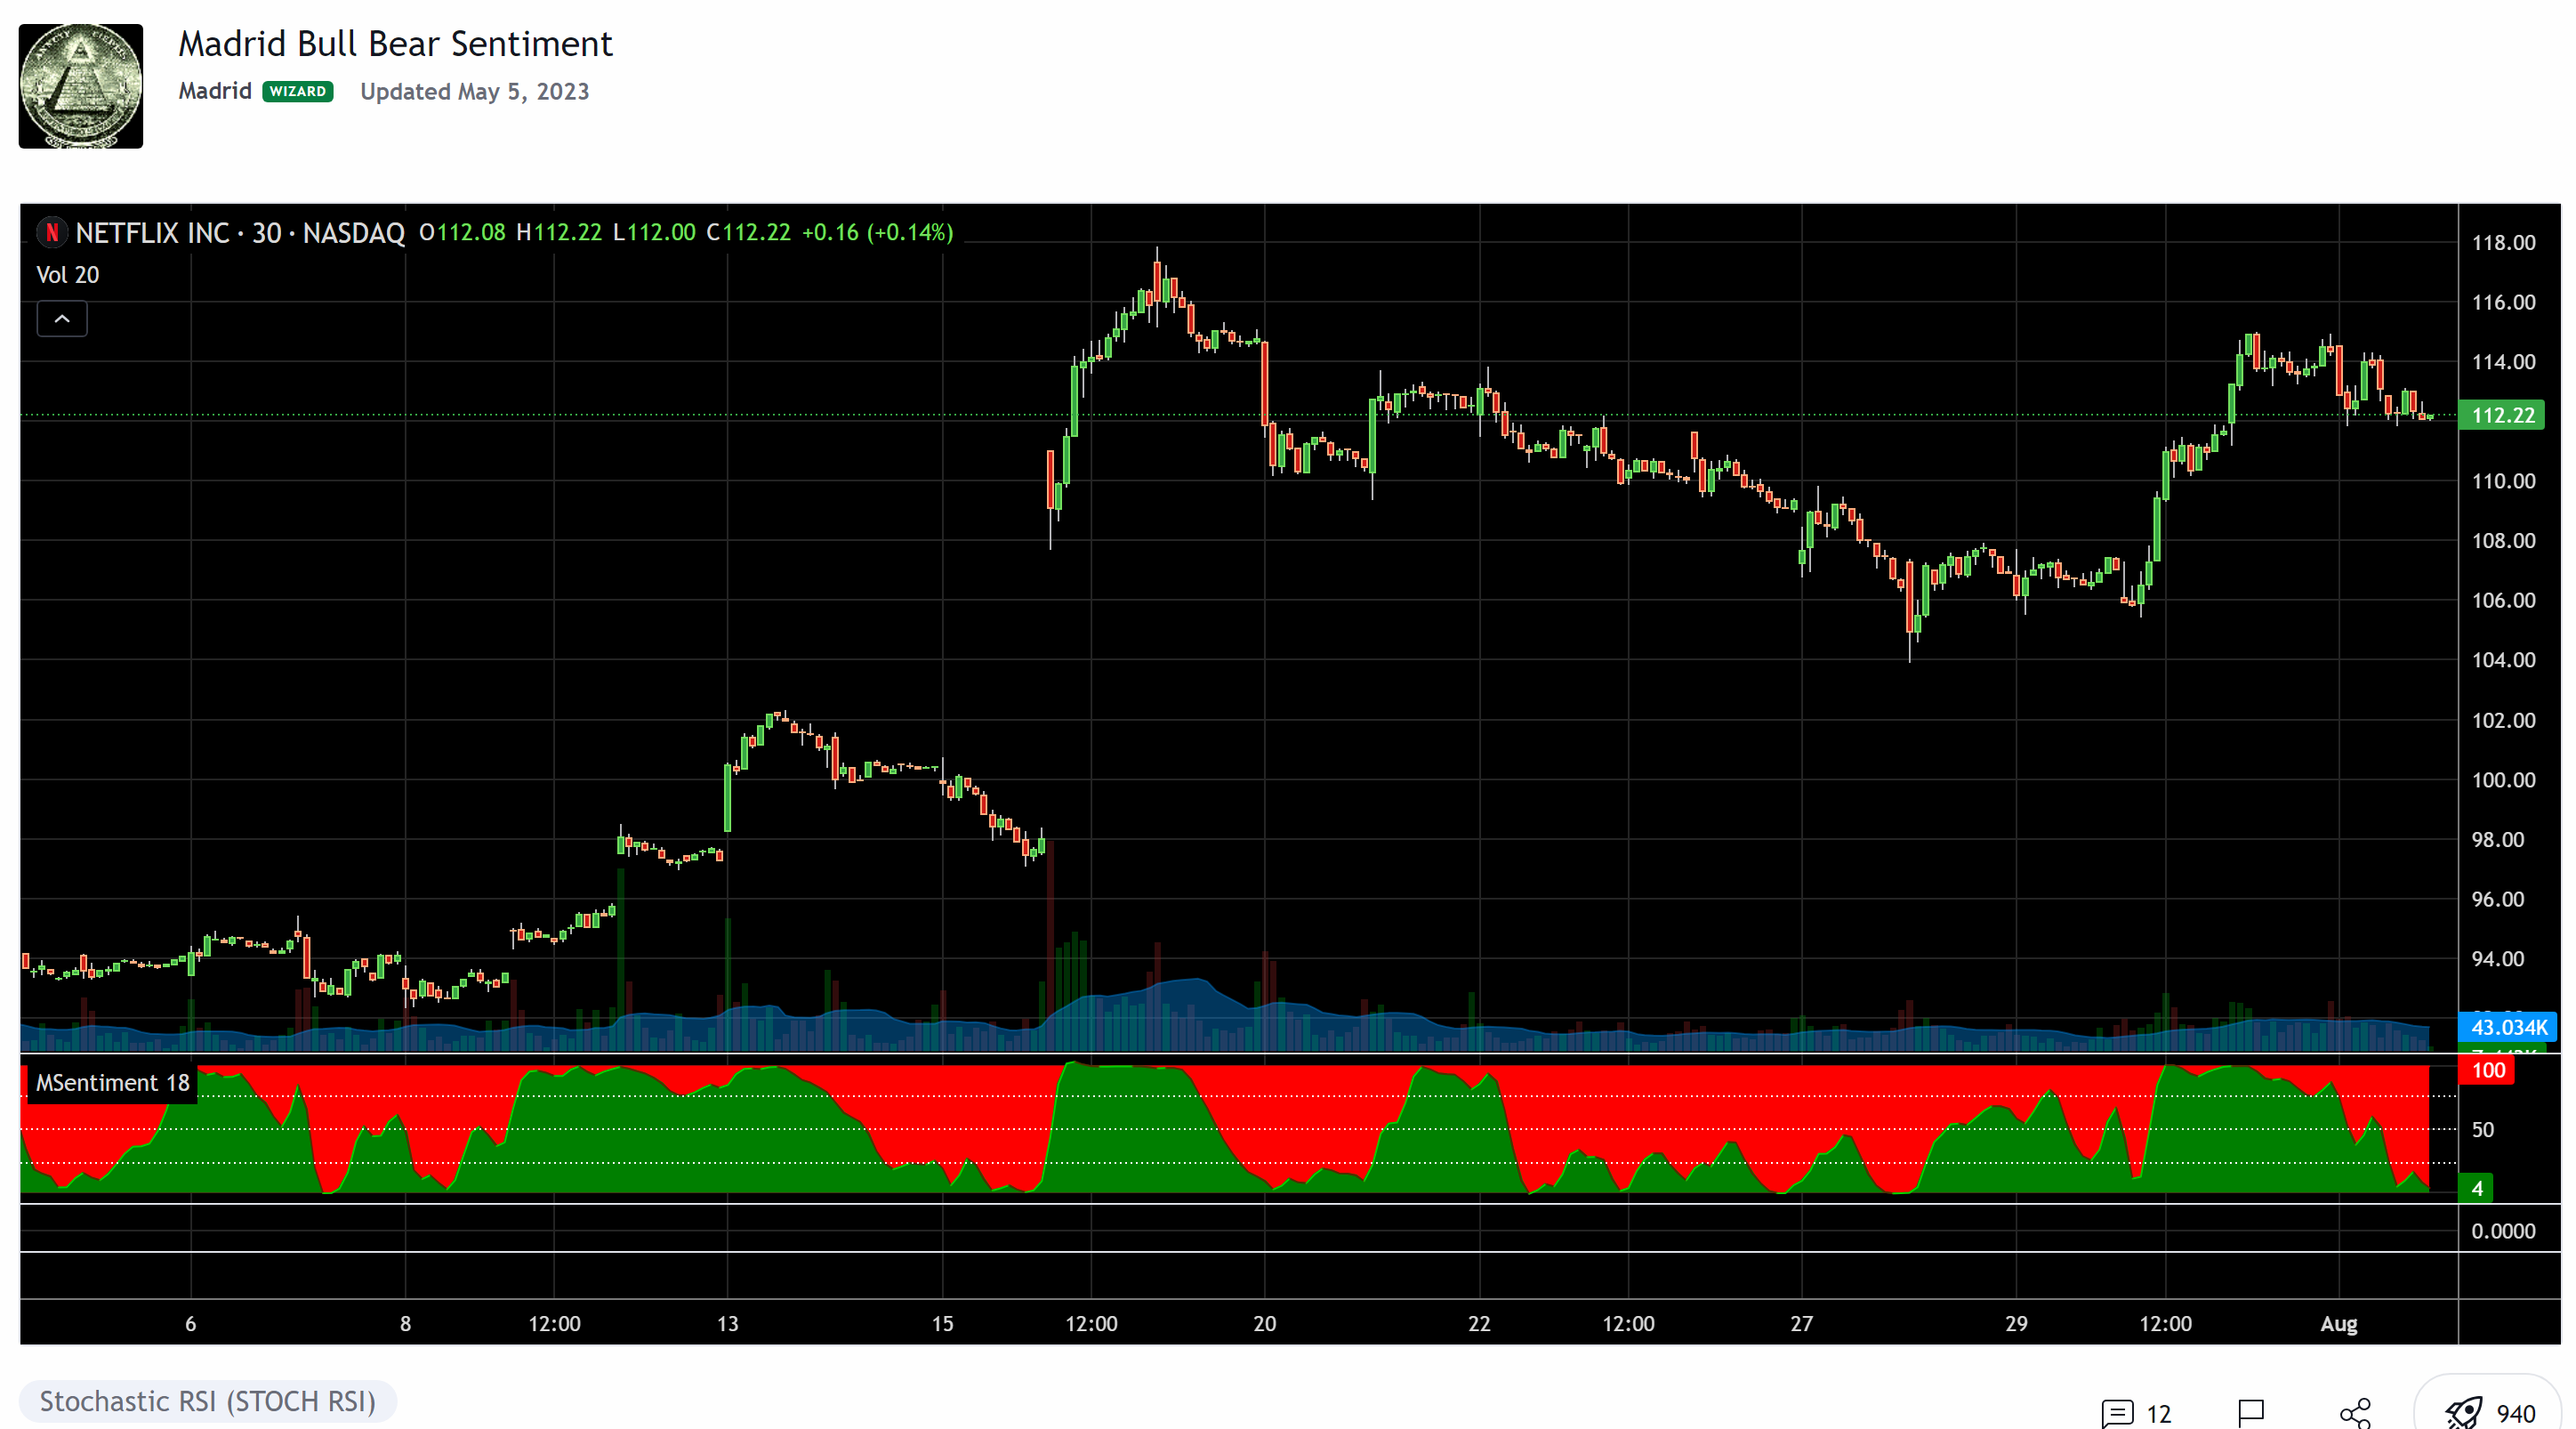
Madrid Bull Bear Sentiment provides the overall bull bear sentiment.
This indicator displays the distance in percentage between the highest and lowest points in a given period of time, compares them, and determines which side has more dominance.
It will be nice to have ThinkorSwim version. Thank you very much for your help.
Here is the link of the indicator with Pinescript.
https://www.tradingview.com/script/f9OdIHQf-Madrid-Bull-Bear-Sentiment/
Last edited by a moderator: