Inventory Retracement Bar (IRB) Indicator for ThinkorSwim

BenTen

Administrative
Staff member
Staff
VIP
Lifetime
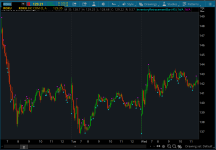
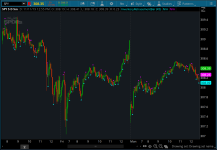
Claims by Rob Hoffman. Developed and used to win trading competitions around the world, the Hoffman Inventory Retracement Trade is quickly becoming one of the most popular ways to identify where short-term counter trend institutional inventory has subsided and when it’s time to re-enter into a trade’s original trend direction.

dfwE2K0.png

UfS4X07.png


thinkScript Code

Code:
# Inventory Retracement Bar
# Assembled by BenTen at useThinkScript.com
# Converted from https://www.tradingview.com/script/VNByUGpE-Rob-Hoffman-s-Inventory-Retracement-Bar-by-UCSgears/

input z = 45;

# Candle Range
def a = absValue(high - low);
# Candle Body
def b = absValue(close - open);
# Percent to Decimal
def c = z / 100;

# Range Verification
def rv = b < c * a;

# Price Level for Retracement
def x = low + (c * a);
def y = high - (c * a);

def sl = rv == 1 and high > y and close<y and open<y;
def ss = rv == 1 and low<x and close> x and open> x;

def li = if sl then y else if ss then x else (x+y)/2;

#assignPriceColor(if sl then color.red else if ss then color.green else color.white);

plot green = if ss then(low - 2 * tickSize()) else Double.NAN;;
green.SetPaintingStrategy(PaintingStrategy.TRIANGLES);

plot red = if sl then(high + 2 * tickSize()) else Double.NAN;
red.SetPaintingStrategy(PaintingStrategy.SQUARES);
red.SetDefaultColor(Color.magenta);

Resources to learn more about the IRB:
 

Attachments

  • dfwE2K0.png
    dfwE2K0.png
    77.8 KB · Views: 166
  • UfS4X07.png
    UfS4X07.png
    89.5 KB · Views: 164

Join useThinkScript to post your question to a community of 21,000+ developers and traders.

@Ben Ten - Thanks for posting looking at this tonight - shows potential. I made a few changes and will test over the next few days. If the changes add to the potential for profits will post.
 
what does the triangles and squares mean?
if in an uptrend, and there's a triangle below a DOWN bar, means only a short term countertrend, which will soon return back to it's uptrend?
if in a downtrend, and there's a square on top an UP bar, means only a short term countertrend, which will soon return back to it's downtrend?
 
Last edited:
@Playstation Magenta Square on top of the candle = bearish candle. CYAN arrow at the bottom of the candle = bullish candle. Without reading too much into the IRB resources, I believe this indicator was designed to help you with entry. Similar to what you just talked about.
 
If you read the documentation given you'll see that UCGears did not get it quite right, mostly because the body location, size, and direction doesn't matter. Additionally, Rob also uses Inverse IRBs (talked about in other webinars) and explicitly states that up or down bar doesn't matter, but prefers to define it within a trend. I've reconfigured and added a regime filter. I also double checked this against charts he shared in the most recent wealth365 event- it's not perfect, but it never will be due to a variety of reasons, namely how he defines trend. In limited backtesting this plus a simple atr trailing stop or MA stop looks like it gets some nice swings

Code:
# Inventory Retracement Bar and inverse IRB

input z = 45;
input len = 20;

def r = absValue(high - low);
def b = absValue(close - open);
def c = z / 100;

def IRB = min(close,open) > ((r*c) + low);
def revIRB = max(close,open) < high - ((r*c));
def regime = movingaverage(averageType.EXPONENTIAL,close,len);

plot IRBUpTrend = if IRB and close > regime then low - ticksize() * 2 else double.nan;
IRBUpTrend.SetPaintingStrategy(PaintingStrategy.TRIANGLES);
IRBUpTrend.setDefaultColor(color.green);
IRBUpTrend.setLineWeight(3);

plot InvIRBUpTrend = if revIRB and close > regime then low - ticksize() * 2 else double.nan;
InvIRBUpTrend.SetPaintingStrategy(PaintingStrategy.squares);
InvIRBUpTrend.setdefaultColor(color.green);
InvIRBUpTrend.setLineWeight(3);

plot IRBDownTrend = if IRB and close < regime then high + ticksize() * 2 else double.nan;
IRBDownTrend.SetPaintingStrategy(PaintingStrategy.TRIANGLES);
IRBDownTrend.setDefaultColor(color.magenta);
IRBDownTrend.setLineWeight(3);

plot InvIRBDownTrend =if revIRB and close < regime then high + ticksize() * 2 else double.nan;
InvIRBDownTrend.SetPaintingStrategy(PaintingStrategy.squares);
InvIRBDownTrend.setdefaultColor(color.magenta);
InvIRBDownTrend.setLineWeight(3);
 
@the_yeti this is super helpful thank you for sharing and expanding on the methodology. it's always nice to have another deriviative that can be use as a proxy for trend. welcome to the forum!
 
I have modified the code further to only show signals when there is a buy/sell long/short signal per my understanding of Rob Hoffman's rules.
Code:
# Inventory Retracement Bar
# Originally Assembled by BenTen at useThinkScript.com
# Converted from https://www.tradingview.com/script/VNByUGpE-Rob-Hoffman-s-Inventory-Retracement-Bar-by-UCSgears/
# Inventory Retracement Bar and inverse IRB as modified by the_yeti
# Modified further to show only where there is a buy/sell signal by theLEMband


input z = 45;
input len = 20;

def r = AbsValue(high - low);
def b = AbsValue(close - open);
def c = z / 100;

def IRB = Min(close, open) > ((r * c) + low);
def revIRB = Max(close, open) < high - ((r * c));
def regime = MovingAverage(AverageType.EXPONENTIAL, close, len);

plot IRBUpTrend = if IRB[1] and close > close[1] and close[1] > open[1] and close > regime[1] then low - TickSize() * 2 else Double.NaN;
IRBUpTrend.SetPaintingStrategy(PaintingStrategy.TRIANGLES);
IRBUpTrend.SetDefaultColor(Color.GREEN);
IRBUpTrend.SetLineWeight(3);

plot InvIRBUpTrend = if revIRB[1] and close > close[1] and close[1] > open[1] and close > regime[1] then low - TickSize() * 2 else Double.NaN;
InvIRBUpTrend.SetPaintingStrategy(PaintingStrategy.SQUARES);
InvIRBUpTrend.SetDefaultColor(Color.GREEN);
InvIRBUpTrend.setLineWeight(3);

plot IRBDownTrend = if IRB[1] and close < close[1] and close[1] < open[1] and close < regime[1] then high + TickSize() * 2 else Double.NaN;
#plot IRBDownTrend = if IRB and close < regime then high + TickSize() * 2 else Double.NaN;
IRBDownTrend.SetPaintingStrategy(PaintingStrategy.TRIANGLES);
IRBDownTrend.SetDefaultColor(Color.MAGENTA);
IRBDownTrend.SetLineWeight(3);

plot InvIRBDownTrend = if revIRB[1] and close < close[1] and close[1] < open[1] and close < regime[1] then high + TickSize() * 2 else Double.NaN;
InvIRBDownTrend.SetPaintingStrategy(PaintingStrategy.SQUARES);
InvIRBDownTrend.SetDefaultColor(Color.MAGENTA);
InvIRBDownTrend.SetLineWeight(3);
 
Last edited:
I have modified the code further to only show signals when there is a buy/sell long/short signal per my understanding of Rob Hoffman's rules.
Code:
# Inventory Retracement Bar
# Originally Assembled by BenTen at useThinkScript.com
# Converted from https://www.tradingview.com/script/VNByUGpE-Rob-Hoffman-s-Inventory-Retracement-Bar-by-UCSgears/
# Inventory Retracement Bar and inverse IRB as modified by the_yeti
# Modified further to show only where there is a buy/sell signal by theLEMband


input z = 45;
input len = 20;

def r = AbsValue(high - low);
def b = AbsValue(close - open);
def c = z / 100;

def IRB = Min(close, open) > ((r * c) + low);
def revIRB = Max(close, open) < high - ((r * c));
def regime = MovingAverage(AverageType.EXPONENTIAL, close, len);

plot IRBUpTrend = if IRB[1] and close > close[1] and close[1] > open[1] and close > regime[1] then low - TickSize() * 2 else Double.NaN;
IRBUpTrend.SetPaintingStrategy(PaintingStrategy.TRIANGLES);
IRBUpTrend.SetDefaultColor(Color.GREEN);
IRBUpTrend.SetLineWeight(3);

plot InvIRBUpTrend = if revIRB[1] and close > close[1] and close[1] > open[1] and close > regime[1] then low - TickSize() * 2 else Double.NaN;
InvIRBUpTrend.SetPaintingStrategy(PaintingStrategy.SQUARES);
InvIRBUpTrend.SetDefaultColor(Color.GREEN);
InvIRBUpTrend.setLineWeight(3);

plot IRBDownTrend = if IRB[1] and close < close[1] and close[1] < open[1] and close < regime[1] then high + TickSize() * 2 else Double.NaN;
#plot IRBDownTrend = if IRB and close < regime then high + TickSize() * 2 else Double.NaN;
IRBDownTrend.SetPaintingStrategy(PaintingStrategy.TRIANGLES);
IRBDownTrend.SetDefaultColor(Color.MAGENTA);
IRBDownTrend.SetLineWeight(3);

plot InvIRBDownTrend = if revIRB[1] and close < close[1] and close[1] < open[1] and close < regime[1] then high + TickSize() * 2 else Double.NaN;
InvIRBDownTrend.SetPaintingStrategy(PaintingStrategy.SQUARES);
InvIRBDownTrend.SetDefaultColor(Color.MAGENTA);
InvIRBDownTrend.SetLineWeight(3);
Ok so the rule would be:

green triangle above the bar = buy?
 
I have modified the code further to only show signals when there is a buy/sell long/short signal per my understanding of Rob Hoffman's rules.
Code:
# Inventory Retracement Bar
# Originally Assembled by BenTen at useThinkScript.com
# Converted from https://www.tradingview.com/script/VNByUGpE-Rob-Hoffman-s-Inventory-Retracement-Bar-by-UCSgears/
# Inventory Retracement Bar and inverse IRB as modified by the_yeti
# Modified further to show only where there is a buy/sell signal by theLEMband


input z = 45;
input len = 20;

def r = AbsValue(high - low);
def b = AbsValue(close - open);
def c = z / 100;

def IRB = Min(close, open) > ((r * c) + low);
def revIRB = Max(close, open) < high - ((r * c));
def regime = MovingAverage(AverageType.EXPONENTIAL, close, len);

plot IRBUpTrend = if IRB[1] and close > close[1] and close[1] > open[1] and close > regime[1] then low - TickSize() * 2 else Double.NaN;
IRBUpTrend.SetPaintingStrategy(PaintingStrategy.TRIANGLES);
IRBUpTrend.SetDefaultColor(Color.GREEN);
IRBUpTrend.SetLineWeight(3);

plot InvIRBUpTrend = if revIRB[1] and close > close[1] and close[1] > open[1] and close > regime[1] then low - TickSize() * 2 else Double.NaN;
InvIRBUpTrend.SetPaintingStrategy(PaintingStrategy.SQUARES);
InvIRBUpTrend.SetDefaultColor(Color.GREEN);
InvIRBUpTrend.setLineWeight(3);

plot IRBDownTrend = if IRB[1] and close < close[1] and close[1] < open[1] and close < regime[1] then high + TickSize() * 2 else Double.NaN;
#plot IRBDownTrend = if IRB and close < regime then high + TickSize() * 2 else Double.NaN;
IRBDownTrend.SetPaintingStrategy(PaintingStrategy.TRIANGLES);
IRBDownTrend.SetDefaultColor(Color.MAGENTA);
IRBDownTrend.SetLineWeight(3);

plot InvIRBDownTrend = if revIRB[1] and close < close[1] and close[1] < open[1] and close < regime[1] then high + TickSize() * 2 else Double.NaN;
InvIRBDownTrend.SetPaintingStrategy(PaintingStrategy.SQUARES);
InvIRBDownTrend.SetDefaultColor(Color.MAGENTA);
InvIRBDownTrend.SetLineWeight(3);
Thanks for posting this. Have you made any other updates to this or is this "final"
again.. massive thank you.
 
dfwE2K0.png

UfS4X07.png


thinkScript Code

Code:
# Inventory Retracement Bar
# Assembled by BenTen at useThinkScript.com
# Converted from https://www.tradingview.com/script/VNByUGpE-Rob-Hoffman-s-Inventory-Retracement-Bar-by-UCSgears/

input z = 45;

# Candle Range
def a = absValue(high - low);
# Candle Body
def b = absValue(close - open);
# Percent to Decimal
def c = z / 100;

# Range Verification
def rv = b < c * a;

# Price Level for Retracement
def x = low + (c * a);
def y = high - (c * a);

def sl = rv == 1 and high > y and close<y and open<y;
def ss = rv == 1 and low<x and close> x and open> x;

def li = if sl then y else if ss then x else (x+y)/2;

#assignPriceColor(if sl then color.red else if ss then color.green else color.white);

plot green = if ss then(low - 2 * tickSize()) else Double.NAN;;
green.SetPaintingStrategy(PaintingStrategy.TRIANGLES);

plot red = if sl then(high + 2 * tickSize()) else Double.NAN;
red.SetPaintingStrategy(PaintingStrategy.SQUARES);
red.SetDefaultColor(Color.magenta);

Resources to learn more about the IRB:
Anyone know how to make this a scan?
 
Thanks for posting this. Have you made any other updates to this or is this "final"
again.. massive thank you.
That was the intent. However, I subscribe to Rob Hoffman's Wealthcharts which gives you the option to insert the IRB and reverse IRB symbols automatically, and they do not line up with this script. I don't know why, but I believe it has to do with how he measures trend.
 
I have modified the code further to only show signals when there is a buy/sell long/short signal per my understanding of Rob Hoffman's rules.
Code:
# Inventory Retracement Bar
# Originally Assembled by BenTen at useThinkScript.com
# Converted from https://www.tradingview.com/script/VNByUGpE-Rob-Hoffman-s-Inventory-Retracement-Bar-by-UCSgears/
# Inventory Retracement Bar and inverse IRB as modified by the_yeti
# Modified further to show only where there is a buy/sell signal by theLEMband


input z = 45;
input len = 20;

def r = AbsValue(high - low);
def b = AbsValue(close - open);
def c = z / 100;

def IRB = Min(close, open) > ((r * c) + low);
def revIRB = Max(close, open) < high - ((r * c));
def regime = MovingAverage(AverageType.EXPONENTIAL, close, len);

plot IRBUpTrend = if IRB[1] and close > close[1] and close[1] > open[1] and close > regime[1] then low - TickSize() * 2 else Double.NaN;
IRBUpTrend.SetPaintingStrategy(PaintingStrategy.TRIANGLES);
IRBUpTrend.SetDefaultColor(Color.GREEN);
IRBUpTrend.SetLineWeight(3);

plot InvIRBUpTrend = if revIRB[1] and close > close[1] and close[1] > open[1] and close > regime[1] then low - TickSize() * 2 else Double.NaN;
InvIRBUpTrend.SetPaintingStrategy(PaintingStrategy.SQUARES);
InvIRBUpTrend.SetDefaultColor(Color.GREEN);
InvIRBUpTrend.setLineWeight(3);

plot IRBDownTrend = if IRB[1] and close < close[1] and close[1] < open[1] and close < regime[1] then high + TickSize() * 2 else Double.NaN;
#plot IRBDownTrend = if IRB and close < regime then high + TickSize() * 2 else Double.NaN;
IRBDownTrend.SetPaintingStrategy(PaintingStrategy.TRIANGLES);
IRBDownTrend.SetDefaultColor(Color.MAGENTA);
IRBDownTrend.SetLineWeight(3);

plot InvIRBDownTrend = if revIRB[1] and close < close[1] and close[1] < open[1] and close < regime[1] then high + TickSize() * 2 else Double.NaN;
InvIRBDownTrend.SetPaintingStrategy(PaintingStrategy.SQUARES);
InvIRBDownTrend.SetDefaultColor(Color.MAGENTA);
InvIRBDownTrend.SetLineWeight(3);
Im confused, what are the rules for using this study???
 
Im confused, what are the rules for using this study???
You would have to research Rob Hoffman IRB. However, please read my previous post. Since the study does not correctly emulate Rob Hoffman's work, there is no way to use his rules.
 
You would have to research Rob Hoffman IRB. However, please read my previous post. Since the study does not correctly emulate Rob Hoffman's work, there is no way to use his rules.
Ive listened to a few of his vids. With regards to your version of the study whats the diff btwn squares and triangles? What do they mean?

Lets assume a stock is in upward trend @ 45°, like Hoffman suggests, what is one looking for on your version that indicates long entry!?
 
Ive listened to a few of his vids. With regards to your version of the study whats the diff btwn squares and triangles? What do they mean?

Lets assume a stock is in upward trend @ 45°, like Hoffman suggests, what is one looking for on your version that indicates long entry!?
Triangles are Inventory Retracement Bars and Squares are Reverse Inventory Retracement Bars, or vice-versa, it doesn't really matter because you would enter long (or re-enter) when the trend is up and either indicator fires off. I think he sets the stop at the bottom of the bar with the signal. Opposite for short. I don't know what his strategy is for profit taking.
 
Triangles are Inventory Retracement Bars and Squares are Reverse Inventory Retracement Bars, or vice-versa, it doesn't really matter because you would enter long (or re-enter) when the trend is up and either indicator fires off. I think he sets the stop at the bottom of the bar with the signal. Opposite for short. I don't know what his strategy is for profit taking.
Ok... his entry is "one tick one pip one cent" above the bar for longs(below for shorts), and as I understand it he uses a 20 EMA for the stop
I dont know the whole story on the reverse IRB
 
Yes. I believe that I modified the original script so that if would fire when the "one tick, one pip, one cent" occurred. So you would go as soon as you saw the indicator. Probably I should have used high/low as comparison triggers for the indicators instead of comparing close to previous bar. As currently written, the indicator could fire then disappear again before the bar closed. Maybe that is the difference in why this indicator doesn't match his.
 
I modified it further as I mentioned above.

Ruby:
# Inventory Retracement Bar
# Originally Assembled by BenTen at useThinkScript.com
# Converted from https://www.tradingview.com/script/VNByUGpE-Rob-Hoffman-s-Inventory-Retracement-Bar-by-UCSgears/
# Inventory Retracement Bar and inverse IRB as modified by the_yeti
# Modified further to show only buy/sell signals by theLEMband


input z = 45;

def r = AbsValue(high - low);
def b = AbsValue(close - open);
def c = z / 100;

def IRB = Min(close, open) > ((r * c) + low);
def revIRB = Max(close, open) < high - ((r * c));

plot IRBUpTrend = if IRB[1] and high > close[1] and close[1] > open[1] then low - TickSize() * 2 else Double.NaN;
IRBUpTrend.SetPaintingStrategy(PaintingStrategy.TRIANGLES);
IRBUpTrend.SetDefaultColor(Color.GREEN);
IRBUpTrend.SetLineWeight(3);

plot InvIRBUpTrend = if revIRB[1] and high > close[1] and close[1] > open[1] then low - TickSize() * 2 else Double.NaN;
InvIRBUpTrend.SetPaintingStrategy(PaintingStrategy.SQUARES);
InvIRBUpTrend.SetDefaultColor(Color.GREEN);
InvIRBUpTrend.setLineWeight(3);

plot IRBDownTrend = if IRB[1] and low < close[1] and close[1] < open[1] then high + TickSize() * 2 else Double.NaN;
#plot IRBDownTrend = if IRB and close < regime then high + TickSize() * 2 else Double.NaN;
IRBDownTrend.SetPaintingStrategy(PaintingStrategy.TRIANGLES);
IRBDownTrend.SetDefaultColor(Color.MAGENTA);
IRBDownTrend.SetLineWeight(3);

plot InvIRBDownTrend = if revIRB[1] and low < close[1] and close[1] < open[1] then high + TickSize() * 2 else Double.NaN;
InvIRBDownTrend.SetPaintingStrategy(PaintingStrategy.SQUARES);
InvIRBDownTrend.SetDefaultColor(Color.MAGENTA);
InvIRBDownTrend.SetLineWeight(3);
 
Hi all, any chance someone might be able to review my code. I'm trying to turn this into an extended horizontal S/R type of line but it's not working properly. any guidance would be great. if i can get this working, i may be able to add some aggregation to it. thanks.


input LookbackPeriod = 50;
input z = 45;

#--------------------------------------------------------------
def a = absValue(high - low);
# Candle Body
def b = absValue(close - open);
# Percent to Decimal
def c = z / 100;

# Range Verification
def rv = b < c * a;

# Price Level for Retracement
def x = low + (c * a);
def y = high - (c * a);
#--------------------------------------------------------------
def marketLow1 = if x < x[-LookbackPeriod] then x else x[-LookbackPeriod];
def _markedLow1 = rv == 1 and low<marketLow1 and close> marketLow1 and open> marketLow1;

rec _lastMarkedLow1 = CompoundValue(1, if IsNaN(_markedLow1) then _lastMarkedLow1[1] else if _markedLow1 then x else _lastMarkedLow1[1], x);

#--------------------------------------------------------------
def marketHigh1 = if y > y[-LookbackPeriod] then y else y[-LookbackPeriod];
def _markedHigh1 = rv == 1 and high > y and close<y and open<y;
# high == marketHigh1;

rec _lastMarkedHigh1 = CompoundValue(1, if IsNaN(_markedHigh1) then _lastMarkedHigh1[1] else if _markedHigh1 then y else _lastMarkedHigh1[1], y);
#--------------------------------------------------------------

plot red = if _lastMarkedLow1 then(LOW - 2 * tickSize() ) else Double.NAN;
red.SetPaintingStrategy(PaintingStrategy.HORIZONTAL);
red.SetDefaultColor(Color.magenta);
plot green = if _lastMarkedHigh1 then(HIGH + 2 * tickSize() ) else Double.NAN;;
green.SetPaintingStrategy(PaintingStrategy.HORIZONTAL);


#--------------------------------------------------------------
 

Similar threads

Not the exact question you're looking for?

Start a new thread and receive assistance from our community.

87k+ Posts
501 Online
Create Post

Similar threads

Similar threads

The Market Trading Game Changer

Join 2,500+ subscribers inside the useThinkScript VIP Membership Club
  • Exclusive indicators
  • Proven strategies & setups
  • Private Discord community
  • ‘Buy The Dip’ signal alerts
  • Exclusive members-only content
  • Add-ons and resources
  • 1 full year of unlimited support

Frequently Asked Questions

What is useThinkScript?

useThinkScript is the #1 community of stock market investors using indicators and other tools to power their trading strategies. Traders of all skill levels use our forums to learn about scripting and indicators, help each other, and discover new ways to gain an edge in the markets.

How do I get started?

We get it. Our forum can be intimidating, if not overwhelming. With thousands of topics, tens of thousands of posts, our community has created an incredibly deep knowledge base for stock traders. No one can ever exhaust every resource provided on our site.

If you are new, or just looking for guidance, here are some helpful links to get you started.

What are the benefits of VIP Membership?
VIP members get exclusive access to these proven and tested premium indicators: Buy the Dip, Advanced Market Moves 2.0, Take Profit, and Volatility Trading Range. In addition, VIP members get access to over 50 VIP-only custom indicators, add-ons, and strategies, private VIP-only forums, private Discord channel to discuss trades and strategies in real-time, customer support, trade alerts, and much more. Learn all about VIP membership here.
How can I access the premium indicators?
To access the premium indicators, which are plug and play ready, sign up for VIP membership here.
Back
Top