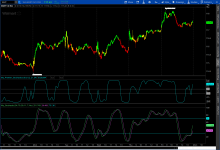
Premier Stochastic Oscillator

manishji

New member
any help getting pso... its calculated as below.

%K = 100 X [(C – Ln) / (Hn – Ln)]

Where

  • C = the most recent closing price
  • n = the lookback period
  • Ln = the low of the n previous price bars
  • Hn = the highest price during the same n period

The premier stochastic oscillator normalizes the standard stochastic oscillator by applying a five-period double exponential smoothing average of the %K value, resulting in a symmetric scale of 1 to -1. The PSO calculation, then, is:

PSO = (exponential value (S) – 1) / (exponential value (S) + 1)

Where

  • S = 5-period double smoothed exponential EMA ((%K – 50) * .1)
  • %K = 8-period stochastic oscillator
 

Join useThinkScript to post your question to a community of 21,000+ developers and traders.

This one ?

Code:
# // ========================== 
# // PREMIER STOCHASTIC 
# // Indicator 
# // ========================== 
# 
# Technical Analysis of Stocks & Commodities 
# August, 2008 
# Premier Stochastic Oscillator by Lee Leibfarth 
# pp 30 - 36 
# ported by R Houser 
# 
declare lower; 


# inputs: 
input Line1 = 0.9;
input Line2 = 0.2;
input StochLength = 8;
input Period = 25; 


# variables: 
# oFastK(0), 
# oFastD(0), 
# oSlowK(0), 
# oSlowD(0), 
# Length(0), 
# NormStoch(0), 
# SmoothStoch(0), 
# Premier(0); 


# Value1 = Stochastic( h, l, c, StochLength, 1, 3, 1, oFastK, oFastD, oSlowK, oSlowD); 
def oFastK = 100 * ( ( close - Lowest( low, StochLength ) ) / ( Highest( high, StochLength ) - Lowest( low, StochLength ) ) );
def oFastD = Average( oFastK, 1 );
def oSlowK = oFastD;
def oSlowD = Average( oSlowK, 3 ); 


# Length = iff(Period < 0, 1, squareroot(Period)); 
def Length = if Period < 0 then 1 else Sqrt( Period ); 


# NormStoch = .1 * (oslowK - 50); 
def NormStoch = 0.1 * ( oSlowK - 50 ); 


# SmoothStoch = xaverage(xaverage(NormStoch, Length), Length); 
def SmoothStoch = ExpAverage( ExpAverage( NormStoch, Length ), Length );


plot Premier = ( Exp( 1 * SmoothStoch ) - 1 ) / ( Exp( 1 * SmoothStoch ) + 1 );
        Premier.SetDefaultColor( Color.BLUE );

plot pLine1 = Line1;
        pLine1.SetDefaultColor( Color.BLACK );
plot pLine2 = Line2;
        pLine2.SetDefaultColor( Color.GRAY );
plot nLine1 = -1 * Line1;
        nLine1.SetDefaultColor( Color.BLACK );
plot nLine2 = -1 * Line2;
        nLine2.SetDefaultColor( Color.GRAY );
 
@manishji The study was provided. Besides I do not see any particular advantage. The stochastic values can be changed to give what I believe are better signals than the Premier Stochastic. Try playing with stochastic and see what you can get.

Example of Premier vs stochastic with changed values.

HDK8e8Z.png
 

Attachments

  • HDK8e8Z.png
    HDK8e8Z.png
    124.4 KB · Views: 157
@horserider anyway of knowing the the exactly what exponential value is, thanks

This is the Premier Stochastics from the Stocks & Commodities August 6th 2008 By Lee Leibfarth, Does anyone you know exactly what exponential value is?
 
Do you know exactly what exponential value is? for the above premier stochastic. I think it’s the 3 in the code could someone confirm.
 
Here are the exponential calculations ;
def SmoothStoch = ExpAverage( ExpAverage( NormStoch, Length ), Length );
plot Premier = ( Exp( 1 * SmoothStoch ) - 1 ) / ( Exp( 1 * SmoothStoch ) + 1 );

I believe 3 is on of the stochastic lengths. Not sure, did not write it and do not use it.
 
Here are the exponential calculations ;
def SmoothStoch = ExpAverage( ExpAverage( NormStoch, Length ), Length );
plot Premier = ( Exp( 1 * SmoothStoch ) - 1 ) / ( Exp( 1 * SmoothStoch ) + 1 );

I believe 3 is on of the stochastic lengths. Not sure, did not write it and do not use it.

Thanks for taking the time. Was wondering if you could turn the Premier line into a histogram thats green above .2 and red below.2? thanks have a great weekend
 
Ok Color coded line or remove the comment from front of this line of code if you prefer a histogram display.
#Premier.SetPaintingStrategy(PaintingStrategy.HISTOGRAM);

Code:
# // ========================== 
# // PREMIER STOCHASTIC 
# // Indicator 
# // ========================== 
# 
# Technical Analysis of Stocks & Commodities 
# August, 2008 
# Premier Stochastic Oscillator by Lee Leibfarth 
# pp 30 - 36 
# ported by R Houser 
#  Changed to histogram display by Horserider 10/11/219

declare lower;   

# inputs: 
input Line1 = 0.9;
input Line2 = 0.2;
input StochLength = 8;
input Period = 25; 
 

# variables: 
# oFastK(0), 
# oFastD(0), 
# oSlowK(0), 
# oSlowD(0), 
# Length(0), 
# NormStoch(0), 
# SmoothStoch(0), 
# Premier(0); 
 

# Value1 = Stochastic( h, l, c, StochLength, 1, 3, 1, oFastK, oFastD, oSlowK, oSlowD); 
def oFastK = 100 * ( ( close - Lowest( low, StochLength ) ) / ( Highest( high, StochLength ) - Lowest( low, StochLength ) ) );
def oFastD = Average( oFastK, 1 );
def oSlowK = oFastD;
def oSlowD = Average( oSlowK, 3 ); 
 

# Length = iff(Period < 0, 1, squareroot(Period)); 
def Length = if Period < 0 then 1 else Sqrt( Period ); 
 

# NormStoch = .1 * (oslowK - 50); 
def NormStoch = 0.1 * ( oSlowK - 50 ); 
 

# SmoothStoch = xaverage(xaverage(NormStoch, Length), Length); 
def SmoothStoch = ExpAverage( ExpAverage( NormStoch, Length ), Length );
 

plot Premier = ( Exp( 1 * SmoothStoch ) - 1 ) / ( Exp( 1 * SmoothStoch ) + 1 );
      

plot pLine1 = Line1;
        pLine1.SetDefaultColor( Color.BLACK );
plot pLine2 = Line2;
        pLine2.SetDefaultColor( Color.GRAY );
plot nLine1 = -1 * Line1;
        nLine1.SetDefaultColor( Color.BLACK );
plot nLine2 = -1 * Line2;
        nLine2.SetDefaultColor( Color.GRAY );

#Premier.SetPaintingStrategy(PaintingStrategy.HISTOGRAM);
Premier.SetLineWeight(3);
Premier.DefineColor("Positive and Up", Color.GREEN);
Premier.DefineColor("Positive and Down", Color.DARK_GREEN);
Premier.DefineColor("Negative and Down", Color.RED);
Premier.DefineColor("Negative and Up", Color.DARK_RED);
Premier.AssignValueColor(if Premier >= 0 then if Premier >Premier[1] then Premier.color("Positive and Up") else Premier.color("Positive and Down") else if Premier < Premier[1] then Premier.color("Negative and Down") else Premier.color("Negative and Up"));
 
Ok Color coded line or remove the comment from front of this line of code if you prefer a histogram display.
#Premier.SetPaintingStrategy(PaintingStrategy.HISTOGRAM);

Code:
# // ==========================
# // PREMIER STOCHASTIC
# // Indicator
# // ==========================
#
# Technical Analysis of Stocks & Commodities
# August, 2008
# Premier Stochastic Oscillator by Lee Leibfarth
# pp 30 - 36
# ported by R Houser
#  Changed to histogram display by Horserider 10/11/219

declare lower;  

# inputs:
input Line1 = 0.9;
input Line2 = 0.2;
input StochLength = 8;
input Period = 25;


# variables:
# oFastK(0),
# oFastD(0),
# oSlowK(0),
# oSlowD(0),
# Length(0),
# NormStoch(0),
# SmoothStoch(0),
# Premier(0);


# Value1 = Stochastic( h, l, c, StochLength, 1, 3, 1, oFastK, oFastD, oSlowK, oSlowD);
def oFastK = 100 * ( ( close - Lowest( low, StochLength ) ) / ( Highest( high, StochLength ) - Lowest( low, StochLength ) ) );
def oFastD = Average( oFastK, 1 );
def oSlowK = oFastD;
def oSlowD = Average( oSlowK, 3 );


# Length = iff(Period < 0, 1, squareroot(Period));
def Length = if Period < 0 then 1 else Sqrt( Period );


# NormStoch = .1 * (oslowK - 50);
def NormStoch = 0.1 * ( oSlowK - 50 );


# SmoothStoch = xaverage(xaverage(NormStoch, Length), Length);
def SmoothStoch = ExpAverage( ExpAverage( NormStoch, Length ), Length );


plot Premier = ( Exp( 1 * SmoothStoch ) - 1 ) / ( Exp( 1 * SmoothStoch ) + 1 );
     

plot pLine1 = Line1;
        pLine1.SetDefaultColor( Color.BLACK );
plot pLine2 = Line2;
        pLine2.SetDefaultColor( Color.GRAY );
plot nLine1 = -1 * Line1;
        nLine1.SetDefaultColor( Color.BLACK );
plot nLine2 = -1 * Line2;
        nLine2.SetDefaultColor( Color.GRAY );

#Premier.SetPaintingStrategy(PaintingStrategy.HISTOGRAM);
Premier.SetLineWeight(3);
Premier.DefineColor("Positive and Up", Color.GREEN);
Premier.DefineColor("Positive and Down", Color.DARK_GREEN);
Premier.DefineColor("Negative and Down", Color.RED);
Premier.DefineColor("Negative and Up", Color.DARK_RED);
Premier.AssignValueColor(if Premier >= 0 then if Premier >Premier[1] then Premier.color("Positive and Up") else Premier.color("Positive and Down") else if Premier < Premier[1] then Premier.color("Negative and Down") else Premier.color("Negative and Up"));
I have the code up but not sure what you mean remove the comment #Premier.SetPaintingStrategy(PaintingStrategy.HISTOGRAM);, not code savy so not sure what to do
 
Did you know you can also go into study settings and change "line" to "histogram
OK I went in and I tried to change "Line" to Histogram several times, I looked in TOS trying to find this small error and couldn't figure it out, i only spent the time on these two lines of code line 64 and 65, i tried a bunch of different ways, i looked at Constant and paint strategy and histogram area i see how it works but my adjustment of this is wrong
#Premier.SetPaintingStrategy PaintingStrategy.HISTOGRAM
Premier.SetLineWeight(3);
What line of code do I change "Line" from and add in "Histogram" ...Thanks
 
@Trading51 Some hints.
Click on Studies. Click on GEAR icon on far right of the study of interest. Click on DRAW AS. Click on HISTOGRAM looking on.
APPLY

or

In the code;
#Premier.SetPaintingStrategy(PaintingStrategy.HISTOGRAM);
Change to;
Premier.SetPaintingStrategy(PaintingStrategy.HISTOGRAM);
 
So, Change to; was this missing piece I wasn’t even close into figuring that out.. :) thanks for helping me learn
 
You are welcome. Glad you got it. Hope it helps your trading
I'm a two time frame trader, small-time and larger, its the only way thats comfortable for entries, my next step is how can I turn this into a MTF to use it on a higher time frame and a smaller, is it hard adding aggregations to this code or in general, it would be cool to understand or see how hard the process is, let me know and once again thanks for your help its much appreciated
 

Similar threads

Not the exact question you're looking for?

Start a new thread and receive assistance from our community.

87k+ Posts
381 Online
Create Post

Similar threads

Similar threads

The Market Trading Game Changer

Join 2,500+ subscribers inside the useThinkScript VIP Membership Club
  • Exclusive indicators
  • Proven strategies & setups
  • Private Discord community
  • ‘Buy The Dip’ signal alerts
  • Exclusive members-only content
  • Add-ons and resources
  • 1 full year of unlimited support

Frequently Asked Questions

What is useThinkScript?

useThinkScript is the #1 community of stock market investors using indicators and other tools to power their trading strategies. Traders of all skill levels use our forums to learn about scripting and indicators, help each other, and discover new ways to gain an edge in the markets.

How do I get started?

We get it. Our forum can be intimidating, if not overwhelming. With thousands of topics, tens of thousands of posts, our community has created an incredibly deep knowledge base for stock traders. No one can ever exhaust every resource provided on our site.

If you are new, or just looking for guidance, here are some helpful links to get you started.

What are the benefits of VIP Membership?
VIP members get exclusive access to these proven and tested premium indicators: Buy the Dip, Advanced Market Moves 2.0, Take Profit, and Volatility Trading Range. In addition, VIP members get access to over 50 VIP-only custom indicators, add-ons, and strategies, private VIP-only forums, private Discord channel to discuss trades and strategies in real-time, customer support, trade alerts, and much more. Learn all about VIP membership here.
How can I access the premium indicators?
To access the premium indicators, which are plug and play ready, sign up for VIP membership here.
Back
Top