Auto Fib (Fibonacci) Levels Indicator for ThinkorSwim

@BenTen My bad, that would be helpful right? Here they are:

Code:
plot Hi = high(period = "MONTH")[1];
plot Lo = low(period = "MONTH")[1];
plot MonthlyMid = ((hi-lo)*0.5)+lo;

And for the scan, here is the error: "Secondary period not allowed: MONTH."
It shows this for every timeframe of scan, but the monthly.

Thanks again.
 

Join useThinkScript to post your question to a community of 21,000+ developers and traders.

Has anyone come across an auto-drawing fibonacci study that allows you to draw levels from multiple different timeframes on one chart? Basically if you're in the 5 minute you would be able to see the levels from let's say the 5day/15 min and the 10day/30 minute and so on since each aggregated chart contain different minima and maxima. Thanks a lot.
I modified a script from WalkingBallista & BenTen to suit my trading style, but I think it might be what you want. All you would need to do is add the study multiple times to the chart, then set each study to a different time frame.
Note though I only use the 127%, 100%, 61.8%, 50%, and 0%. So you may need to add some lines depending upon your trading style.

To add extra Fib lines just copy the following code and paste it into the code further down below:
Code:
input fib127 = 1.272;
plot h127 = if ShowTodayOnly and !Today and aggregationPeriod == AggregationPeriod.DAY then Double.NaN else if ShowTodayOnly and !Week and aggregationPeriod == AggregationPeriod.WEEK then Double.NaN else if ShowTodayOnly and !Month and aggregationPeriod == AggregationPeriod.Month then Double.NaN else if ShowTodayOnly and !Year and aggregationPeriod == AggregationPeriod.Year then Double.NaN else PH + range*(fib127-1);
h127.DefineColor("Color", Color.DARK_GREEN);
h127.AssignValueColor(h127.Color("Color"));
h127.SetPaintingStrategy(PaintingStrategy.HORIZONTAL);
Now just change every "127" to what ever Fib number you need.

On the code line
Code:
input fib127 = 1.272;
you'll have to put your Fib number in decimal form as well. To do that simply divide your Fib number by 100 to get the number in decimal form.

Also you can use this part of the code line from above to set the lines color:
Code:
h127.DefineColor("Color", Color.DARK_GREEN);
*Just click the word "Dark_Green" and a menu on the right will appear and you can choose from a list of colors.

Repeat all the above steps for each extra line you need, and thats it.


The code I borrowed from WalkingBallista & BenTen is as follows:
Code:
#
# WalkingBallista & BenTen
# https://usethinkscript.com/d/153-high-and-low-with-fibonacci-retracement-indicator-for-thinkorswim
#Edited by BusterMan83 11/15/20

input aggregationPeriod = AggregationPeriod.DAY;
input ShowTodayOnly = yes;

def PH = high(period = aggregationPeriod)[1];
def PL = low(period = aggregationPeriod)[1];
def PO = open(period = aggregationPeriod);
def DL = low(period = AggregationPeriod.DAY);
def Today = if GetDay() == GetLastDay() then 1 else 0;
def Week = if GetWeek() == GetLastWeek() then 1 else 0;
def Month = if GetMonth() == GetLastMonth() then 1 else 0;
def Year = if GetYear() == GetLastYear() then 1 else 0;
def range = PH - PL;

input fib127 = 1.272;
input fib100 = 1;
input fib618 = 0.618;
input fib50  = 0.5;

plot h127 = if ShowTodayOnly and !Today and aggregationPeriod == AggregationPeriod.DAY then Double.NaN else if ShowTodayOnly and !Week and aggregationPeriod == AggregationPeriod.WEEK then Double.NaN else if ShowTodayOnly and !Month and aggregationPeriod == AggregationPeriod.Month then Double.NaN else if ShowTodayOnly and !Year and aggregationPeriod == AggregationPeriod.Year then Double.NaN else PH + range*(fib127-1);
h127.DefineColor("Color", Color.DARK_GREEN);
h127.AssignValueColor(h127.Color("Color"));
h127.SetPaintingStrategy(PaintingStrategy.HORIZONTAL);

plot h100 = if ShowTodayOnly and !Today and aggregationPeriod == AggregationPeriod.DAY then Double.NaN else if ShowTodayOnly and !Week and aggregationPeriod == AggregationPeriod.WEEK then Double.NaN else if ShowTodayOnly and !Month and aggregationPeriod == AggregationPeriod.Month then Double.NaN else if ShowTodayOnly and !Year and aggregationPeriod == AggregationPeriod.Year then Double.NaN else PH + range*(fib100 - 1);
h100.DefineColor("Color", Color.DARK_GREEN);
h100.AssignValueColor(h100.Color("Color"));
h100.SetPaintingStrategy(PaintingStrategy.HORIZONTAL);

plot h618 = if ShowTodayOnly and !Today and aggregationPeriod == AggregationPeriod.DAY then Double.NaN else if ShowTodayOnly and !Week and aggregationPeriod == AggregationPeriod.WEEK then Double.NaN else if ShowTodayOnly and !Month and aggregationPeriod == AggregationPeriod.Month then Double.NaN else if ShowTodayOnly and !Year and aggregationPeriod == AggregationPeriod.Year then Double.NaN else PH + range*(fib618 - 1);
h618.DefineColor("Color", Color.YELLOW);
h618.AssignValueColor(h618.Color("Color"));
h618.SetPaintingStrategy(PaintingStrategy.HORIZONTAL);

plot h50 = if ShowTodayOnly and !Today and aggregationPeriod == AggregationPeriod.DAY then Double.NaN else if ShowTodayOnly and !Week and aggregationPeriod == AggregationPeriod.WEEK then Double.NaN else if ShowTodayOnly and !Month and aggregationPeriod == AggregationPeriod.Month then Double.NaN else if ShowTodayOnly and !Year and aggregationPeriod == AggregationPeriod.Year then Double.NaN else PH + range*(fib50 - 1);
h50.DefineColor("Color", Color.YELLOW);
h50.AssignValueColor(h50.Color("Color"));
h50.SetPaintingStrategy(PaintingStrategy.HORIZONTAL);

plot H0 = if ShowTodayOnly and !Today and aggregationPeriod == AggregationPeriod.DAY then Double.NaN else if ShowTodayOnly and !Week and aggregationPeriod == AggregationPeriod.WEEK then Double.NaN else if ShowTodayOnly and !Month and aggregationPeriod == AggregationPeriod.Month then Double.NaN else if ShowTodayOnly and !Year and aggregationPeriod == AggregationPeriod.Year then Double.NaN else PL;
H0.DefineColor("Color", Color.RED);
H0.AssignValueColor(H0.Color("Color"));
H0.SetPaintingStrategy(PaintingStrategy.HORIZONTAL);

plot HL =  if ShowTodayOnly and !Today and aggregationPeriod == AggregationPeriod.DAY then Double.NaN else if ShowTodayOnly and !Week and aggregationPeriod == AggregationPeriod.WEEK then Double.NaN else if ShowTodayOnly and !Month and aggregationPeriod == AggregationPeriod.Month then Double.NaN else if ShowTodayOnly and !Year and aggregationPeriod == AggregationPeriod.Year then Double.NaN else DL;
HL.DefineColor("Color", Color.WHITE);
HL.AssignValueColor(HL.Color("Color"));
HL.SetPaintingStrategy(PaintingStrategy.HORIZONTAL);
 
Last edited:
can any help moving the price clouds to the left just next to fib percentage? Or somewhere where it doesn't get over the bars

09.04.2020-15.06.png


Code:
##Begin

#hint: <b>Fibonacci Retracements</b>\nFibonacci retracements use horizontal lines to indicate areas of support or resistance at the key Fibonacci levels before it continues in the original direction. These levels are created by drawing a trendline between two extreme points and then dividing the vertical distance by the key Fibonacci ratios of: 23.6%, 38.2%, 50%, 61.8%, 78.6%, and 100%.


#hint Price: Price used in the alerts on crossing retracement lines. <b>(Default is Close)</b>
#hint onExpansion: Determines if the retracement lines are projected past the current bar into the right side expansion <b>(Default is Yes)</b>
#hint Extend_to_left: Determines if the retracement lines are extended to the left side of the chart. <b>(Default is No)</b>

#hint Coefficient0: Retracement Line 0: Retracement from the highest high to the lowest low.\n <b>(Default is 0%)</b>
#hint Coefficient_1: Retracement Line 1: Retracement from the highest high to the lowest low.\n <b>(Default is 23.6%)</b>
#hint Coefficient_2: Retracement Line 2: Retracement from the highest high to the lowest low.\n <b>(Default is 38.2%)</b>
#hint Coefficient_3: Retracement Line 3: Retracement from the highest high to the lowest low.\n <b>(Default is 50%)</b>
#hint Coefficient_4: Retracement Line 4: Retracement from the highest high to the lowest low.\n <b>(Default is 61.8%)</b>
#hint Coefficient_5: Retracement Line 5: Retracement from the highest high to the lowest low.\n <b>(Default is 78.6%)</b>
#hint Coefficient_6: Retracement Line 6: Retracement from the highest high to the lowest low.\n <b>(Default is 100%)</b>

#wizard input: Price
#wizard text: Inputs: Price:
#wizard input: onExpansion
#wizard text: onExpansion:
#wizard input: Extend_to_left
#wizard text: Extend_to_left:
#wizard input: Coefficient0
#wizard text: Coefficient0:
#wizard input: Coefficient_1
#wizard text: Coefficient_1:
#wizard input: Coefficient_2
#wizard text: Coefficient_2:
#wizard input: Coefficient_3
#wizard text: Coefficient_3:
#wizard input: Coefficient_4
#wizard text: Coefficient_4:
#wizard input: Coefficient_5
#wizard text: Coefficient_5:
#wizard input: Coefficient_6
#wizard text: Coefficient_6:

input price = close;
input high = high;
input low = low;
input onExpansion = Yes;
input Extend_to_left = no;
input Coefficient0 = 0.000;
input coefficient_1 = .236;
input Coefficient_2 = .382;
input Coefficient_3 = .500;
input Coefficient_4 = .618;
Input Coefficient_5 = .786;
input Coefficient_6 = 1.000;

def a = HighestAll(high);
def b = LowestAll(low);
def barnumber = barNumber();
def c = if high == a then barnumber else double.nan;
def d = if low == b then barnumber else double.nan;
rec highnumber = compoundValue(1, if IsNaN(c) then highnumber[1] else c, c);
def highnumberall = HighestAll(highnumber);
rec lownumber = compoundValue(1, if IsNaN(d) then lownumber[1] else d, d);
def lownumberall = LowestAll(lownumber);

def upward = highnumberall > lownumberall;
def downward = highnumberall < lownumberall;

def x = AbsValue(lownumberall - highnumberall );

def slope = (a - b) / x;
def slopelow = (b - a) / x;

def day = getDay();
def month = getMonth();
def year = getYear();
def lastDay = getLastDay();
def lastmonth = getLastMonth();
def lastyear = getLastYear();
def isToday = if(day == lastDay and month == lastmonth and year == lastyear, 1, 0);
def istodaybarnumber = HighestAll(if isToday then barnumber else double.nan);

def line = b + (slope * (barnumber - lownumber));
def linelow = a + (slopelow * (barnumber - highnumber));

def currentlinelow = if barnumber <= lownumberall then linelow else double.nan;
def currentline = if barnumber <= highnumberall then line else double.nan;

Plot FibFan =  if  downward then currentlinelow else if upward then currentline else double.nan;
FibFan.SetStyle(Curve.SHORT_DASH);
FibFan.AssignValueColor(color.cyan);
fibfan.hidebubble();

def range =  a - b;

Plot Retracement0 = if downward and !onexpansion and !extend_to_left and barnumber >= highnumberall and barnumber <= istodaybarnumber then highestall((b + (range *  coefficient0))) else if upward and !extend_to_left and !onexpansion and barnumber >= lownumberall and barnumber <= istodaybarnumber then highestall(a - (range * coefficient0)) else if downward and onexpansion and !extend_to_left and barnumber >= highnumberall then highestall((b + (range *  coefficient0))) else if upward and onexpansion and barnumber >= lownumberall and !extend_to_left then highestall(a - (range * coefficient0)) else if downward and !onexpansion and extend_to_left and barnumber <= istodaybarnumber then highestall((b + (range *  coefficient0))) else if upward and extend_to_left and !onexpansion and barnumber <= istodaybarnumber then highestall(a - (range * coefficient0)) else if downward and onexpansion and extend_to_left then highestall((b + (range *  coefficient0))) else if upward and onexpansion and extend_to_left then highestall(a - (range * coefficient0)) else double.nan;
Retracement0.assignvaluecolor(color.cyan);
retracement0.hidebubble();
AddChartBubble((barnumber == istodaybarnumber), retracement0, concat( "$", round(retracement0, 2)), color.cyan, yes);
AddChartBubble((downward and barnumber == highnumberall), retracement0, concat( (coefficient0 * 100), "%"), color.cyan, yes);
AddChartBubble((upward and barnumber == lownumberall), retracement0, concat( (coefficient0 * 100), "%"), color.cyan, yes);


Plot Retracement1 =  if downward and !onexpansion and !extend_to_left and barnumber >= highnumberall and barnumber <= istodaybarnumber then highestall((b + (range *  coefficient_1))) else if upward and !extend_to_left and !onexpansion and barnumber >= lownumberall and barnumber <= istodaybarnumber then highestall(a - (range * coefficient_1)) else if downward and onexpansion and !extend_to_left and barnumber >= highnumberall then highestall((b + (range *  coefficient_1))) else if upward and onexpansion and barnumber >= lownumberall and !extend_to_left then highestall(a - (range * coefficient_1)) else if downward and !onexpansion and extend_to_left and barnumber <= istodaybarnumber then highestall((b + (range *  coefficient_1))) else if upward and extend_to_left and !onexpansion and barnumber <= istodaybarnumber then highestall(a - (range * coefficient_1)) else if downward and onexpansion and extend_to_left then highestall((b + (range *  coefficient_1))) else if upward and onexpansion and extend_to_left then highestall(a - (range * coefficient_1)) else double.nan;
Retracement1.assignvaluecolor(color.cyan);
retracement1.hidebubble();
AddChartBubble((barnumber == istodaybarnumber), retracement1, concat( "$", round(retracement1, 2)), color.cyan, yes);
AddChartBubble((downward and barnumber == highnumberall), retracement1, concat( (coefficient_1 * 100), "%"), color.cyan, yes);
AddChartBubble((upward and barnumber == lownumberall), retracement1, concat( (coefficient_1 * 100), "%"), color.cyan, yes);

Plot Retracement2 =if downward and !onexpansion and !extend_to_left and barnumber >= highnumberall and barnumber <= istodaybarnumber then highestall((b + (range *  coefficient_2))) else if upward and !extend_to_left and !onexpansion and barnumber >= lownumberall and barnumber <= istodaybarnumber then highestall(a - (range * coefficient_2)) else if downward and onexpansion and !extend_to_left and barnumber >= highnumberall then highestall((b + (range *  coefficient_2))) else if upward and onexpansion and barnumber >= lownumberall and !extend_to_left then highestall(a - (range * coefficient_2)) else if downward and !onexpansion and extend_to_left and barnumber <= istodaybarnumber then highestall((b + (range *  coefficient_2))) else if upward and extend_to_left and !onexpansion and barnumber <= istodaybarnumber then highestall(a - (range * coefficient_2)) else if downward and onexpansion and extend_to_left then highestall((b + (range *  coefficient_2))) else if upward and onexpansion and extend_to_left then highestall(a - (range * coefficient_2)) else double.nan;
Retracement2.assignvaluecolor(color.cyan);
retracement2.hidebubble();
AddChartBubble("time condition" = (barnumber == istodaybarnumber), "price location" = retracement2, text = Concat( "$", Round(retracement2, 2)), color = Color.CYAN);
AddChartBubble((downward and barnumber == highnumberall), retracement2, concat( (coefficient_2 * 100), "%"), color.cyan, No);
AddChartBubble("time condition" = (upward and barnumber == lownumberall), "price location" = retracement2, text = Concat( (coefficient_2 * 100), "%"), color = Color.CYAN);


Plot Retracement3 = if downward and !onexpansion and !extend_to_left and barnumber >= highnumberall and barnumber <= istodaybarnumber then highestall((b + (range *  coefficient_3))) else if upward and !extend_to_left and !onexpansion and barnumber >= lownumberall and barnumber <= istodaybarnumber then highestall(a - (range * coefficient_3)) else if downward and onexpansion and !extend_to_left and barnumber >= highnumberall then highestall((b + (range *  coefficient_3))) else if upward and onexpansion and barnumber >= lownumberall and !extend_to_left then highestall(a - (range * coefficient_3)) else if downward and !onexpansion and extend_to_left and barnumber <= istodaybarnumber then highestall((b + (range *  coefficient_3))) else if upward and extend_to_left and !onexpansion and barnumber <= istodaybarnumber then highestall(a - (range * coefficient_3)) else if downward and onexpansion and extend_to_left then highestall((b + (range *  coefficient_3))) else if upward and onexpansion and extend_to_left then highestall(a - (range * coefficient_3)) else double.nan;
Retracement3.assignvaluecolor(color.red);
retracement3.hidebubble();
AddChartBubble((barnumber == istodaybarnumber), retracement3, concat( "$", round(retracement3, 2)), color.white, yes);
AddChartBubble((downward and barnumber == highnumberall), retracement3, concat( (coefficient_3 * 100), "%"), Color.WHITE, yes);
AddChartBubble((upward and barnumber == lownumberall), retracement3, concat( (coefficient_3 * 100), "%"), Color.WHITE, yes);


Plot Retracement4 = if downward and !onexpansion and !extend_to_left and barnumber >= highnumberall and barnumber <= istodaybarnumber then highestall((b + (range *  coefficient_4))) else if upward and !extend_to_left and !onexpansion and barnumber >= lownumberall and barnumber <= istodaybarnumber then highestall(a - (range * coefficient_4)) else if downward and onexpansion and !extend_to_left and barnumber >= highnumberall then highestall((b + (range *  coefficient_4))) else if upward and onexpansion and barnumber >= lownumberall and !extend_to_left then highestall(a - (range * coefficient_4)) else if downward and !onexpansion and extend_to_left and barnumber <= istodaybarnumber then highestall((b + (range *  coefficient_4))) else if upward and extend_to_left and !onexpansion and barnumber <= istodaybarnumber then highestall(a - (range * coefficient_4)) else if downward and onexpansion and extend_to_left then highestall((b + (range *  coefficient_4))) else if upward and onexpansion and extend_to_left then highestall(a - (range * coefficient_4)) else double.nan;
Retracement4.assignvaluecolor(color.cyan);
retracement4.hidebubble();
AddChartBubble((barnumber == istodaybarnumber), retracement4, concat( "$", round(retracement4, 2)), color.cyan, yes);
AddChartBubble((downward and barnumber == highnumberall), retracement4, concat( (coefficient_4 * 100), "%"), color.cyan, yes);
AddChartBubble((upward and barnumber == lownumberall), retracement4, concat( (coefficient_4 * 100), "%"), color.cyan, yes);

Plot Retracement5 = if downward and !onexpansion and !extend_to_left and barnumber >= highnumberall and barnumber <= istodaybarnumber then highestall((b + (range *  coefficient_5))) else if upward and !extend_to_left and !onexpansion and barnumber >= lownumberall and barnumber <= istodaybarnumber then highestall(a - (range * coefficient_5)) else if downward and onexpansion and !extend_to_left and barnumber >= highnumberall then highestall((b + (range *  coefficient_5))) else if upward and onexpansion and barnumber >= lownumberall and !extend_to_left then highestall(a - (range * coefficient_5)) else if downward and !onexpansion and extend_to_left and barnumber <= istodaybarnumber then highestall((b + (range *  coefficient_5))) else if upward and extend_to_left and !onexpansion and barnumber <= istodaybarnumber then highestall(a - (range * coefficient_5)) else if downward and onexpansion and extend_to_left then highestall((b + (range *  coefficient_5))) else if upward and onexpansion and extend_to_left then highestall(a - (range * coefficient_5)) else double.nan;
Retracement5.assignvaluecolor(color.cyan);
retracement5.hidebubble();
AddChartBubble((barnumber == istodaybarnumber), retracement5, concat( "$", round(retracement5, 2)), color.cyan, yes);
AddChartBubble((downward and barnumber == highnumberall), retracement5, concat( (coefficient_5 * 100), "%"), color.cyan, yes);
AddChartBubble((upward and barnumber == lownumberall), retracement5, concat( (coefficient_5 * 100), "%"), color.cyan, yes);


Plot Retracement6 = if downward and !onexpansion and !extend_to_left and barnumber >= highnumberall and barnumber <= istodaybarnumber then highestall((b + (range *  coefficient_6))) else if upward and !extend_to_left and !onexpansion and barnumber >= lownumberall and barnumber <= istodaybarnumber then highestall(a - (range * coefficient_6)) else if downward and onexpansion and !extend_to_left and barnumber >= highnumberall then highestall((b + (range *  coefficient_6))) else if upward and onexpansion and barnumber >= lownumberall and !extend_to_left then highestall(a - (range * coefficient_6)) else if downward and !onexpansion and extend_to_left and barnumber <= istodaybarnumber then highestall((b + (range *  coefficient_6))) else if upward and extend_to_left and !onexpansion and barnumber <= istodaybarnumber then highestall(a - (range * coefficient_6)) else if downward and onexpansion and extend_to_left then highestall((b + (range *  coefficient_6))) else if upward and onexpansion and extend_to_left then highestall(a - (range * coefficient_6)) else double.nan;
Retracement6.assignvaluecolor(color.cyan);
retracement6.hidebubble();
AddChartBubble((barnumber == istodaybarnumber), retracement6, concat( "$", round(retracement6, 2)), color.cyan, yes);

AddChartBubble((downward and barnumber == highnumberall), retracement6, concat( (coefficient_6 * 100), "%"), color.cyan, yes);
AddChartBubble((upward and barnumber == lownumberall), retracement6, concat( (coefficient_6 * 100), "%"), color.cyan, yes);


alert((price crosses below Retracement0) , "Price crosses below Retracement Line 0");
alert((price crosses above Retracement0) , "Price crosses above Retracement Line 0");
alert((price crosses below Retracement1) , "Price crosses below Retracement Line 1");
alert((price crosses above Retracement1) , "Price crosses above Retracement Line 1");
alert((price crosses below Retracement2) , "Price crosses below Retracement Line 2");
alert((price crosses above Retracement2) , "Price crosses above Retracement Line 2");
alert((price crosses below Retracement3) , "Price crosses below Retracement Line 3");
alert((price crosses above Retracement3) , "Price crosses above Retracement Line 3");
alert((price crosses below Retracement4) , "Price crosses below Retracement Line 4");
alert((price crosses above Retracement4) , "Price crosses above Retracement Line 4");
alert((price crosses below Retracement5) , "Price crosses below Retracement Line 5");
alert((price crosses above Retracement5) , "Price crosses above Retracement Line 5");
alert((price crosses below Retracement6) , "Price crosses below Retracement Line 6");
alert((price crosses above Retracement6) , "Price crosses above Retracement Line 6");

@BenTen @horserider @tomsk
Have you found the solution to this?
 
I was trying to create a scan as the price closes above the 9 ema and steadily rises above the Fibonacci levels and I tried using this Fibonacci Supertrend.

Looking for any possible tweaks to this for swing trading. I know with all the coders in here this will look primitive, but following the "KISS" theory... LOL

Scan script below.

https://tos.mx/lQmWPMN
 
Last edited by a moderator:
I would like to thank everyone that has posted code or helped others with corrections. Can not begin to explain how much the past post on the site have helped me. I joined around 3 weeks ago and have been able to find the answer to every question I've had to this point which has actually been a little surprising.

I am attempting to change the original script provided by BenTen in a previous thread from Fib Retracement To Fib Extensions. I cant figure out how to change the script to allow for the manual input of bar numbers for the extension measurement and the starting point of the coefficients .
I am measuring between "Low1" and "High1" and starting the ratio at "Startcoefficients ", as listed below. The StartRatio barnumber has to be an input, if not, the target shown by the ratio will not be correct.

input Low1= 1;
input High1 = 20;
input Startcoefficients= 25;

All I am looking for is a little help with where my mistakes are but will not complain if someone is willing to just fix the script. .....The top portion is my attempt at modifying the script and the bottom portion is the original code that was provided by BenTen on a previous thread, -Auto Fib (Fibonacci) Levels Indicator for ThinkorSwim Created by RyanHendricks.-

-----------------------------------------------------------------------------------------------------------------------------------------------------

MODIFIED Auto Fib (Fibonacci) Levels CODE

Code:
input price = close;
input high = high;
input low = low;


input showBarnumbers = yes;
input onExpansion = Yes;
input Extend_to_left = no;

input Coefficient0 = 0.000;
input coefficient_1 = .236;
input Coefficient_2 = .382;
input Coefficient_3 = .500;
input Coefficient_4 = .618;
Input Coefficient_5 = .786;
input Coefficient_6 = 1.000;

input Low1= 1;
input High1 = 20;
input Startcoefficients = 25; 


def a = High1 ;
def b = Bottom;
def c = if high == a then High1 else double.nan;
def d = if low == b then High1 else double.nan;

#rec highnumber = compoundValue(1, if IsNaN(c) then highnumber[1] else c, c);
def startbar = a;

#rec lownumber = compoundValue(1, if IsNaN(d) then lownumber[1] else d, d);
def lownumberall = b;

def upward = startbar > lownumberall;
def downward = startbar < lownumberall;

def x = AbsValue(lownumberall - startbar );

def slope = (a - b) / x;
def slopelow = (b - a) / x;

def day = getDay();
def month = getMonth();
def year = getYear();
def lastDay = getLastDay();
def lastmonth = getLastMonth();
def lastyear = getLastYear();
def isToday = if(day == lastDay and month == lastmonth and year == lastyear, 1, 0);


def istodaybarnumber = if isToday then High1 else double.nan;

def line = b + (slope * (High1 - b));
def linelow = a + (slopelow * (High1 - startbar));
def currentlinelow = if High1 <= lownumberall then linelow else double.nan;
def currentline = if High1 <= startbar then line else double.nan;

Plot FibFan =  if  downward then currentlinelow else if upward then currentline else double.nan;
FibFan.SetStyle(Curve.SHORT_DASH);
FibFan.AssignValueColor(Color.DARK_GRAY);
fibfan.hidebubble();

def range =  a - b;
def barnumber = High1;

Plot Retracement0 = if downward and !onexpansion and !extend_to_left and barnumber >= startbar and barnumber <= istodaybarnumber then highestall((b + (range *  coefficient0))) else if upward and !extend_to_left and !onexpansion and barnumber >= lownumberall and barnumber <= istodaybarnumber then highestall(a - (range * coefficient0)) else if downward and onexpansion and !extend_to_left and barnumber >= startbar then highestall((b + (range *  coefficient0))) else if upward and onexpansion and barnumber >= lownumberall and !extend_to_left then highestall(a - (range * coefficient0)) else if downward and !onexpansion and extend_to_left and barnumber <= istodaybarnumber then highestall((b + (range *  coefficient0))) else if upward and extend_to_left and !onexpansion and barnumber <= istodaybarnumber then highestall(a - (range * coefficient0)) else if downward and onexpansion and extend_to_left then highestall((b + (range *  coefficient0))) else if upward and onexpansion and extend_to_left then highestall(a - (range * coefficient0)) else double.nan;
Retracement0.assignvaluecolor(Color.DARK_GRAY);
retracement0.hidebubble();

Plot Retracement1 =  if downward and !onexpansion and !extend_to_left and barnumber >= startbar and barnumber <= istodaybarnumber then highestall((b + (range *  coefficient_1))) else if upward and !extend_to_left and !onexpansion and barnumber >= lownumberall and barnumber <= istodaybarnumber then highestall(a - (range * coefficient_1)) else if downward and onexpansion and !extend_to_left and barnumber >= startbar then highestall((b + (range *  coefficient_1))) else if upward and onexpansion and barnumber >= lownumberall and !extend_to_left then highestall(a - (range * coefficient_1)) else if downward and !onexpansion and extend_to_left and barnumber <= istodaybarnumber then highestall((b + (range *  coefficient_1))) else if upward and extend_to_left and !onexpansion and barnumber <= istodaybarnumber then highestall(a - (range * coefficient_1)) else if downward and onexpansion and extend_to_left then highestall((b + (range *  coefficient_1))) else if upward and onexpansion and extend_to_left then highestall(a - (range * coefficient_1)) else double.nan;
Retracement1.assignvaluecolor(Color.DARK_GRAY);
retracement1.hidebubble();


Plot Retracement2 =if downward and !onexpansion and !extend_to_left and barnumber >= startbar and barnumber <= istodaybarnumber then highestall((b + (range *  coefficient_2))) else if upward and !extend_to_left and !onexpansion and barnumber >= lownumberall and barnumber <= istodaybarnumber then highestall(a - (range * coefficient_2)) else if downward and onexpansion and !extend_to_left and barnumber >= startbar then highestall((b + (range *  coefficient_2))) else if upward and onexpansion and barnumber >= lownumberall and !extend_to_left then highestall(a - (range * coefficient_2)) else if downward and !onexpansion and extend_to_left and barnumber <= istodaybarnumber then highestall((b + (range *  coefficient_2))) else if upward and extend_to_left and !onexpansion and barnumber <= istodaybarnumber then highestall(a - (range * coefficient_2)) else if downward and onexpansion and extend_to_left then highestall((b + (range *  coefficient_2))) else if upward and onexpansion and extend_to_left then highestall(a - (range * coefficient_2)) else double.nan;
Retracement2.assignvaluecolor(Color.DARK_GRAY);
retracement2.hidebubble();


Plot Retracement3 = if downward and !onexpansion and !extend_to_left and barnumber >= startbar and barnumber <= istodaybarnumber then highestall((b + (range *  coefficient_3))) else if upward and !extend_to_left and !onexpansion and barnumber >= lownumberall and barnumber <= istodaybarnumber then highestall(a - (range * coefficient_3)) else if downward and onexpansion and !extend_to_left and barnumber >= startbar then highestall((b + (range *  coefficient_3))) else if upward and onexpansion and barnumber >= lownumberall and !extend_to_left then highestall(a - (range * coefficient_3)) else if downward and !onexpansion and extend_to_left and barnumber <= istodaybarnumber then highestall((b + (range *  coefficient_3))) else if upward and extend_to_left and !onexpansion and barnumber <= istodaybarnumber then highestall(a - (range * coefficient_3)) else if downward and onexpansion and extend_to_left then highestall((b + (range *  coefficient_3))) else if upward and onexpansion and extend_to_left then highestall(a - (range * coefficient_3)) else double.nan;
Retracement3.assignvaluecolor(Color.DARK_GRAY);
retracement3.hidebubble();

Plot Retracement4 = if downward and !onexpansion and !extend_to_left and barnumber >= startbar and barnumber <= istodaybarnumber then highestall((b + (range *  coefficient_4))) else if upward and !extend_to_left and !onexpansion and barnumber >= lownumberall and barnumber <= istodaybarnumber then highestall(a - (range * coefficient_4)) else if downward and onexpansion and !extend_to_left and barnumber >= startbar then highestall((b + (range *  coefficient_4))) else if upward and onexpansion and barnumber >= lownumberall and !extend_to_left then highestall(a - (range * coefficient_4)) else if downward and !onexpansion and extend_to_left and barnumber <= istodaybarnumber then highestall((b + (range *  coefficient_4))) else if upward and extend_to_left and !onexpansion and barnumber <= istodaybarnumber then highestall(a - (range * coefficient_4)) else if downward and onexpansion and extend_to_left then highestall((b + (range *  coefficient_4))) else if upward and onexpansion and extend_to_left then highestall(a - (range * coefficient_4)) else double.nan;
Retracement4.assignvaluecolor(Color.DARK_GRAY);
retracement4.hidebubble();

Plot Retracement5 = if downward and !onexpansion and !extend_to_left and barnumber >= startbar and barnumber <= istodaybarnumber then highestall((b + (range *  coefficient_5))) else if upward and !extend_to_left and !onexpansion and barnumber >= lownumberall and barnumber <= istodaybarnumber then highestall(a - (range * coefficient_5)) else if downward and onexpansion and !extend_to_left and barnumber >= startbar then highestall((b + (range *  coefficient_5))) else if upward and onexpansion and barnumber >= lownumberall and !extend_to_left then highestall(a - (range * coefficient_5)) else if downward and !onexpansion and extend_to_left and barnumber <= istodaybarnumber then highestall((b + (range *  coefficient_5))) else if upward and extend_to_left and !onexpansion and barnumber <= istodaybarnumber then highestall(a - (range * coefficient_5)) else if downward and onexpansion and extend_to_left then highestall((b + (range *  coefficient_5))) else if upward and onexpansion and extend_to_left then highestall(a - (range * coefficient_5)) else double.nan;
Retracement5.assignvaluecolor(Color.DARK_GRAY);
retracement5.hidebubble();


Plot Retracement6 = if downward and !onexpansion and !extend_to_left and barnumber >= startbar and barnumber <= istodaybarnumber then highestall((b + (range *  coefficient_6))) else if upward and !extend_to_left and !onexpansion and barnumber >= lownumberall and barnumber <= istodaybarnumber then highestall(a - (range * coefficient_6)) else if downward and onexpansion and !extend_to_left and barnumber >= startbar then highestall((b + (range *  coefficient_6))) else if upward and onexpansion and barnumber >= lownumberall and !extend_to_left then highestall(a - (range * coefficient_6)) else if downward and !onexpansion and extend_to_left and barnumber <= istodaybarnumber then highestall((b + (range *  coefficient_6))) else if upward and extend_to_left and !onexpansion and barnumber <= istodaybarnumber then highestall(a - (range * coefficient_6)) else if downward and onexpansion and extend_to_left then highestall((b + (range *  coefficient_6))) else if upward and onexpansion and extend_to_left then highestall(a - (range * coefficient_6)) else double.nan;
Retracement6.assignvaluecolor(Color.DARK_GRAY);
retracement6.hidebubble();

plot bars = if showBarnumbers then BarNumber() else Double.NaN;
bars.SetPaintingStrategy(PaintingStrategy.VALUES_BELOW);


[B][B][B][B][B][B][B][B][B][B][B][B][B][B][B][B][B][B][B][B][I]Original Auto Fib (Fibonacci) Levels CODE *[/I][/B][/B][/B][/B][/B][/B][/B][/B][/B][/B][/B][/B][/B][/B][/B][/B][/B][/B][/B][/B]

input price = close;
input high = high;
input low = low;
input onExpansion = Yes;
input Extend_to_left = no;
input Coefficient0 = 0.000;
input coefficient_1 = .236;
input Coefficient_2 = .382;
input Coefficient_3 = .500;
input Coefficient_4 = .618;
Input Coefficient_5 = .786;
input Coefficient_6 = 1.000;

def a = HighestAll(high);
def b = LowestAll(low);
def barnumber = barNumber();
def c = if high == a then barnumber else double.nan;
def d = if low == b then barnumber else double.nan;
rec highnumber = compoundValue(1, if IsNaN(c) then highnumber[1] else c, c);
def highnumberall = HighestAll(highnumber);
rec lownumber = compoundValue(1, if IsNaN(d) then lownumber[1] else d, d);
def lownumberall = LowestAll(lownumber);

def upward = highnumberall > lownumberall;
def downward = highnumberall < lownumberall;

def x = AbsValue(lownumberall - highnumberall );

def slope = (a - b) / x;
def slopelow = (b - a) / x;

def day = getDay();
def month = getMonth();
def year = getYear();
def lastDay = getLastDay();
def lastmonth = getLastMonth();
def lastyear = getLastYear();
def isToday = if(day == lastDay and month == lastmonth and year == lastyear, 1, 0);
def istodaybarnumber = HighestAll(if isToday then barnumber else double.nan);

def line = b + (slope * (barnumber - lownumber));
def linelow = a + (slopelow * (barnumber - highnumber));

def currentlinelow = if barnumber <= lownumberall then linelow else double.nan;
def currentline = if barnumber <= highnumberall then line else double.nan;

Plot FibFan =  if  downward then currentlinelow else if upward then currentline else double.nan;
FibFan.SetStyle(Curve.SHORT_DASH);
FibFan.AssignValueColor(color.cyan);
fibfan.hidebubble();

def range =  a - b;

Plot Retracement0 = if downward and !onexpansion and !extend_to_left and barnumber >= highnumberall and barnumber <= istodaybarnumber then highestall((b + (range *  coefficient0))) else if upward and !extend_to_left and !onexpansion and barnumber >= lownumberall and barnumber <= istodaybarnumber then highestall(a - (range * coefficient0)) else if downward and onexpansion and !extend_to_left and barnumber >= highnumberall then highestall((b + (range *  coefficient0))) else if upward and onexpansion and barnumber >= lownumberall and !extend_to_left then highestall(a - (range * coefficient0)) else if downward and !onexpansion and extend_to_left and barnumber <= istodaybarnumber then highestall((b + (range *  coefficient0))) else if upward and extend_to_left and !onexpansion and barnumber <= istodaybarnumber then highestall(a - (range * coefficient0)) else if downward and onexpansion and extend_to_left then highestall((b + (range *  coefficient0))) else if upward and onexpansion and extend_to_left then highestall(a - (range * coefficient0)) else double.nan;
Retracement0.assignvaluecolor(color.cyan);
retracement0.hidebubble();
AddChartBubble((barnumber == istodaybarnumber), retracement0, concat( "$", round(retracement0, 2)), color.cyan, yes);
AddChartBubble((downward and barnumber == highnumberall), retracement0, concat( (coefficient0 * 100), "%"), color.cyan, yes);
AddChartBubble((upward and barnumber == lownumberall), retracement0, concat( (coefficient0 * 100), "%"), color.cyan, yes);


Plot Retracement1 =  if downward and !onexpansion and !extend_to_left and barnumber >= highnumberall and barnumber <= istodaybarnumber then highestall((b + (range *  coefficient_1))) else if upward and !extend_to_left and !onexpansion and barnumber >= lownumberall and barnumber <= istodaybarnumber then highestall(a - (range * coefficient_1)) else if downward and onexpansion and !extend_to_left and barnumber >= highnumberall then highestall((b + (range *  coefficient_1))) else if upward and onexpansion and barnumber >= lownumberall and !extend_to_left then highestall(a - (range * coefficient_1)) else if downward and !onexpansion and extend_to_left and barnumber <= istodaybarnumber then highestall((b + (range *  coefficient_1))) else if upward and extend_to_left and !onexpansion and barnumber <= istodaybarnumber then highestall(a - (range * coefficient_1)) else if downward and onexpansion and extend_to_left then highestall((b + (range *  coefficient_1))) else if upward and onexpansion and extend_to_left then highestall(a - (range * coefficient_1)) else double.nan;
Retracement1.assignvaluecolor(color.cyan);
retracement1.hidebubble();
AddChartBubble((barnumber == istodaybarnumber), retracement1, concat( "$", round(retracement1, 2)), color.cyan, yes);
AddChartBubble((downward and barnumber == highnumberall), retracement1, concat( (coefficient_1 * 100), "%"), color.cyan, yes);
AddChartBubble((upward and barnumber == lownumberall), retracement1, concat( (coefficient_1 * 100), "%"), color.cyan, yes);

Plot Retracement2 =if downward and !onexpansion and !extend_to_left and barnumber >= highnumberall and barnumber <= istodaybarnumber then highestall((b + (range *  coefficient_2))) else if upward and !extend_to_left and !onexpansion and barnumber >= lownumberall and barnumber <= istodaybarnumber then highestall(a - (range * coefficient_2)) else if downward and onexpansion and !extend_to_left and barnumber >= highnumberall then highestall((b + (range *  coefficient_2))) else if upward and onexpansion and barnumber >= lownumberall and !extend_to_left then highestall(a - (range * coefficient_2)) else if downward and !onexpansion and extend_to_left and barnumber <= istodaybarnumber then highestall((b + (range *  coefficient_2))) else if upward and extend_to_left and !onexpansion and barnumber <= istodaybarnumber then highestall(a - (range * coefficient_2)) else if downward and onexpansion and extend_to_left then highestall((b + (range *  coefficient_2))) else if upward and onexpansion and extend_to_left then highestall(a - (range * coefficient_2)) else double.nan;
Retracement2.assignvaluecolor(color.cyan);
retracement2.hidebubble();
AddChartBubble("time condition" = (barnumber == istodaybarnumber), "price location" = retracement2, text = Concat( "$", Round(retracement2, 2)), color = Color.CYAN);
AddChartBubble((downward and barnumber == highnumberall), retracement2, concat( (coefficient_2 * 100), "%"), color.cyan, No);
AddChartBubble("time condition" = (upward and barnumber == lownumberall), "price location" = retracement2, text = Concat( (coefficient_2 * 100), "%"), color = Color.CYAN);


Plot Retracement3 = if downward and !onexpansion and !extend_to_left and barnumber >= highnumberall and barnumber <= istodaybarnumber then highestall((b + (range *  coefficient_3))) else if upward and !extend_to_left and !onexpansion and barnumber >= lownumberall and barnumber <= istodaybarnumber then highestall(a - (range * coefficient_3)) else if downward and onexpansion and !extend_to_left and barnumber >= highnumberall then highestall((b + (range *  coefficient_3))) else if upward and onexpansion and barnumber >= lownumberall and !extend_to_left then highestall(a - (range * coefficient_3)) else if downward and !onexpansion and extend_to_left and barnumber <= istodaybarnumber then highestall((b + (range *  coefficient_3))) else if upward and extend_to_left and !onexpansion and barnumber <= istodaybarnumber then highestall(a - (range * coefficient_3)) else if downward and onexpansion and extend_to_left then highestall((b + (range *  coefficient_3))) else if upward and onexpansion and extend_to_left then highestall(a - (range * coefficient_3)) else double.nan;
Retracement3.assignvaluecolor(color.red);
retracement3.hidebubble();
AddChartBubble((barnumber == istodaybarnumber), retracement3, concat( "$", round(retracement3, 2)), color.white, yes);
AddChartBubble((downward and barnumber == highnumberall), retracement3, concat( (coefficient_3 * 100), "%"), Color.WHITE, yes);
AddChartBubble((upward and barnumber == lownumberall), retracement3, concat( (coefficient_3 * 100), "%"), Color.WHITE, yes);


Plot Retracement4 = if downward and !onexpansion and !extend_to_left and barnumber >= highnumberall and barnumber <= istodaybarnumber then highestall((b + (range *  coefficient_4))) else if upward and !extend_to_left and !onexpansion and barnumber >= lownumberall and barnumber <= istodaybarnumber then highestall(a - (range * coefficient_4)) else if downward and onexpansion and !extend_to_left and barnumber >= highnumberall then highestall((b + (range *  coefficient_4))) else if upward and onexpansion and barnumber >= lownumberall and !extend_to_left then highestall(a - (range * coefficient_4)) else if downward and !onexpansion and extend_to_left and barnumber <= istodaybarnumber then highestall((b + (range *  coefficient_4))) else if upward and extend_to_left and !onexpansion and barnumber <= istodaybarnumber then highestall(a - (range * coefficient_4)) else if downward and onexpansion and extend_to_left then highestall((b + (range *  coefficient_4))) else if upward and onexpansion and extend_to_left then highestall(a - (range * coefficient_4)) else double.nan;
Retracement4.assignvaluecolor(color.cyan);
retracement4.hidebubble();
AddChartBubble((barnumber == istodaybarnumber), retracement4, concat( "$", round(retracement4, 2)), color.cyan, yes);
AddChartBubble((downward and barnumber == highnumberall), retracement4, concat( (coefficient_4 * 100), "%"), color.cyan, yes);
AddChartBubble((upward and barnumber == lownumberall), retracement4, concat( (coefficient_4 * 100), "%"), color.cyan, yes);

Plot Retracement5 = if downward and !onexpansion and !extend_to_left and barnumber >= highnumberall and barnumber <= istodaybarnumber then highestall((b + (range *  coefficient_5))) else if upward and !extend_to_left and !onexpansion and barnumber >= lownumberall and barnumber <= istodaybarnumber then highestall(a - (range * coefficient_5)) else if downward and onexpansion and !extend_to_left and barnumber >= highnumberall then highestall((b + (range *  coefficient_5))) else if upward and onexpansion and barnumber >= lownumberall and !extend_to_left then highestall(a - (range * coefficient_5)) else if downward and !onexpansion and extend_to_left and barnumber <= istodaybarnumber then highestall((b + (range *  coefficient_5))) else if upward and extend_to_left and !onexpansion and barnumber <= istodaybarnumber then highestall(a - (range * coefficient_5)) else if downward and onexpansion and extend_to_left then highestall((b + (range *  coefficient_5))) else if upward and onexpansion and extend_to_left then highestall(a - (range * coefficient_5)) else double.nan;
Retracement5.assignvaluecolor(color.cyan);
retracement5.hidebubble();
AddChartBubble((barnumber == istodaybarnumber), retracement5, concat( "$", round(retracement5, 2)), color.cyan, yes);
AddChartBubble((downward and barnumber == highnumberall), retracement5, concat( (coefficient_5 * 100), "%"), color.cyan, yes);
AddChartBubble((upward and barnumber == lownumberall), retracement5, concat( (coefficient_5 * 100), "%"), color.cyan, yes);


Plot Retracement6 = if downward and !onexpansion and !extend_to_left and barnumber >= highnumberall and barnumber <= istodaybarnumber then highestall((b + (range *  coefficient_6))) else if upward and !extend_to_left and !onexpansion and barnumber >= lownumberall and barnumber <= istodaybarnumber then highestall(a - (range * coefficient_6)) else if downward and onexpansion and !extend_to_left and barnumber >= highnumberall then highestall((b + (range *  coefficient_6))) else if upward and onexpansion and barnumber >= lownumberall and !extend_to_left then highestall(a - (range * coefficient_6)) else if downward and !onexpansion and extend_to_left and barnumber <= istodaybarnumber then highestall((b + (range *  coefficient_6))) else if upward and extend_to_left and !onexpansion and barnumber <= istodaybarnumber then highestall(a - (range * coefficient_6)) else if downward and onexpansion and extend_to_left then highestall((b + (range *  coefficient_6))) else if upward and onexpansion and extend_to_left then highestall(a - (range * coefficient_6)) else double.nan;
Retracement6.assignvaluecolor(color.cyan);
retracement6.hidebubble();
AddChartBubble((barnumber == istodaybarnumber), retracement6, concat( "$", round(retracement6, 2)), color.cyan, yes);

AddChartBubble((downward and barnumber == highnumberall), retracement6, concat( (coefficient_6 * 100), "%"), color.cyan, yes);
AddChartBubble((upward and barnumber == lownumberall), retracement6, concat( (coefficient_6 * 100), "%"), color.cyan, yes);


alert((price crosses below Retracement0) , "Price crosses below Retracement Line 0");
alert((price crosses above Retracement0) , "Price crosses above Retracement Line 0");
alert((price crosses below Retracement1) , "Price crosses below Retracement Line 1");
alert((price crosses above Retracement1) , "Price crosses above Retracement Line 1");
alert((price crosses below Retracement2) , "Price crosses below Retracement Line 2");
alert((price crosses above Retracement2) , "Price crosses above Retracement Line 2");
alert((price crosses below Retracement3) , "Price crosses below Retracement Line 3");
alert((price crosses above Retracement3) , "Price crosses above Retracement Line 3");
alert((price crosses below Retracement4) , "Price crosses below Retracement Line 4");
alert((price crosses above Retracement4) , "Price crosses above Retracement Line 4");
alert((price crosses below Retracement5) , "Price crosses below Retracement Line 5");
alert((price crosses above Retracement5) , "Price crosses above Retracement Line 5");
alert((price crosses below Retracement6) , "Price crosses below Retracement Line 6");
alert((price crosses above Retracement6) , "Price crosses above Retracement Line 6");
 
I am looking for same thing... maybe using a highpoint (or lowpoint) from last 50 bars (or as specified by timeframe) to lock in the extension coefficient. Just a thought.
 
I am looking for same thing... maybe using a highpoint (or lowpoint) from last 50 bars (or as specified by timeframe) to lock in the extension coefficient. Just a thought.
Yeah that actually would be the way to do it. I kept working on what I had. I’ll send it to you when I finish. Thank you for the suggestion
 
Yeah that actually would be the way to do it. I kept working on what I had. I’ll send it to you when I finish. Thank you for the suggestion
No problem. I'll test it out when you finish... I don't know coding very well so I'd help you otherwise...

But I noticed the retracement script moves when the price moves higher, which is great on a pull back but having a target price in an uptrend would be awesome... We don't need a retracement when the price only going up! Good luck! I'll check back.
 
The idea behind this indicator is to look at price from a different angle, the indicator does repaint with new information, but i believe that to be the key to this indicator, if there is not enough pass price aligning with the fibonacci levels, present price seems to move to make those pass levels true, giving you an idea where price might move to make those natural levels more precise.

bZPDlT8.png
Kezr1uQ.png


Code:
input slope_adjust_multiplier = 0.00;
input price = close;
input high = high;
input low = low;
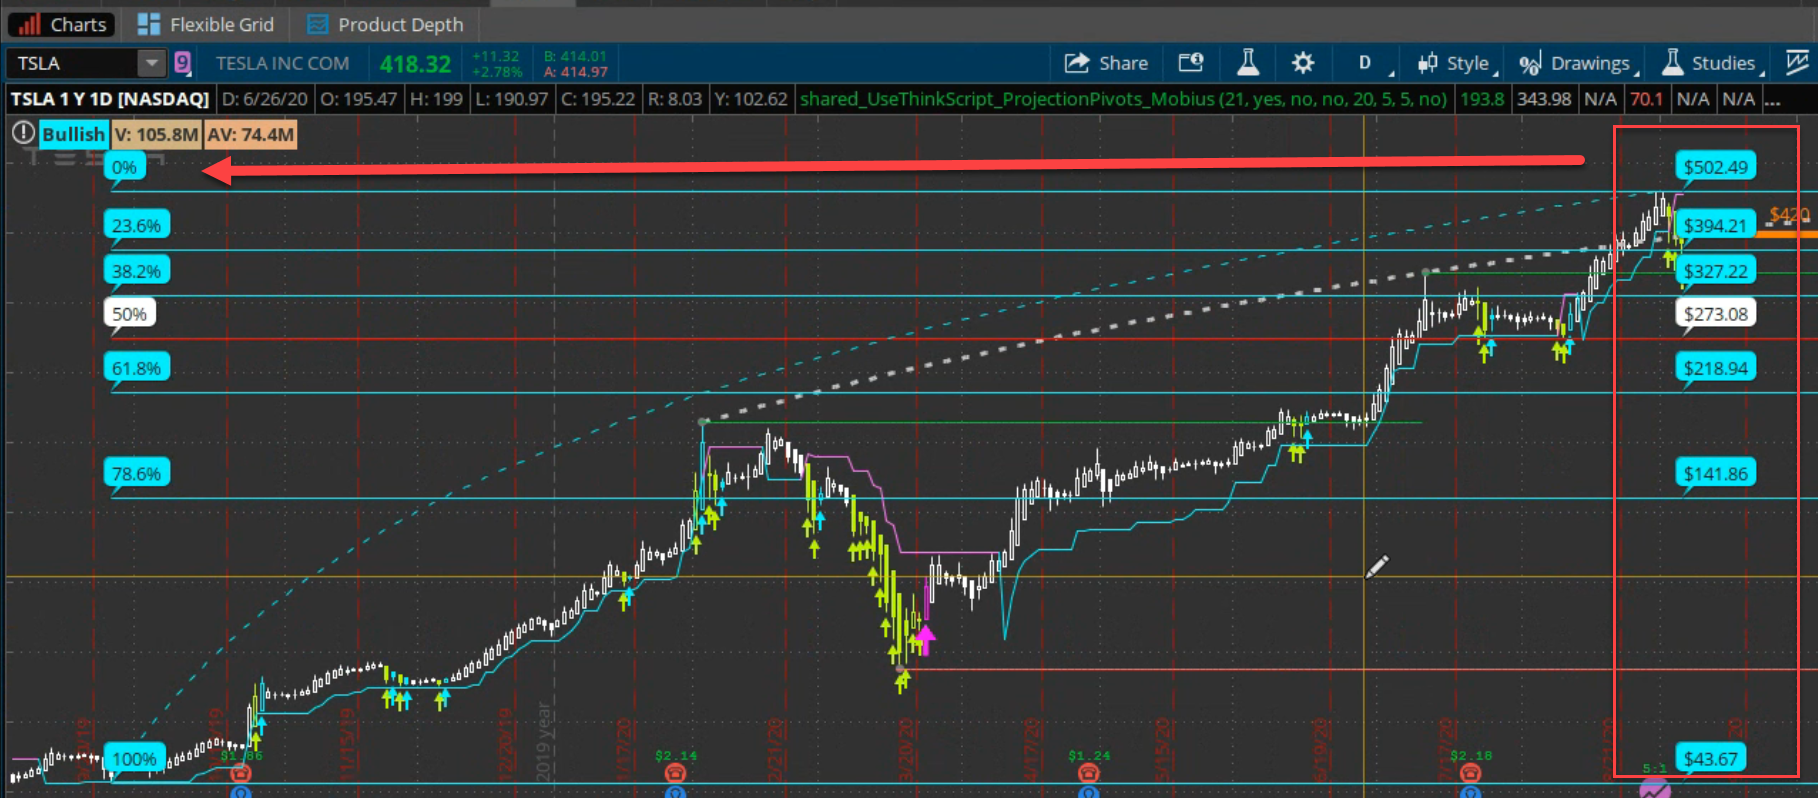
input coefficient_0 = 0.000;
input coefficient_1 = .236;
input Coefficient_2 = .382;
input Coefficient_3 = .500;
input Coefficient_4 = .618;
Input Coefficient_5 = .786;
input Coefficient_6 = 1.000;

def slope_adj = slope_adjust_multiplier;
def a = HighestAll(high);
def b = LowestAll(low);
def barnumber = barNumber();
def c = if high == a then barnumber else double.nan;
def d = if low == b then barnumber else double.nan;
rec highnumber = compoundValue(1, if IsNaN(c) then highnumber[1] else c, c);
def highnumberall = HighestAll(highnumber);
rec lownumber = compoundValue(1, if IsNaN(d) then lownumber[1] else d, d);
def lownumberall = LowestAll(lownumber);

def upward = highnumberall > lownumberall;
def downward = highnumberall < lownumberall;
def range =  a - b;
def value0 = range * coefficient_0;
def value1 = range * coefficient_1;
def value2 = range * coefficient_2;
def value3 = range * coefficient_3;
def value4 = range * coefficient_4;
def value5 = range * coefficient_5;
def value6 = range * coefficient_6;

def condition1 = downward and barnumber >= highnumberall;
def condition2 = upward and barnumber >= lownumberall;

Plot Retracement0 = if condition1 then highestall(b + value0) else if condition2 then highestall(a - value0) else double.nan;
Plot Retracement1 = if condition1 then highestall(b + value1) else if condition2 then highestall(a - value1) else double.nan;
Plot Retracement2 = if condition1 then highestall(b + value2) else if condition2 then highestall(a - value2) else double.nan;
Plot Retracement3 = if condition1 then highestall(b + value3) else if condition2 then highestall(a - value3) else double.nan;
Plot Retracement4 = if condition1 then highestall(b + value4) else if condition2 then highestall(a - value4) else double.nan;
Plot Retracement5 = if condition1 then highestall(b + value5) else if condition2 then highestall(a - value5) else double.nan;
Plot Retracement6 = if condition1 then highestall(b + value6) else if condition2 then highestall(a - value6) else double.nan;

def x = AbsValue(lownumberall - highnumberall );

def slope = (a - b) / x;
def slopelow = (b - a) / x;

def day = getDay();
def month = getMonth();
def year = getYear();
def lastDay = getLastDay();
def lastmonth = getLastMonth();
def lastyear = getLastYear();
def isToday = if(day == lastDay and month == lastmonth and year == lastyear, 1, 0);
def istodaybarnumber = HighestAll(if isToday then barnumber else double.nan);


def line = b + (slope * (barnumber - lownumber));
def linelow = a + (slopelow * (barnumber - highnumber));
def currentlinelow = if barnumber <= lownumberall then linelow else double.nan;
def currentline = if barnumber <= highnumberall then line else double.nan;

Plot FibFan =  if  downward then currentlinelow else if upward then currentline else double.nan;
FibFan.SetStyle(Curve.SHORT_DASH);
FibFan.AssignValueColor(color.red);
fibfan.hidebubble();


def xx = if condition1 then (barnumber - highnumberall) else (barnumber - lownumberall);
def mm = if condition1 then highestall((ohlc4 - retracement6) / xx) else lowestall((ohlc4 - retracement6) / xx);

#PLOT FIBS with slope
# Y = MX + B
#y = end value, m = slope = x is time b = beg value
plot r6 = mm*slope_adj*xx + retracement6;
plot r5 = mm*slope_adj*xx + retracement5;
plot r4 = mm*slope_adj*xx + retracement4;
plot r3 = mm*slope_adj*xx + retracement3;
plot r2 = mm*slope_adj*xx + retracement2;
plot r1 = mm*slope_adj*xx + retracement1;
plot r0 = mm*slope_adj*xx + retracement0;

#VISUALS AND ALERTS
Retracement0.assignvaluecolor(CreateColor(255,255,255));
Retracement0.setLineWeight(4);
retracement0.hidebubble();
#AddChartBubble((barnumber == istodaybarnumber +10), retracement0, concat( "$", round(retracement0, 2)), color.red, yes);
AddChartBubble((downward and barnumber == highnumberall), retracement0, concat( (coefficient_0 * 100), "%"), color.red, yes);
AddChartBubble((upward and barnumber == lownumberall), retracement0, concat( (coefficient_0 * 100), "%"), color.red, yes);

Retracement1.assignvaluecolor(CreateColor(173,216,230));
Retracement1.setLineWeight(2);
retracement1.hidebubble();
#AddChartBubble((barnumber == istodaybarnumber+10), retracement1, concat( "$", round(retracement1, 2)), color.red, yes);
AddChartBubble((downward and barnumber == highnumberall), retracement1, concat( (coefficient_1 * 100), "%"), color.red, yes);
AddChartBubble((upward and barnumber == lownumberall), retracement1, concat( (coefficient_1 * 100), "%"), color.red, yes);

Retracement2.assignvaluecolor(CreateColor(0,197,49));
Retracement2.setLineWeight(2);
retracement2.hidebubble();
#AddChartBubble((barnumber == istodaybarnumber+10), retracement2, concat( "$", round(retracement2, 2)), color.red, yes);
AddChartBubble((downward and barnumber == highnumberall), retracement2, concat( (coefficient_2 * 100), "%"), color.red, yes);
AddChartBubble((upward and barnumber == lownumberall), retracement2, concat( (coefficient_2 * 100), "%"), color.red, yes);

Retracement3.assignvaluecolor(CreateColor(255,64,64));
Retracement3.setLineWeight(3);
retracement3.hidebubble();
#AddChartBubble((barnumber == istodaybarnumber+10), retracement3, concat( "$", round(retracement3, 2)), color.red, yes);
AddChartBubble((downward and barnumber == highnumberall), retracement3, concat( (coefficient_3 * 100), "%"), color.red, yes);
AddChartBubble((upward and barnumber == lownumberall), retracement3, concat( (coefficient_3 * 100), "%"), color.red, yes);

Retracement4.assignvaluecolor(CreateColor(255,215,0));
Retracement4.setLineWeight(5);
retracement4.hidebubble();
#AddChartBubble((barnumber == istodaybarnumber+10), retracement4, concat( "$", round(retracement4, 2)), color.red, yes);
AddChartBubble((downward and barnumber == highnumberall), retracement4, concat( (coefficient_4 * 100), "%"), color.red, yes);
AddChartBubble((upward and barnumber == lownumberall), retracement4, concat( (coefficient_4 * 100), "%"), color.red, yes);

Retracement5.assignvaluecolor(CreateColor(0,255,255));
Retracement5.setLineWeight(2);
retracement5.hidebubble();
#AddChartBubble((barnumber == istodaybarnumber+10), retracement5, concat( "$", round(retracement5, 2)), color.red, yes);
AddChartBubble((downward and barnumber == highnumberall), retracement5, concat( (coefficient_5 * 100), "%"), color.red, yes);
AddChartBubble((upward and barnumber == lownumberall), retracement5, concat( (coefficient_5 * 100), "%"), color.red, yes);

Retracement6.assignvaluecolor(CreateColor(255,255,255));
Retracement6.setLineWeight(4);
Retracement6.hidebubble();
#AddChartBubble((barnumber == istodaybarnumber+10), retracement6, concat( "$", round(retracement6, 2)), color.red, yes);
AddChartBubble((downward and barnumber == highnumberall), retracement6, concat( (coefficient_6 * 100), "%"), color.red, yes);
AddChartBubble((upward and barnumber == lownumberall), retracement6, concat( (coefficient_6 * 100), "%"), color.red, yes);

r0.setlineWeight(2);
r1.setlineWeight(2);
r2.setlineWeight(2);
r3.setlineWeight(2);
r4.setlineWeight(2);
r5.setlineWeight(2);
r6.setlineWeight(2);

retracement0.Hide();
retracement1.Hide();
retracement2.Hide();
retracement3.Hide();
retracement4.Hide();
retracement5.Hide();
retracement6.Hide();

alert((price crosses below Retracement0) , "Price crosses below Retracement Line 0");
alert((price crosses above Retracement0) , "Price crosses above Retracement Line 0");
alert((price crosses below Retracement1) , "Price crosses below Retracement Line 1");
alert((price crosses above Retracement1) , "Price crosses above Retracement Line 1");
alert((price crosses below Retracement2) , "Price crosses below Retracement Line 2");
alert((price crosses above Retracement2) , "Price crosses above Retracement Line 2");
alert((price crosses below Retracement3) , "Price crosses below Retracement Line 3");
alert((price crosses above Retracement3) , "Price crosses above Retracement Line 3");
alert((price crosses below Retracement4) , "Price crosses below Retracement Line 4");
alert((price crosses above Retracement4) , "Price crosses above Retracement Line 4");
alert((price crosses below Retracement5) , "Price crosses below Retracement Line 5");
alert((price crosses above Retracement5) , "Price crosses above Retracement Line 5");
alert((price crosses below Retracement6) , "Price crosses below Retracement Line 6");
alert((price crosses above Retracement6) , "Price crosses above Retracement Line 6");
 

Attachments

  • bZPDlT8.png
    bZPDlT8.png
    389 KB · Views: 281
Last edited:
FIB FANS, ADDED THE LESSER USED .886 LEVEL, PLOTS FIB FANS FROM THE LOW TO THE HIGH.

Ns8eXLk.png


Code:
##Begin##


#hint: <b>Fibonacci Fan lines</b>\nFibonacci Fan lines are trendlines based on Fibonacci retracement points. Rising fan lines extend up from a trough and pass through retracement based on the advance (lowest low to highest high or on the falling fan lines: highest high to lowest low). These fan lines can then be used to estimate support levels or potential reversal zones. Falling fan lines can then be used to estimate resistance levels or potential reversal zones.


#hint Price: Price used in the alerts on crossing of the fans. <b>(Default is Close)</b>

#hint onExpansion: Determines if the fan lines are projected past the current bar into the right side expansion <b>(Default is Yes)</b>

#hint Coefficient1: Fan Line 1: Trough to 38.2% retracement on rising fans.  \nPeak to 38.2% Coefficient on falling fans. <b>(Default is 38.2%)</b>

#hint Coefficient_2: Fan Line 2: \nTrough to 50% retracement on rising fans.  \nPeak to 50% Coefficient on falling fans. <b>(Default is 50%)</b>

#hint Coefficient_3: Fan Line 3: \nTrough to 61.8% retracement on rising fans.  \nPeak to 61.8% Coefficient on falling fans. <b>(Default is 61.8%)</b>


#wizard input: Price

#wizard text: Inputs: Price:

#wizard input: onExpansion

#wizard text: onExpansion:

#wizard input: Coefficient1 

#wizard text: Coefficient1 :

#wizard input: Coefficient_2 

#wizard text: Coefficient_2:

#wizard input: Coefficient_3  

#wizard text: Coefficient_3:


input price = close;

input high = high;

input low = low;

input onExpansion = Yes;

input Coefficient1 = .236;

input Coefficient_2 = .382;

input Coefficient_3 = .5;

input Coefficient_4 = .618;

input Coefficient_5 = .786;

input Coefficient_6 = .886;

input Coefficient_7 = 0;


def a = HighestAll(high);

def b = LowestAll(low);

def barnumber = BarNumber();

def c = if high == a then barnumber else Double.NaN;

def d = if low == b then barnumber else Double.NaN;

rec highnumber = CompoundValue(1, if IsNaN(c) then highnumber[1] else c, c);

def highnumberall = HighestAll(highnumber);

rec lownumber = CompoundValue(1, if IsNaN(d) then lownumber[1] else d, d);

def lownumberall = LowestAll(lownumber);


def upward = highnumberall > lownumberall;

def downward = highnumberall < lownumberall;


def low1 =  b + ((b - a) * Coefficient1);

def low2 =  b + ((b - a) * Coefficient_2);

def low3 = b + ((b - a) * Coefficient_3);

def low4 =  b + ((b - a) * Coefficient_4);

def low5 =  b + ((b - a) * Coefficient_5);

def low6 =  b + ((b - a) * Coefficient_6);

def low7 =  b + ((b - a) * Coefficient_7);


def high1 =  a - ((a - b) * Coefficient1);

def high2 =  a - ((a - b) * Coefficient_2);

def high3 = a - ((a - b) * Coefficient_3);

def high4 =  a - ((a - b) * Coefficient_4);

def high5 =  a - ((a - b) * Coefficient_5);

def high6 = a - ((a - b) * Coefficient_6);

def high7 = a - ((a - b) * Coefficient_7);


def x = AbsValue(lownumberall - highnumberall );


def slope = (a - b) / x;

def slope1 = (high1 - b) / x;

def slope2 = (high2 - b) / x;

def slope3 = (high3 - b) / x;

def slope4 = (high4 - b) / x;

def slope5 = (high5 - b) / x;

def slope6 = (high6 - b) / x;

def slope7 = (high7 - b) / x;


def slopelow = (b - a) / x;

def slopelow1 = (low1 - b) / x;

def slopelow2 = (low2 - b) / x;

def slopelow3 = (low3 - b) / x;

def slopelow4 = (low4 - b) / x;

def slopelow5 = (low5 - b) / x;

def slopelow6 = (low6 - b) / x;

def slopelow7 = (low7 - b) / x;

def day = GetDay();

def month = GetMonth();

def year = GetYear();

def lastDay = GetLastDay();

def lastmonth = GetLastMonth();

def lastyear = GetLastYear();

def isToday = If(day == lastDay and month == lastmonth and year == lastyear, 1, 0);

def istodaybarnumber = HighestAll(if isToday then barnumber else Double.NaN);


def line = b + (slope * (barnumber - lownumber));

def line1 = b + (slope1 * (barnumber - lownumber));

def line2 = b + (slope2 * (barnumber - lownumber));

def line3 = b + (slope3 * (barnumber - lownumber));

def line4 = b + (slope4 * (barnumber - lownumber));

def line5 = b + (slope5 * (barnumber - lownumber));

def line6 = b + (slope6 * (barnumber - lownumber));

def line7 = b + (slope7 * (barnumber - lownumber));


def linelow = a + (slopelow * (barnumber - highnumber));

def line1low = a + (slopelow1 * (barnumber - highnumber));

def line2low = a + (slopelow2 * (barnumber - highnumber));

def line3low = a + (slopelow3 * (barnumber - highnumber));

def line4low = a + (slopelow4 * (barnumber - highnumber));

def line5low = a + (slopelow5 * (barnumber - highnumber));

def line6low = a + (slopelow6 * (barnumber - highnumber));

def line7low = a + (slopelow7 * (barnumber - highnumber));


def currentlinelow = if barnumber <= istodaybarnumber then linelow else Double.NaN;

def currentline1low = if barnumber <= istodaybarnumber then line1low else Double.NaN;

def currentline2low = if barnumber <= istodaybarnumber then line2low else Double.NaN;

def currentline3low = if barnumber <= istodaybarnumber then line3low else Double.NaN;

def currentline4low = if barnumber <= istodaybarnumber then line4low else Double.NaN;

def currentline5low = if barnumber <= istodaybarnumber then line5low else Double.NaN;

def currentline6low = if barnumber <= istodaybarnumber then line6low else Double.NaN;

def currentline7low = if barnumber <= istodaybarnumber then line7low else Double.NaN;


def currentline = if barnumber <= istodaybarnumber then line else Double.NaN;

def currentline1 = if barnumber <= istodaybarnumber then line1 else Double.NaN;

def currentline2 = if barnumber <= istodaybarnumber then line2 else Double.NaN;

def currentline3 = if barnumber <= istodaybarnumber then line3 else Double.NaN;

def currentline4 = if barnumber <= istodaybarnumber then line4 else Double.NaN;

def currentline5 = if barnumber <= istodaybarnumber then line5 else Double.NaN;

def currentline6 = if barnumber <= istodaybarnumber then line6 else Double.NaN;

def currentline7 = if barnumber <= istodaybarnumber then line7 else Double.NaN;


plot FibFan =  if  downward and onExpansion then linelow else if downward then currentlinelow else if upward and onExpansion then line else if upward then currentline else Double.NaN;

FibFan.SetStyle(Curve.SHORT_DASH);

FibFan.AssignValueColor(Color.RED);


plot "Coefficient 1" =  if (downward and onExpansion) then line1low else if downward then currentline1low else if upward and onExpansion then line1 else if upward then currentline1 else Double.NaN;

"Coefficient 1".SetStyle(Curve.FIRM);

"Coefficient 1".AssignValueColor(Color.RED);

plot "Coefficient 2" = if downward and onExpansion then line2low else if downward then currentline2low else if upward and onExpansion then line2 else if upward then currentline2 else Double.NaN;

"Coefficient 2".AssignValueColor(Color.RED);

"Coefficient 2".SetStyle(Curve.FIRM);

plot "Coefficient 3" =  if downward and onExpansion then line3low else if downward then currentline3low else if upward and onExpansion then line3 else if upward then currentline3  else Double.NaN;

"Coefficient 3".AssignValueColor(Color.RED);

"Coefficient 3".SetStyle(Curve.FIRM);

plot "Coefficient 4" =  if (downward and onExpansion) then line4low else if downward then currentline4low else if upward and onExpansion then line4 else if upward then currentline4 else Double.NaN;

"Coefficient 4".SetStyle(Curve.FIRM);

"Coefficient 4".AssignValueColor(Color.RED);

plot "Coefficient 5" = if downward and onExpansion then line5low else if downward then currentline5low else if upward and onExpansion then line5 else if upward then currentline5 else Double.NaN;

"Coefficient 5".AssignValueColor(Color.RED);

"Coefficient 5".SetStyle(Curve.FIRM);

plot "Coefficient 6" =  if downward and onExpansion then line6low else if downward then currentline6low else if upward and onExpansion then line6 else if upward then currentline6  else Double.NaN;

"Coefficient 6".AssignValueColor(Color.RED);

"Coefficient 6".SetStyle(Curve.FIRM);

plot "Coefficient 7" =  if downward and onExpansion then line7low else if downward then currentline7low else if upward and onExpansion then line7 else if upward then currentline7  else Double.NaN;

"Coefficient 7".AssignValueColor(Color.RED);

"Coefficient 7".SetStyle(Curve.FIRM);

addCloud("coefficient 1", "coefficient 2", color.light_red);

addCloud("coefficient 2", "coefficient 3", Color.LIGHT_GREEN);

addCloud("coefficient 3", "coefficient 4", Color.LIGHT_ORANGE);

addCloud("coefficient 4", "coefficient 5", Color.CYAN);

addCloud("coefficient 5", "coefficient 6", Color.VIOLET);

addCloud("coefficient 1", "coefficient 7", Color.LIME);


Alert((price crosses below "Coefficient 1") , "Price crosses below Coefficient 1");

Alert((price crosses below "Coefficient 2") , "Price crosses below Coefficient 2");

Alert((price crosses below "Coefficient 3") , "Price crosses below Coefficient 3");

Alert((price crosses above "Coefficient 4") , "Price crosses above Coefficient 1");

Alert((price crosses above "Coefficient 5") , "Price crosses above Coefficient 2");

Alert((price crosses above "Coefficient 6") , "Price crosses above Coefficient 3");

##End##
 
@zeek, See if this modification of one of my scripts helps. I did not include the alerts.


Code:
#FibChoices
#Request usethinkscript.com @theelderwand to duplicate a swimdicators video's chart's indicator
#BLT 20191224


input method = {default aggregation, developing_reg_thrs, developing_ext_thrs, time_range};

input aggregation                        = AggregationPeriod.DAY;
input aggregation_periodsback            = 0;
input aggregation_displayed_in_expansion = no;

input timerange_begin  = 0930;
input timerange_end    = 1030;

input display_upper_extended_fibs = no;
input display_lower_extended_fibs = no;

def hh;
def ll;

switch (method){
case aggregation:
    hh = high(period = aggregation)[aggregation_periodsback];
    ll = low(period = aggregation)[aggregation_periodsback];
case developing_reg_thrs:
    hh = if GetTime() crosses above RegularTradingStart(GetYYYYMMDD()) then high else if GetTime() > RegularTradingStart(GetYYYYMMDD()) and high > hh[1] then high else hh[1];
    ll = if GetTime() crosses above RegularTradingStart(GetYYYYMMDD()) then low else if GetTime() > RegularTradingStart(GetYYYYMMDD()) and low < ll[1] then low else ll[1];
case developing_ext_thrs:
    hh = if GetTime() crosses above RegularTradingEnd(GetYYYYMMDD()) then high else if high > hh[1] then high else hh[1];
    ll = if GetTime() crosses above RegularTradingEnd(GetYYYYMMDD()) then low else if low < ll[1] then low else ll[1];
case time_range:
    hh = if SecondsFromTime(timerange_begin) < 0 then Double.NaN else if SecondsFromTime(timerange_begin) == 0 then high else if SecondsFromTime(timerange_end) <= 0 and high > hh[1] then high else hh[1];
    ll = if SecondsFromTime(timerange_begin) < 0 then Double.NaN else if SecondsFromTime(timerange_begin) == 0 then low else if SecondsFromTime(timerange_end) <= 0 and low < ll[1] then low else ll[1];

}


def range  = hh - ll;
input fib1 = .236;
input fib2 = .382;
input fib3 = .500;
input fib4 = .618;
input fib5 = .764;
def f1   = ll + range * fib1;
def f2   = ll + range * fib2;
def f3   = ll + range * fib3;
def f4   = ll + range * fib4;
def f5   = ll + range * fib5;

def hh1  = if aggregation_displayed_in_expansion and IsNaN(close(period = aggregation)) then hh1[1] else hh;
def ll1  = if aggregation_displayed_in_expansion and IsNaN(close(period = aggregation)) then ll1[1] else ll;
def ff1  = if aggregation_displayed_in_expansion and IsNaN(close(period = aggregation)) then ff1[1]  else f1;
def ff2  = if aggregation_displayed_in_expansion and IsNaN(close(period = aggregation)) then ff2[1]  else f2;
def ff3  = if aggregation_displayed_in_expansion and IsNaN(close(period = aggregation)) then ff3[1]  else f3;
def ff4  = if aggregation_displayed_in_expansion and IsNaN(close(period = aggregation)) then ff4[1]  else f4;
def ff5  = if aggregation_displayed_in_expansion and IsNaN(close(period = aggregation)) then ff5[1]  else f5;

input fib_line_choice = {default horizontal, points, dashes};
def paintingStrategy = if fib_line_choice == fib_line_choice.horizontal then PaintingStrategy.HORIZONTAL else if fib_line_choice == fib_line_choice.points then PaintingStrategy.POINTS else PaintingStrategy.DASHES;

plot hhp = if aggregation_displayed_in_expansion and !IsNaN(close) then Double.NaN else hh1;
hhp.SetPaintingStrategy(paintingStrategy);
hhp.SetDefaultColor(Color.GREEN);
hhp.SetLineWeight(1);

plot llp = if aggregation_displayed_in_expansion and !IsNaN(close) then Double.NaN else ll1;
llp.SetPaintingStrategy(paintingStrategy);
llp.SetDefaultColor(Color.RED);
llp.SetLineWeight(1);

plot f1p = if aggregation_displayed_in_expansion and !IsNaN(close) then Double.NaN else ff1;
f1p.SetPaintingStrategy(paintingStrategy);
f1p.SetDefaultColor(Color.YELLOW);
f1p.SetLineWeight(1);

plot f2p = if aggregation_displayed_in_expansion and !IsNaN(close) then Double.NaN else ff2;
f2p.SetPaintingStrategy(paintingStrategy);
f2p.SetDefaultColor(Color.YELLOW);
f2p.SetLineWeight(1);

plot f3p = if aggregation_displayed_in_expansion and !IsNaN(close) then Double.NaN else ff3;
f3p.SetPaintingStrategy(paintingStrategy);
f3p.SetDefaultColor(Color.WHITE);
f3p.SetLineWeight(1);

plot f4p = if aggregation_displayed_in_expansion and !IsNaN(close) then Double.NaN else ff4;
f4p.SetPaintingStrategy(paintingStrategy);
f4p.SetDefaultColor(Color.YELLOW);
f4p.SetLineWeight(1);

plot f5p = if aggregation_displayed_in_expansion and !IsNaN(close) then Double.NaN else ff5;
f5p.SetPaintingStrategy(paintingStrategy);
f5p.SetDefaultColor(Color.YELLOW);
f5p.SetLineWeight(1);

plot uhhp = if aggregation_displayed_in_expansion and !IsNaN(close) or display_upper_extended_fibs == no then Double.NaN else range + hh1;
uhhp.SetPaintingStrategy(paintingStrategy);
uhhp.SetDefaultColor(Color.GREEN);
uhhp.SetLineWeight(1);

plot uf1p = if aggregation_displayed_in_expansion and !IsNaN(close) or display_upper_extended_fibs == no then Double.NaN else range + ff1;
uf1p.SetPaintingStrategy(paintingStrategy);
uf1p.SetDefaultColor(Color.YELLOW);
uf1p.SetLineWeight(1);

plot uf2p = if aggregation_displayed_in_expansion and !IsNaN(close) or display_upper_extended_fibs == no then Double.NaN else range + ff2;
uf2p.SetPaintingStrategy(paintingStrategy);
uf2p.SetDefaultColor(Color.YELLOW);
uf2p.SetLineWeight(1);

plot uf3p = if aggregation_displayed_in_expansion and !IsNaN(close) or display_upper_extended_fibs == no then Double.NaN else range + ff3;
uf3p.SetPaintingStrategy(paintingStrategy);
uf3p.SetDefaultColor(Color.WHITE);
uf3p.SetLineWeight(1);

plot uf4p = if aggregation_displayed_in_expansion and !IsNaN(close) or display_upper_extended_fibs == no then Double.NaN else range + ff4;
uf4p.SetPaintingStrategy(paintingStrategy);
uf4p.SetDefaultColor(Color.YELLOW);
uf4p.SetLineWeight(1);

plot uf5p = if aggregation_displayed_in_expansion and !IsNaN(close) or display_upper_extended_fibs == no then Double.NaN else range + ff5;
uf5p.SetPaintingStrategy(paintingStrategy);
uf5p.SetDefaultColor(Color.YELLOW);
uf5p.SetLineWeight(1);

plot Lllp = if aggregation_displayed_in_expansion and !IsNaN(close) or display_lower_extended_fibs
== no then Double.NaN else ll - range;
Lllp.SetPaintingStrategy(paintingStrategy);
Lllp.SetDefaultColor(Color.RED);
Lllp.SetLineWeight(1);

plot Lf1p = if aggregation_displayed_in_expansion and !IsNaN(close) or display_lower_extended_fibs == no then Double.NaN else ll - range * fib1;
Lf1p.SetPaintingStrategy(paintingStrategy);
Lf1p.SetDefaultColor(Color.YELLOW);
Lf1p.SetLineWeight(1);

plot Lf2p = if aggregation_displayed_in_expansion and !IsNaN(close) or display_lower_extended_fibs == no then Double.NaN else ll - range * fib2;
Lf2p.SetPaintingStrategy(paintingStrategy);
Lf2p.SetDefaultColor(Color.YELLOW);
Lf2p.SetLineWeight(1);

plot Lf3p = if aggregation_displayed_in_expansion and !IsNaN(close) or display_lower_extended_fibs == no then Double.NaN else ll - range * fib3;
Lf3p.SetPaintingStrategy(paintingStrategy);
Lf3p.SetDefaultColor(Color.WHITE);
Lf3p.SetLineWeight(1);

plot Lf4p = if aggregation_displayed_in_expansion and !IsNaN(close) or display_lower_extended_fibs == no then Double.NaN else ll - range * fib4;
Lf4p.SetPaintingStrategy(paintingStrategy);
Lf4p.SetDefaultColor(Color.YELLOW);
Lf4p.SetLineWeight(1);

plot Lf5p = if aggregation_displayed_in_expansion and !IsNaN(close) or display_lower_extended_fibs == no then Double.NaN else ll - range * fib5;
Lf5p.SetPaintingStrategy(paintingStrategy);
Lf5p.SetDefaultColor(Color.YELLOW);
Lf5p.SetLineWeight(1);

input showchart_bubbles = yes;
input bubble_option     = {default fiblevel, pricelevel};
input bubblemover       = 5; #used to move the bubble left and right
def n   = bubblemover;
def n1  = n + 1;
AddChartBubble(showchart_bubbles and !IsNaN(close[n1]) and IsNaN(close[n]), hhp[n1], if bubble_option == bubble_option.fiblevel then 1 else Round(hhp[n1] * 4, 0) / 4, Color.GRAY, yes);
AddChartBubble(showchart_bubbles and !IsNaN(close[n1]) and IsNaN(close[n]), ff1[n1], if bubble_option == bubble_option.fiblevel then fib1 else Round(f1p[n1] * 4, 0) / 4, Color.GRAY, yes);
AddChartBubble(showchart_bubbles and !IsNaN(close[n1]) and IsNaN(close[n]), ff2[n1], if bubble_option == bubble_option.fiblevel then fib2 else Round(f2p[n1] * 4, 0) / 4, Color.GRAY, yes);
AddChartBubble(showchart_bubbles and !IsNaN(close[n1]) and IsNaN(close[n]), ff3[n1], if bubble_option == bubble_option.fiblevel then fib3 else Round(f3p[n1] * 4, 0) / 4, Color.GRAY, yes);
AddChartBubble(showchart_bubbles and !IsNaN(close[n1]) and IsNaN(close[n]), ff4[n1], if bubble_option == bubble_option.fiblevel then fib4 else Round(f4p[n1] * 4, 0) / 4, Color.GRAY, yes);
AddChartBubble(showchart_bubbles and !IsNaN(close[n1]) and IsNaN(close[n]), ff5[n1], if bubble_option == bubble_option.fiblevel then fib5 else Round(f5p[n1] * 4, 0) / 4, Color.GRAY, yes);
AddChartBubble(showchart_bubbles and !IsNaN(close[n1]) and IsNaN(close[n]), llp[n1], if bubble_option == bubble_option.fiblevel then 0 else Round(llp[n1] * 4, 0) / 4, Color.GRAY, yes);
AddChartBubble(showchart_bubbles and !IsNaN(close[n1]) and IsNaN(close[n]), uf1p[n1], if bubble_option == bubble_option.fiblevel then 1+fib1 else Round(uf1p[n1] * 4, 0) / 4, Color.GRAY, yes);
AddChartBubble(showchart_bubbles and !IsNaN(close[n1]) and IsNaN(close[n]), uf2p[n1], if bubble_option == bubble_option.fiblevel then 1+fib2 else Round(uf2p[n1] * 4, 0) / 4, Color.GRAY, yes);
AddChartBubble(showchart_bubbles and !IsNaN(close[n1]) and IsNaN(close[n]), uf3p[n1], if bubble_option == bubble_option.fiblevel then 1+fib3 else Round(uf3p[n1] * 4, 0) / 4, Color.GRAY, yes);
AddChartBubble(showchart_bubbles and !IsNaN(close[n1]) and IsNaN(close[n]), uf4p[n1], if bubble_option == bubble_option.fiblevel then 1+fib4 else Round(f4p[n1] * 4, 0) / 4, Color.GRAY, yes);
AddChartBubble(showchart_bubbles and !IsNaN(close[n1]) and IsNaN(close[n]), uf5p[n1], if bubble_option == bubble_option.fiblevel then 1+fib5 else Round(uf5p[n1] * 4, 0) / 4, Color.GRAY, yes);
AddChartBubble(showchart_bubbles and !IsNaN(close[n1]) and IsNaN(close[n]), Lf1p[n1], if bubble_option == bubble_option.fiblevel then -fib1 else Round(Lf1p[n1] * 4, 0) / 4, Color.GRAY, yes);
AddChartBubble(showchart_bubbles and !IsNaN(close[n1]) and IsNaN(close[n]), Lf2p[n1], if bubble_option == bubble_option.fiblevel then -fib2 else Round(LF2p[n1] * 4, 0) / 4, Color.GRAY, yes);
AddChartBubble(showchart_bubbles and !IsNaN(close[n1]) and IsNaN(close[n]), Lf3p[n1], if bubble_option == bubble_option.fiblevel then -fib3 else Round(Lf3p[n1] * 4, 0) / 4, Color.GRAY, yes);
AddChartBubble(showchart_bubbles and !IsNaN(close[n1]) and IsNaN(close[n]), Lf4p[n1], if bubble_option == bubble_option.fiblevel then -fib4 else Round(Lf4p[n1] * 4, 0) / 4, Color.GRAY, yes);
AddChartBubble(showchart_bubbles and !IsNaN(close[n1]) and IsNaN(close[n]), Lf5p[n1], if bubble_option == bubble_option.fiblevel then -fib5 else Round(Lf5p[n1] * 4, 0) / 4, Color.GRAY, yes);
AddChartBubble(showchart_bubbles and !IsNaN(close[n1]) and IsNaN(close[n]), uhhp[n1], if bubble_option == bubble_option.fiblevel then 2 else Round(uhhp[n1] * 4, 0) / 4, Color.GRAY, yes);
AddChartBubble(showchart_bubbles and !IsNaN(close[n1]) and IsNaN(close[n]), Lllp[n1], if bubble_option == bubble_option.fiblevel then -1 else Round(Lllp[n1] * 4, 0) / 4, Color.GRAY, yes);

hhp.HideBubble();
llp.HideBubble();
uhhp.HideBubble();
Lllp.HideBubble();
f1p.HideBubble();
f2p.HideBubble();
f3p.HideBubble();
f4p.HideBubble();
f5p.HideBubble();
Lf1p.HideBubble();
Lf2p.HideBubble();
Lf3p.HideBubble();
Lf4p.HideBubble();
Lf5p.HideBubble();
uf1p.HideBubble();
uf2p.HideBubble();
uf3p.HideBubble();
uf4p.HideBubble();
uf5p.HideBubble();
im trying to get the fibs to set up from previous day close through ext hours, premarket to open. any ideas how to make that happen?
 
@Buckbull Interesting. I didn't get as many choices as you gave at the INPUT section. Any reason?

LqMEDaG.png


How to remove the duplicate bubble/label and/or move to the left side of chart? which lines of the threads that are related to them? pls advise

8QVjGF1.png
 
Last edited by a moderator:
@tomsk Is there an update posted with aggregations selection? Would like something to specifically be able to use the W/D time frames fib levels on the hour and minute charts
 
Whats going on I just recently found a code that shows daily swing highs and swing lows and I have an auto fib indicator that I have been fixing up. Was wondering how I could get the fib to auto fit into the swing highs and lows of the first indictor to show me price levels because right now the autofib fits to the random high and low of the time frame I'm on. Thanks!

The swing high code is here:

Code:
def length = 10;
def bn = BarNumber();
def lastBar = HighestAll(if IsNaN(close) then 0 else bn);
def offset = Min(length - 1, lastBar - bn);
def swingLow = low < Lowest(low[1], length - 1) and low == GetValue(Lowest(low, length), -offset);
def swingHigh = high > Highest(high[1], length - 1) and high == GetValue(Highest(high, length), -offset);

#Identify the very last swing low point and 10 previous
def lowPointOneBarNumber = HighestAll(if swingLow then bn else 0);
def lowPointOneValue = if bn == lowPointOneBarNumber then low else lowPointOneValue[1];

def lowPointTwoBarNumber = HighestAll(if swingLow and bn < lowPointOneBarNumber then bn else 0);
def lowPointTwoValue = if bn == lowPointTwoBarNumber then low else lowPointTwoValue[1];

def lowPointThreeBarNumber = HighestAll(if swingLow and bn < lowPointTwoBarNumber then bn else 0);
def lowPointThreeValue = if bn == lowPointThreeBarNumber then low else lowPointThreeValue[1];

def lowPointFourBarNumber = HighestAll(if swingLow and bn < lowPointThreeBarNumber then bn else 0);
def lowPointFourValue = if bn == lowPointFourBarNumber then low else lowPointFourValue[1];

def lowPointFiveBarNumber = HighestAll(if swingLow and bn < lowPointFourBarNumber then bn else 0);
def lowPointFiveValue = if bn == lowPointFiveBarNumber then low else lowPointFiveValue[1];

def lowPointSixBarNumber = HighestAll(if swingLow and bn < lowPointFiveBarNumber then bn else 0);
def lowPointSixValue = if bn == lowPointSixBarNumber then low else lowPointSixValue[1];

def lowPointSevenBarNumber = HighestAll(if swingLow and bn < lowPointSixBarNumber then bn else 0);
def lowPointSevenValue = if bn == lowPointSevenBarNumber then low else lowPointSevenValue[1];

def lowPointEightBarNumber = HighestAll(if swingLow and bn < lowPointSevenBarNumber then bn else 0);
def lowPointEightValue = if bn == lowPointEightBarNumber then low else lowPointEightValue[1];

def lowPointNineBarNumber = HighestAll(if swingLow and bn < lowPointEightBarNumber then bn else 0);
def lowPointNineValue = if bn == lowPointNineBarNumber then low else lowPointNineValue[1];

def lowPointTenBarNumber = HighestAll(if swingLow and bn < lowPointNineBarNumber then bn else 0);
def lowPointTenValue = if bn == lowPointTenBarNumber then low else lowPointTenValue[1];

# Identify the very last swing high point and 10 others
def highPointOneBarNumber = HighestAll(if swingHigh then bn else 0);
def highPointOneValue = if bn == highPointOneBarNumber then high else highPointOneValue[1];

def highPointTwoBarNumber = HighestAll(if swingHigh and bn < highPointOneBarNumber then bn else 0);
def highPointTwoValue = if bn == highPointTwoBarNumber then high else highPointTwoValue[1];

def highPointThreeBarNumber = HighestAll(if swingHigh and bn < highPointTwoBarNumber then bn else 0);
def highPointThreeValue = if bn == highPointThreeBarNumber then high else highPointThreeValue[1];

def highPointFourBarNumber = HighestAll(if swingHigh and bn < highPointThreeBarNumber then bn else 0);
def highPointFourValue = if bn == highPointFourBarNumber then high else highPointFourValue[1];

def highPointFiveBarNumber = HighestAll(if swingHigh and bn < highPointFourBarNumber then bn else 0);
def highPointFiveValue = if bn == highPointFiveBarNumber then high else highPointFiveValue[1];

def highPointSixBarNumber = HighestAll(if swingHigh and bn < highPointFiveBarNumber then bn else 0);
def highPointSixValue = if bn == highPointSixBarNumber then high else highPointSixValue[1];

def highPointSevenBarNumber = HighestAll(if swingHigh and bn < highPointSixBarNumber then bn else 0);
def highPointSevenValue = if bn == highPointSevenBarNumber then high else highPointSevenValue[1];
#
def highPointEightBarNumber = HighestAll(if swingHigh and bn < highPointSevenBarNumber then bn else 0);
def highPointEightValue = if bn == highPointEightBarNumber then high else highPointEightValue[1];

def highPointNineBarNumber = HighestAll(if swingHigh and bn < highPointEightBarNumber then bn else 0);
def highPointNineValue = if bn == highPointNineBarNumber then high else highPointNineValue[1];

def highPointTenBarNumber = HighestAll(if swingHigh and bn < highPointNineBarNumber then bn else 0);
def highPointTenValue = if bn == highPointTenBarNumber then high else highPointTenValue[1];

# ADJUST CANDLE COLORS
AssignPriceColor(if swingLow then Color.cyan else if swingHigh then Color.cyan else Color.current);


The Autofib is here:


input aggregationPeriod = AggregationPeriod.DAY;
def high = high(period = aggregationPeriod);
def low = open(period = aggregationPeriod);
def price = close(period = aggregationPeriod);
input onExpansion = Yes;
input Extend_to_left = no;
input Coefficient0 = 0.000;
input coefficient_1 = .236;
input Coefficient_2 = .382;
input Coefficient_3 = .500;
input Coefficient_4 = .618;
input Coefficient_5 = .786;
input Coefficient_6 = 1.000;
input coefficient_7 = 1.236;
input coefficient_8 = 1.382;
def z = barnumber();
def a = HighestAll(high);
def b = LowestAll(low);
def barnumber = BarNumber();
def c = if high == a then barnumber else Double.NaN;
def d = if low == b then barnumber else Double.NaN;
rec highnumber = CompoundValue(1, if IsNaN(c) then highnumber[1] else c, c);
def highnumberall = HighestAll(highnumber);
rec lownumber = CompoundValue(1, if IsNaN(d) then lownumber[1] else d, d);
def lownumberall = LowestAll(lownumber);

def upward = highnumberall > lownumberall;
def downward = highnumberall < lownumberall;

def x = AbsValue(lownumberall - highnumberall );

def slope = (a - b) / x;
def slopelow = (b - a) / x;

def day = GetDay();
def month = GetMonth();
def year = GetYear();
def lastDay = GetLastDay();
def lastmonth = GetLastMonth();
def lastyear = GetLastYear();
def isToday = If(day == lastDay and month == lastmonth and year == lastyear, 1, 0);
def istodaybarnumber = HighestAll(if isToday then barnumber else Double.NaN);
def line = b + (slope * (barnumber - lownumber));
def linelow = a + (slopelow * (barnumber - highnumber));
def currentlinelow = if barnumber <= lownumberall then linelow else Double.NaN;
def currentline = if barnumber <= highnumberall then line else Double.NaN;

plot FibFan =  if  downward then currentlinelow else if upward then currentline else Double.NaN;
FibFan.SetStyle(Curve.SHORT_DASH);
FibFan.AssignValueColor(Color.green);
FibFan.HideBubble();

def range =  a - b;

plot Retracement0 = if downward and !onExpansion and !Extend_to_left and barnumber >= highnumberall and barnumber <= istodaybarnumber then HighestAll((b + (range *  Coefficient0))) else if upward and !Extend_to_left and !onExpansion and barnumber >= lownumberall and barnumber <= istodaybarnumber then HighestAll(a - (range * Coefficient0)) else if downward and onExpansion and !Extend_to_left and barnumber >= highnumberall then HighestAll((b + (range *  Coefficient0))) else if upward and onExpansion and barnumber >= lownumberall and !Extend_to_left then HighestAll(a - (range * Coefficient0)) else if downward and !onExpansion and Extend_to_left and barnumber <= istodaybarnumber then HighestAll((b + (range *  Coefficient0))) else if upward and Extend_to_left and !onExpansion and barnumber <= istodaybarnumber then HighestAll(a - (range * Coefficient0)) else if downward and onExpansion and Extend_to_left then HighestAll((b + (range *  Coefficient0))) else if upward and onExpansion and Extend_to_left then HighestAll(a - (range * Coefficient0)) else Double.NaN;
Retracement0.AssignValueColor(Color.green);
Retracement0.HideBubble();


plot Retracement1 =  if downward and !onExpansion and !Extend_to_left and barnumber >= highnumberall and barnumber <= istodaybarnumber then HighestAll((b + (range *  coefficient_1))) else if upward and !Extend_to_left and !onExpansion and barnumber >= lownumberall and barnumber <= istodaybarnumber then HighestAll(a - (range * coefficient_1)) else if downward and onExpansion and !Extend_to_left and barnumber >= highnumberall then HighestAll((b + (range *  coefficient_1))) else if upward and onExpansion and barnumber >= lownumberall and !Extend_to_left then HighestAll(a - (range * coefficient_1)) else if downward and !onExpansion and Extend_to_left and barnumber <= istodaybarnumber then HighestAll((b + (range *  coefficient_1))) else if upward and Extend_to_left and !onExpansion and barnumber <= istodaybarnumber then HighestAll(a - (range * coefficient_1)) else if downward and onExpansion and Extend_to_left then HighestAll((b + (range *  coefficient_1))) else if upward and onExpansion and Extend_to_left then HighestAll(a - (range * coefficient_1)) else Double.NaN;
Retracement1.AssignValueColor(Color.green);
Retracement1.HideBubble();


plot Retracement2 = if downward and !onExpansion and !Extend_to_left and barnumber >= highnumberall and barnumber <= istodaybarnumber then HighestAll((b + (range *  Coefficient_2))) else if upward and !Extend_to_left and !onExpansion and barnumber >= lownumberall and barnumber <= istodaybarnumber then HighestAll(a - (range * Coefficient_2)) else if downward and onExpansion and !Extend_to_left and barnumber >= highnumberall then HighestAll((b + (range *  Coefficient_2))) else if upward and onExpansion and barnumber >= lownumberall and !Extend_to_left then HighestAll(a - (range * Coefficient_2)) else if downward and !onExpansion and Extend_to_left and barnumber <= istodaybarnumber then HighestAll((b + (range *  Coefficient_2))) else if upward and Extend_to_left and !onExpansion and barnumber <= istodaybarnumber then HighestAll(a - (range * Coefficient_2)) else if downward and onExpansion and Extend_to_left then HighestAll((b + (range *  Coefficient_2))) else if upward and onExpansion and Extend_to_left then HighestAll(a - (range * Coefficient_2)) else Double.NaN;
Retracement2.AssignValueColor(Color.green);
Retracement2.HideBubble();


plot Retracement3 = if downward and !onExpansion and !Extend_to_left and barnumber >= highnumberall and barnumber <= istodaybarnumber then HighestAll((b + (range *  Coefficient_3))) else if upward and !Extend_to_left and !onExpansion and barnumber >= lownumberall and barnumber <= istodaybarnumber then HighestAll(a - (range * Coefficient_3)) else if downward and onExpansion and !Extend_to_left and barnumber >= highnumberall then HighestAll((b + (range *  Coefficient_3))) else if upward and onExpansion and barnumber >= lownumberall and !Extend_to_left then HighestAll(a - (range * Coefficient_3)) else if downward and !onExpansion and Extend_to_left and barnumber <= istodaybarnumber then HighestAll((b + (range *  Coefficient_3))) else if upward and Extend_to_left and !onExpansion and barnumber <= istodaybarnumber then HighestAll(a - (range * Coefficient_3)) else if downward and onExpansion and Extend_to_left then HighestAll((b + (range *  Coefficient_3))) else if upward and onExpansion and Extend_to_left then HighestAll(a - (range * Coefficient_3)) else Double.NaN;
Retracement3.AssignValueColor(Color.green);
Retracement3.HideBubble();


plot Retracement4 = if downward and !onExpansion and !Extend_to_left and barnumber >= highnumberall and barnumber <= istodaybarnumber then HighestAll((b + (range *  Coefficient_4))) else if upward and !Extend_to_left and !onExpansion and barnumber >= lownumberall and barnumber <= istodaybarnumber then HighestAll(a - (range * Coefficient_4)) else if downward and onExpansion and !Extend_to_left and barnumber >= highnumberall then HighestAll((b + (range *  Coefficient_4))) else if upward and onExpansion and barnumber >= lownumberall and !Extend_to_left then HighestAll(a - (range * Coefficient_4)) else if downward and !onExpansion and Extend_to_left and barnumber <= istodaybarnumber then HighestAll((b + (range *  Coefficient_4))) else if upward and Extend_to_left and !onExpansion and barnumber <= istodaybarnumber then HighestAll(a - (range * Coefficient_4)) else if downward and onExpansion and Extend_to_left then HighestAll((b + (range *  Coefficient_4))) else if upward and onExpansion and Extend_to_left then HighestAll(a - (range * Coefficient_4)) else Double.NaN;
Retracement4.AssignValueColor(Color.green);
Retracement4.HideBubble();


plot Retracement5 = if downward and !onExpansion and !Extend_to_left and barnumber >= highnumberall and barnumber <= istodaybarnumber then HighestAll((b + (range *  Coefficient_5))) else if upward and !Extend_to_left and !onExpansion and barnumber >= lownumberall and barnumber <= istodaybarnumber then HighestAll(a - (range * Coefficient_5)) else if downward and onExpansion and !Extend_to_left and barnumber >= highnumberall then HighestAll((b + (range *  Coefficient_5))) else if upward and onExpansion and barnumber >= lownumberall and !Extend_to_left then HighestAll(a - (range * Coefficient_5)) else if downward and !onExpansion and Extend_to_left and barnumber <= istodaybarnumber then HighestAll((b + (range *  Coefficient_5))) else if upward and Extend_to_left and !onExpansion and barnumber <= istodaybarnumber then HighestAll(a - (range * Coefficient_5)) else if downward and onExpansion and Extend_to_left then HighestAll((b + (range *  Coefficient_5))) else if upward and onExpansion and Extend_to_left then HighestAll(a - (range * Coefficient_5)) else Double.NaN;
Retracement5.AssignValueColor(Color.green);
Retracement5.HideBubble();


plot Retracement6 = if downward and !onExpansion and !Extend_to_left and barnumber >= highnumberall and barnumber <= istodaybarnumber then HighestAll((b + (range *  Coefficient_6))) else if upward and !Extend_to_left and !onExpansion and barnumber >= lownumberall and barnumber <= istodaybarnumber then HighestAll(a - (range * Coefficient_6)) else if downward and onExpansion and !Extend_to_left and barnumber >= highnumberall then HighestAll((b + (range *  Coefficient_6))) else if upward and onExpansion and barnumber >= lownumberall and !Extend_to_left then HighestAll(a - (range * Coefficient_6)) else if downward and !onExpansion and Extend_to_left and barnumber <= istodaybarnumber then HighestAll((b + (range *  Coefficient_6))) else if upward and Extend_to_left and !onExpansion and barnumber <= istodaybarnumber then HighestAll(a - (range * Coefficient_6)) else if downward and onExpansion and Extend_to_left then HighestAll((b + (range *  Coefficient_6))) else if upward and onExpansion and Extend_to_left then HighestAll(a - (range * Coefficient_6)) else Double.NaN;
Retracement6.AssignValueColor(Color.green);
Retracement6.HideBubble();

plot Retracement7 =  if downward and !onExpansion and !Extend_to_left and barnumber >= highnumberall and barnumber <= istodaybarnumber then HighestAll((b + (range *  coefficient_7))) else if upward and !Extend_to_left and !onExpansion and barnumber >= lownumberall and barnumber <= istodaybarnumber then HighestAll(a - (range * coefficient_7)) else if downward and onExpansion and !Extend_to_left and barnumber >= highnumberall then HighestAll((b + (range *  coefficient_7))) else if upward and onExpansion and barnumber >= lownumberall and !Extend_to_left then HighestAll(a - (range * coefficient_7)) else if downward and !onExpansion and Extend_to_left and barnumber <= istodaybarnumber then HighestAll((b + (range *  coefficient_1))) else if upward and Extend_to_left and !onExpansion and barnumber <= istodaybarnumber then HighestAll(a - (range * coefficient_7)) else if downward and onExpansion and Extend_to_left then HighestAll((b + (range *  coefficient_7))) else if upward and onExpansion and Extend_to_left then HighestAll(a - (range * coefficient_7)) else Double.NaN;
Retracement1.AssignValueColor(Color.green);
Retracement1.HideBubble();

Alert((price crosses below Retracement0) , "Price crosses below Retracement Line 0");
Alert((price crosses above Retracement0) , "Price crosses above Retracement Line 0");
Alert((price crosses below Retracement1) , "Price crosses below Retracement Line 1");
Alert((price crosses above Retracement1) , "Price crosses above Retracement Line 1");
Alert((price crosses below Retracement2) , "Price crosses below Retracement Line 2");
Alert((price crosses above Retracement2) , "Price crosses above Retracement Line 2");
Alert((price crosses below Retracement3) , "Price crosses below Retracement Line 3");
Alert((price crosses above Retracement3) , "Price crosses above Retracement Line 3");
Alert((price crosses below Retracement4) , "Price crosses below Retracement Line 4");
Alert((price crosses above Retracement4) , "Price crosses above Retracement Line 4");
Alert((price crosses below Retracement5) , "Price crosses below Retracement Line 5");
Alert((price crosses above Retracement5) , "Price crosses above Retracement Line 5");
Alert((price crosses below Retracement6) , "Price crosses below Retracement Line 6");
Alert((price crosses above Retracement6) , "Price crosses above Retracement Line 6");

addchartbubble(z == highestall(z), retracement6, "100%", color.green, no);
addchartbubble(z == highestall(z), retracement5, "78.6%", color.green, no);
addchartbubble(z == highestall(z), retracement4, "61.8%", color.green, no);
addchartbubble(z == highestall(z), retracement3, "50%", color.green, no);
addchartbubble(z == highestall(z), retracement2, "38.2%", color.green, no);
addchartbubble(z == highestall(z), retracement1, "23.6%", color.green, no);
addchartbubble(z == highestall(z), retracement0, "0%", color.green, no);
addchartbubble(z == highestall(z), retracement7, "123.6%", color.green, no);
 
Great script is there away to include deviation and depth into the script? Or is there a conversion of trading view Auto Fib Retracement thank you @BenTen
 

Similar threads

Not the exact question you're looking for?

Start a new thread and receive assistance from our community.

87k+ Posts
399 Online
Create Post

Similar threads

Similar threads

The Market Trading Game Changer

Join 2,500+ subscribers inside the useThinkScript VIP Membership Club
  • Exclusive indicators
  • Proven strategies & setups
  • Private Discord community
  • ‘Buy The Dip’ signal alerts
  • Exclusive members-only content
  • Add-ons and resources
  • 1 full year of unlimited support

Frequently Asked Questions

What is useThinkScript?

useThinkScript is the #1 community of stock market investors using indicators and other tools to power their trading strategies. Traders of all skill levels use our forums to learn about scripting and indicators, help each other, and discover new ways to gain an edge in the markets.

How do I get started?

We get it. Our forum can be intimidating, if not overwhelming. With thousands of topics, tens of thousands of posts, our community has created an incredibly deep knowledge base for stock traders. No one can ever exhaust every resource provided on our site.

If you are new, or just looking for guidance, here are some helpful links to get you started.

What are the benefits of VIP Membership?
VIP members get exclusive access to these proven and tested premium indicators: Buy the Dip, Advanced Market Moves 2.0, Take Profit, and Volatility Trading Range. In addition, VIP members get access to over 50 VIP-only custom indicators, add-ons, and strategies, private VIP-only forums, private Discord channel to discuss trades and strategies in real-time, customer support, trade alerts, and much more. Learn all about VIP membership here.
How can I access the premium indicators?
To access the premium indicators, which are plug and play ready, sign up for VIP membership here.
Back
Top