
The Advanced Market Forecast indicator is a powerful tool that offers near term trend, intermediate, and momentum oscillator for ThinkorSwim. Similar to RSI and MFI, there will be levels of overbought and oversold. When the stock reaches these levels with the right confirmation, traders can expect a pullback or reversal.
There will be a scanner at the end of this post to help you scan for bullish and bearish signals produced by the Advanced Market Forecast indicator.

Notes:
Shareable Link: https://tos.mx/x1ssTZ
Market Forecast Bullish Scanner
Market Forecast Bearish Scanner
Don't forget to replace MarketForecast with the name of your indicator.
There will be a scanner at the end of this post to help you scan for bullish and bearish signals produced by the Advanced Market Forecast indicator.
Notes:
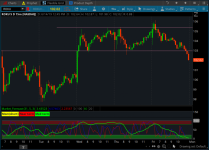
- Green line = Intermediate Confirmation Signal
- Dark blue = Near term line
- Red = Momentum
thinkScript Code
Rich (BB code):
#Name: Dilbert_StanL_MarketForecast_TMF_original
#StudyName: Dilbert_StanL_MarketForecast_TMF_original
#Description: Replica of Investools MarketForecast study
#Author: Dilbert/Stanl/Mobius and assorted others you tried to crack this
#Requested By:
# Ver     Date     Auth      Change
# v2      012817   Dilbert   Finally calculate the momentum line correctly. Scale to 100 instead of 200.
# TOS.mx Link:
# Trading Notes:

# Market Forecast
# StanL
#
#hint:<b>Market Forecast</b>modified with upper and lower reversal zones and labels. Is a double-scale version of the original. All plots maintain their relation with 2X scale.

declare lower;
input ImedLength = 31; # orig std = 31
input MomentumLength = 5; # orig std = 31
input NearLength = 3; # orig std = 3

  def c1I = close - lowest(low,ImedLength);
   def c2I = highest(high,ImedLength) - lowest(low,ImedLength);
   def FastK_I = c1I / c2I * 100;
   def c1N = close - lowest(low,NearLength);
   def c2N = highest(high,NearLength) - lowest(low,NearLength);
   def FastK_N = c1N / c2N * 100;

   def c1M = close - lowest(low,MomentumLength);
   def c2M = highest(high,MomentumLength) - lowest(low,MomentumLength);
   def FastK_M = c1M / c2M * 100;
  Plot Intermediate = Average(FastK_I, 5); #  = TMF's GreenLine
     Intermediate.AssignValueColor(color.Green);
     Intermediate.SetStyle(Curve.FIRM);
     Intermediate.SetLineWeight(2);
   Plot NearTerm = Average(FastK_N, 2);     #  = TMF's BlueLine
     NearTerm.AssignValueColor(color.Blue);
     NearTerm.SetStyle(Curve.FIRM);
     NearTerm.SetLineWeight(1);

def Min1 = Min(low, low[1]);
def Min2 = Min(min1, Min(low[2], low[3]));
def Max1 = Max(high, Max(high[1], Max(high[2], high[3])));

plot momentum = ((close - Min1) / (Max1 - Min2)) * 100;
momentum.setDefaultColor(Color.Red);

plot bottomline = 0;
     bottomline.AssignValueColor(color.gray);
     bottomline.SetStyle(Curve.FIRM);

plot topLine = 100;
     topLine.AssignValueColor(color.gray);
     topLine.SetStyle(Curve.FIRM);

plot UpperRevZone = 80;
     bottomline.AssignValueColor(color.gray);
     bottomline.SetStyle(Curve.FIRM);

plot LowerRevZone = 20;
     LowerRevZone.AssignValueColor(color.gray);
     LowerRevZone.SetStyle(Curve.firm);
plot UpLimit = 120;
     UpLimit.AssignValueColor(color.black);

AddCloud(bottomline, LowerRevZone, color.green, Color.green);
AddCloud(topLine, UpperRevZone, color.RED, color.red);
AddLabel (yes, "Mom(short)", Color.yellow);
AddLabel (yes, "Near term", Color.red);
AddLabel (yes, "Med term", Color.green);

# Below lines are related to a scan
#   def ClusterHigh = Intermediate >= 80 && NearTerm >= 80 && Momentum >= 80 ;
#   def ClusterLow = Intermediate <= 20 && NearTerm <= 20 && Momentum <= 20;
#   plot cluster = if clusterhigh or clusterlow then 1 else 0;
#---------- End Of Code ---------------
Shareable Link: https://tos.mx/x1ssTZ
Market Forecast Bullish Scanner
Rich (BB code):
MarketForecast()."Momentum" crosses above MarketForecast()."NearTerm" and MarketForecast()."NearTerm" crosses above MarketForecast()."Intermediate"Market Forecast Bearish Scanner
Rich (BB code):
MarketForecast()."Momentum" crosses below MarketForecast()."NearTerm" and MarketForecast()."NearTerm" crosses below MarketForecast()."Intermediate"Don't forget to replace MarketForecast with the name of your indicator.
Attachments
Last edited by a moderator: