Consecutive Bar Count Indicator for ThinkorSwim

korygill

Well-known member
VIP
Like roulette in Vegas, the longer the ball keeps landing on Red, the more likely it is to land on Black the next turn, right? Well, in roulette, the odds are the same each turn, but perhaps in the stock market, all trends change at some point. [side note on roulette]

This is also an example of how to count things in thinkscript. If you are new to thinkscript, remember that your code runs on each bar and calculates everything based on that bar and any forward or backward looking values (like close[1] being the close 1 bar in the past). You can also reference the values of your own variables!

CompoundValue is a powerful function, and one you can use to in a couple ways. One way is counting things. That is what I will show here. Search other articles and the documentation for other usages like how to carry a previous value/condition forward until it changes.

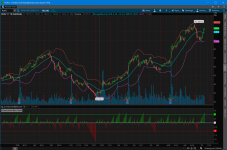
For this example, we will count the number of consecutive up and down bars (based on close) on a chart. This image should give you a clear idea of what we're doing. Perhaps this technique can be applied to other studies and strategies.

8tG1NTF.png


Code for ConsecutiveBarCount

Code:
#
# ConsecutiveBarCount
#
# Study to indicate count consecutive up/down bars.
#
# Author: Kory Gill, @korygill
#
# VERSION HISTORY (sortable date and time (your local time is fine), and your initials
# 20190709-1200-KG    - created
# ...
# ...
#
# Comment out unnecessary portions to preserve TOS memory and enhance speed
#

declare lower;
declare once_per_bar;

#
# Common variables. Using variables reduces calls to TOS iData server.
#

# iData Definitions
#def vHigh = high;
#def initHigh =  CompoundValue(1, high, high);  # creates an initialized variable for high
#def vLow = low;
#def initLow = CompoundValue(1, low, low);
#def vOpen = open;
#def initOpen = CompoundValue(1, open, open);
def vClose = close;
#def initClose = CompoundValue(1, close, close);
#def vVolume = volume;
#def initVolume = CompoundValue(1, volume, volume);
def nan = Double.NaN;

# Bar Time & Date
#def bn = BarNumber();
#def currentBar = HighestAll(if !IsNaN(vHigh) then bn else nan);
#def Today = GetDay() ==GetLastDay();
#def time = GetTime();
#def GlobeX = GetTime() < RegularTradingStart(GetYYYYMMDD());
#def globeX_v2 = if time crosses below RegularTradingEnd(GetYYYYMMDD()) then bn else GlobeX[1];
#def RTS  = RegularTradingStart(GetYYYYMMDD());
#def RTE  = RegularTradingEnd(GetYYYYMMDD());
#def RTH = GetTime() > RegularTradingStart(GetYYYYMMDD());
#def RTH_v2 = if time crosses above RegularTradingStart(GetYYYYMMDD()) then bn else RTH[1];

# Bars that start and end the sessions
#def rthStartBar    = CompoundValue(1,
#                         if   !IsNaN(vClose)
#                         &&   time crosses above RegularTradingStart(GetYYYYMMDD())
#                         then bn
#                         else rthStartBar[1], 0);
#def rthEndBar      = CompoundValue(1,
#                         if   !IsNaN(vClose)
#                         &&   time crosses above RegularTradingEnd(GetYYYYMMDD())
#                         then bn
#                         else rthEndBar[1], 1);
#def globexStartBar = CompoundValue(1,
#                         if   !IsNaN(vClose)
#                         &&   time crosses below RegularTradingEnd(GetYYYYMMDD())
#                         then bn
#                         else globexStartBar[1], 1);
#def rthSession = if bn crosses above rthStartBar #+ barsExtendedBeyondSession
#                    then 1
#                    else if   bn crosses above rthEndBar #+ barsExtendedBeyondSession
#                         then 0
#                    else rthSession[1];

def zeroLine = 0;
plot pZeroLine = zeroLine;
pZeroLine.SetDefaultColor(Color.WHITE);
def upLine = 5;
plot pUpLine = upLine;
pUpLine.SetDefaultColor(Color.GREEN);
def downLine = -5;
plot pDownLine = downLine;
pDownLine.SetDefaultColor(Color.RED);

def barUp = vClose > vClose[1];
def barDown = vClose < vClose[1];

def barUpCount = CompoundValue(1, if barUp then barUpCount[1] + 1 else 0, 0);
plot pBarUpCount = if barUpCount > 0 then barUpCount else nan;
pBarUpCount.SetPaintingStrategy(PaintingStrategy.HISTOGRAM);
pBarUpCount.AssignValueColor(Color.GREEN);

def barDownCount = CompoundValue(1, if barDown then barDownCount[1] - 1 else 0, 0);
plot pBarDownCount = if barDownCount < 0 then barDownCount else nan;
pBarDownCount.SetPaintingStrategy(PaintingStrategy.HISTOGRAM);
pBarDownCount.AssignValueColor(Color.RED);

AddLabel(yes, "Consecutive Bar Count", Color.GRAY);

The secret sauce
def barUpCount = CompoundValue(1, if barUp then barUpCount[1] + 1 else 0, 0);

This statement says...
if the current bar is up
then set barUpCount to the "barUpCount of the previous bar" plus 1
else set barUpCount to zero

For now, don't worry about the first "1," and the last ",0" parts. You will just about always keep those like that and just change the middle part...

So the first UP bar we see is 1. If the next bar is also UP, then we take the previous barUpCount (1) and add 1 to it for 2. If we get a third UP bar, then we take the previous barUpCount (2) and add 1 to it for 3. Once you get this (and don't worry if it takes you a while; I struggled for a bit at first too), you will get an aha moment and this will become a great tool in your thinkscript arsenal.

Shareable link to the image and code
https://tos.mx/eY58Fy
 

Attachments

  • 8tG1NTF.png
    8tG1NTF.png
    552.3 KB · Views: 316
Last edited:
I like this one on the daily/weekly chart. I added this code in for a quick assessment of price difference since last down bar.
Code:
def close_diffpositive = if barUp then close - close[1] else 0;
def totalpositive = compoundvalue ( 1,if barupcount then close_diffpositive + totalpositive[1] else 0,0);
def close_diffnegative = if barDown then (close[1] - close) * -1 else 0;
def totalnegative = CompoundValue(1, if bardowncount then close_diffnegative + totalnegative[1] else 0, 0);
AddChartBubble(1, pBarUpCount,totalpositive, Color.GREEN);
AddChartBubble(1, pBarDownCount, totalnegative, Color.RED);

cmPbp5G.png
 
There might be a way to get various counts using fold or compoundvalue, but I chose to just carry some variables forward and solve that way.

Now you can use a "percent" mode on another lower study to see the percent of time a given count is achieved. This is based on visible data, so the longer the chart, the better the accuracy.

Chart:
JYKHpDi.png


Code:

Code:
#
# ConsecutiveBarCount
#
# Study to indicate count consecutive up/down bars.
#
# Author: Kory Gill, @korygill
#
# VERSION HISTORY (sortable date and time (your local time is fine), and your initials
# 20190709-1200-KG    - created
# 20200218-1200-KG    - added a percent mode to show percent of time a given count is achieved
# ...
#
# Comment out unnecessary portions to preserve TOS memory and enhance speed
#

declare lower;
declare once_per_bar;

input mode = {default histogram, percent};
input hideBarsBefore = 20;

#
# Common variables. Using variables reduces calls to TOS iData server.
#
def vClose = close;
def nan = Double.NaN;
def bn = BarNumber();

#
# Logic for histogram mode
#
def zeroLine = 0;
plot pZeroLine = if mode == mode.histogram then zeroLine else nan;
pZeroLine.SetDefaultColor(Color.WHITE);
def upLine = 5;
plot pUpLine = if mode == mode.histogram then upLine else nan;
pUpLine.SetDefaultColor(Color.GREEN);
def downLine = -5;
plot pDownLine = if mode == mode.histogram then downLine else nan;
pDownLine.SetDefaultColor(Color.RED);

def barUp = vClose > vClose[1];
def barDown = vClose < vClose[1];

def barUpCount = CompoundValue(1, if barUp then barUpCount[1] + 1 else 0, 0);
plot pBarUpCount = if mode == mode.histogram and barUpCount > 0 then barUpCount else nan;
pBarUpCount.SetPaintingStrategy(PaintingStrategy.HISTOGRAM);
pBarUpCount.AssignValueColor(Color.GREEN);

def barDownCount = CompoundValue(1, if barDown then barDownCount[1] - 1 else 0, 0);
plot pBarDownCount = if mode == mode.histogram and barDownCount < 0 then barDownCount else nan;
pBarDownCount.SetPaintingStrategy(PaintingStrategy.HISTOGRAM);
pBarDownCount.AssignValueColor(Color.RED);

AddLabel(yes, "Consecutive Bar Count", Color.GRAY);

#
# Logic for percent mode
#
def p1;
def p2;
def p3;
def p4;
def p5;
def p6;
def n1;
def n2;
def n3;
def n4;
def n5;
def n6;

if (bn == 1) then
{
    p1 = 0;
    p2 = 0;
    p3 = 0;
    p4 = 0;
    p5 = 0;
    p6 = 0;
    n1 = 0;
    n2 = 0;
    n3 = 0;
    n4 = 0;
    n5 = 0;
    n6 = 0;
}
else
{
    if (barUp and barUpCount == 1) then {p1 = p1[1] + 1;} else {p1 = p1[1];}
    if (barUp and barUpCount == 2) then {p2 = p2[1] + 1;} else {p2 = p2[1];}
    if (barUp and barUpCount == 3) then {p3 = p3[1] + 1;} else {p3 = p3[1];}
    if (barUp and barUpCount == 4) then {p4 = p4[1] + 1;} else {p4 = p4[1];}
    if (barUp and barUpCount == 5) then {p5 = p5[1] + 1;} else {p5 = p5[1];}
    if (barUp and barUpCount == 6) then {p6 = p6[1] + 1;} else {p6 = p6[1];}
    if (barDown and barDownCount == -1) then {n1 = n1[1] + 1;} else {n1 = n1[1];}
    if (barDown and barDownCount == -2) then {n2 = n2[1] + 1;} else {n2 = n2[1];}
    if (barDown and barDownCount == -3) then {n3 = n3[1] + 1;} else {n3 = n3[1];}
    if (barDown and barDownCount == -4) then {n4 = n4[1] + 1;} else {n4 = n4[1];}
    if (barDown and barDownCount == -5) then {n5 = n5[1] + 1;} else {n5 = n5[1];}
    if (barDown and barDownCount == -6) then {n6 = n6[1] + 1;} else {n6 = n6[1];}
}

# used for debugging/development
#AddChartBubble(mode == mode.histogram and barUp and barUpCount == 4, barUpCount, p4);
#AddChartBubble(mode == mode.histogram and barUp and barUpCount == 5, barUpCount, p5);

plot ppX =
    if bn > hideBarsBefore and mode == mode.percent and barUp and barUpCount == 1 then p1/(bn-1)*100
    else if bn > hideBarsBefore and mode == mode.percent and barUp and barUpCount == 2 then p2/(bn-1)*100
    else if bn > hideBarsBefore and mode == mode.percent and barUp and barUpCount == 3 then p3/(bn-1)*100
    else if bn > hideBarsBefore and mode == mode.percent and barUp and barUpCount == 4 then p4/(bn-1)*100
    else if bn > hideBarsBefore and mode == mode.percent and barUp and barUpCount == 5 then p5/(bn-1)*100
    else if bn > hideBarsBefore and mode == mode.percent and barUp and barUpCount == 6 then p6/(bn-1)*100
    else if bn > hideBarsBefore and mode == mode.percent and barDown and barDownCount == -1 then n1/(bn-1)*100
    else if bn > hideBarsBefore and mode == mode.percent and barDown and barDownCount == -2 then n2/(bn-1)*100
    else if bn > hideBarsBefore and mode == mode.percent and barDown and barDownCount == -3 then n3/(bn-1)*100
    else if bn > hideBarsBefore and mode == mode.percent and barDown and barDownCount == -4 then n4/(bn-1)*100
    else if bn > hideBarsBefore and mode == mode.percent and barDown and barDownCount == -5 then n5/(bn-1)*100
    else if bn > hideBarsBefore and mode == mode.percent and barDown and barDownCount == -6 then n6/(bn-1)*100
    else nan;
ppX.AssignValueColor(
    if ppX > 20 then color.Gray
    else if ppX > 10 then Color.Yellow
    else if ppx > 5 then Color.Green
    else Color.Magenta);
ppX.SetPaintingStrategy(PaintingStrategy.SQUARES);

plot ppx30 = if mode == mode.percent then 30 else nan;
ppx30.SetDefaultColor(Color.Gray);
plot ppx20 = if mode == mode.percent then 20 else nan;
ppx20.SetDefaultColor(Color.Yellow);
plot ppx10 = if mode == mode.percent then 10 else nan;
ppx10.SetDefaultColor(Color.Green);
plot ppx5 = if mode == mode.percent then 5 else nan;
ppx5.SetDefaultColor(Color.Magenta);
Here is a link to the shared study:
ConsecutiveBarCount_20200218_1200

Enjoy,
Kory Gill, @korygill
 
@korygill thanks so much for the code. Can you please explain it a bit for us non-programmers... if I wanted to see the % of two consecutive up days, where would I find that % on the indicator? And does this segregate % two consecutive up days, and % two consecutive down days, or are both up and down days counted the same when the two days/candles are consecutive? Thanks.
 
Each count is treated as it's own. +1 is a distinct calculation then -1, etc. For the 1yr of CRM, -1 is like 26.9% of all the bars visible. +1 is 27.2. Hover over the rightmost bars and see the value in the study on the title bar for the lower study. There are 5 bars that are +6 for 2.2% of all the bars from the start of the chart to that point in time.
 
def close_diffpositive = if barUp then close - close[1] else 0; def totalpositive = compoundvalue ( 1,if barupcount then close_diffpositive + totalpositive[1] else 0,0); def close_diffnegative = if barDown then (close[1] - close) * -1 else 0; def totalnegative = CompoundValue(1, if bardowncount then close_diffnegative + totalnegative[1] else 0, 0); AddChartBubble(1, pBarUpCount,totalpositive, Color.GREEN); AddChartBubble(1, pBarDownCount, totalnegative, Color.RED); where would I add this ? does not work itself , sorry new guy. 😅 @DeusMecanicus
 
def close_diffpositive = if barUp then close - close[1] else 0; def totalpositive = compoundvalue ( 1,if barupcount then close_diffpositive + totalpositive[1] else 0,0); def close_diffnegative = if barDown then (close[1] - close) * -1 else 0; def totalnegative = CompoundValue(1, if bardowncount then close_diffnegative + totalnegative[1] else 0, 0); AddChartBubble(1, pBarUpCount,totalpositive, Color.GREEN); AddChartBubble(1, pBarDownCount, totalnegative, Color.RED); where would I add this ? does not work itself , sorry new guy. 😅 @DeusMecanicus
Just add it to the bottom of the code in the original post by korygill. It just needs to be after the def barup/bardown and def barupcount/bardowncount since those are referenced in my post.
 
Is it possible to modify this code to show the number of consecutive days the stock opened higher, lower than the previous close, the same way the % frequency was added for the # up/down days with the squares (in the most recent update to the code)? Thanks!
 
Last edited:
@ext99k i think you can do this by changing
def barUp = vClose > vClose[1];
def barDown = vClose < vClose[1];
to
def barUp = vOpen > vClose[1];
def barDown = vOpen < vClose[1];
and using the study on a 1 day chart.

give it a shot, and if it does not work, i can look at the study in the evening when i am free.
 
Gil Morales (one of the O'neil traders) had mentioned one of his indicator/scans was finding stocks that were up 12 out of 15 days or 11 out of 13. Scans for the stocks and watches the consolidation, waiting to buy into to the inevitable next break. I even put the quote into the scan code so you won't forget what its for. Seems like a good idea for spec plays.

Morales Interview


Code:
#Q: I have heard of a buy signal being given if a stock is up in 12 of the past 15 days. Where would the actual entry point be?

#G: I look for 11 out of 13 or 12 out of 15 days up in a row after a breakout. Once the stock does this, I’ll wait #for it to move sideways or perhaps pull back for anywhere from 3-10 days, and once it moves back out through the #top of this little formation I will come into the stock heavily as I add to my original position, or even sometimes #just enter the stock for the first time.


def price= close;

def a = if close > close[1] then 1 else double.nan;
def b = if close[1] > close[2] then 1 else double.nan;
def c = if close[2] > close[3] then 1 else double.nan;
def d = if close[3] > close[4] then 1 else double.nan;
def e = if close[4] > close[5] then 1 else double.nan;
def f = if close[5] > close[6] then 1 else double.nan;
def g = if close[6] > close[7] then 1 else double.nan;
def h = if close[7] > close[8] then 1 else double.nan;
def i = if close[8] > close[9] then 1 else double.nan;
def j = if close[9] > close[10] then 1 else double.nan;
def k = if close[10] > close[11] then 1 else double.nan;
def l = if close[11] > close[12] then 1 else double.nan;
def m = if close[12] > close[13] then 1 else double.nan;
def n = if close[13] > close[14] then 1 else double.nan;
def o = if close[14] > close[15] then 1 else double.nan;

def Gilmo = (a+b+c+d+e+f+g+h+i+j+k+l+m+n+o) >= 12 or (a+b+c+d+e+f+g+h+i+j+k+l+m) >= 13;

def tot = if (a+b+c+d+e+f+g+h+i+j+k+l+m+n+o) >= 12 or (a+b+c+d+e+f+g+h+i+j+k+l+m) >= 13 then GILMO else double.nan;
plot ants = tot;
 
Can someone direct me for a scan that will find stocks that have had a price decline for the last two days in a row?
 
You can create that scan yourself by comparing yesterdays and the day before's closes to current close using Day aggregation...
 
Kory - There is a lot of enthusiasm for your original script. After putting it on a few charts I can see why! Cheers!

There are also a lot of requests for a simple scanner, but I do not see that posted. When you have time, could you make two scanners from your original that would scan for 4 consecutive down and another for 4 consecutive up? That would seem to capture those that have not quite reached your guide of 5 in ether direction?
 
Scanners are "easy" to write from existing studies if you remember the rules. They only have 1 plot, and plot 1 when true and 0 when false. Trimming down the consecutive bar count code significantly yields the following code below that can be used for UP or DOWN scanning. You have to comment out the appropriate plot for the intended direction. Paste that into your Custom scanner and run.

UP
http://tos.mx/PagXIo9
DOWN
http://tos.mx/Tten8g8

CODE
Code:
#
# ConsecutiveBarCount Scanner
#
# Study to indicate count consecutive up/down bars.
#
# Author: Kory Gill, @korygill
#
# VERSION HISTORY (sortable date and time (your local time is fine), and your initials
# 20190709-1200-KG    - created
# 20200218-1200-KG    - added a percent mode to show percent of time a given count is achieved
# 20211006-1800-KG    - make a scanner
# ...
#
# Comment out unnecessary portions to preserve TOS memory and enhance speed
#

declare once_per_bar;

def  UpThreshold = 5;
def  DownThreshold = -5;

#
# Common variables. Using variables reduces calls to TOS iData server.
#
def vClose = close;
def nan = Double.NaN;
def bn = BarNumber();

def barUp = vClose > vClose[1];
def barDown = vClose < vClose[1];

def barUpCount = CompoundValue(1, if barUp then barUpCount[1] + 1 else 0, 0);
def barDownCount = CompoundValue(1, if barDown then barDownCount[1] - 1 else 0, 0);

#
# edit to pick EITHER UP to DOWN Scanner
# use the '#' character to comment out the appropriate line
#

# UP
plot UP = if barUpCount >= UpThreshold then 1 else 0;

# DOWN
#plot DOWN = if barDownCount <= DownThreshold then 1 else 0;


Example UP
BLDhUbA.png


Example DOWN

NnLk7rx.png
 

Join useThinkScript to post your question to a community of 21,000+ developers and traders.

Similar threads

Not the exact question you're looking for?

Start a new thread and receive assistance from our community.

87k+ Posts
514 Online
Create Post

Similar threads

Similar threads

The Market Trading Game Changer

Join 2,500+ subscribers inside the useThinkScript VIP Membership Club
  • Exclusive indicators
  • Proven strategies & setups
  • Private Discord community
  • ‘Buy The Dip’ signal alerts
  • Exclusive members-only content
  • Add-ons and resources
  • 1 full year of unlimited support

Frequently Asked Questions

What is useThinkScript?

useThinkScript is the #1 community of stock market investors using indicators and other tools to power their trading strategies. Traders of all skill levels use our forums to learn about scripting and indicators, help each other, and discover new ways to gain an edge in the markets.

How do I get started?

We get it. Our forum can be intimidating, if not overwhelming. With thousands of topics, tens of thousands of posts, our community has created an incredibly deep knowledge base for stock traders. No one can ever exhaust every resource provided on our site.

If you are new, or just looking for guidance, here are some helpful links to get you started.

What are the benefits of VIP Membership?
VIP members get exclusive access to these proven and tested premium indicators: Buy the Dip, Advanced Market Moves 2.0, Take Profit, and Volatility Trading Range. In addition, VIP members get access to over 50 VIP-only custom indicators, add-ons, and strategies, private VIP-only forums, private Discord channel to discuss trades and strategies in real-time, customer support, trade alerts, and much more. Learn all about VIP membership here.
How can I access the premium indicators?
To access the premium indicators, which are plug and play ready, sign up for VIP membership here.
Back
Top