@halcyonguy You are correct on the description. I've been so deep in the weeds that I just gave the brief pseudo code I was after.
The links helped. Thanks.
Here is what I am trying to do in words:
Every bar there is a buy/sell evaluation done. If the eval is buy, I turn the background green. If it is sell I turn the background red.
The background stays the set color until the condition changes. This may be the next bar or may be many bars later.
The color of the background gives me an easy, visual indication of the potential buy/sell state of the stock. If it is buy, then I go to another set of charts/indicators to do more analysis.
This works pretty well, but sometimes the buy/sell condition gets stale even though it is, for the most part, still in a buy state.
What I am trying to accomplish is to have 2 or 3 background colors that visually indicate how long the stock has been in each state, e.g. for the buy signal green, yellow, light blue. Similar for the sell state.
The length of the freshness of the signals will be a user input.
An example might be: As soon as the buy signal shows and for the next 7 bars, make the background green. For bars 8 - 15 make it yellow. Anything over 15 make it light blue.
To accomplish this, I thought I would be doing a lookback at the finalState[x] variable in the attached. If there is an unbroken streak, then set the background color as defined.
Here's the code that I am using to flag the initial state. There are only 2 background color states, dark green and dark red.
# AsGoodAsItGets Indicator without Arrows
#CSR Buy/Sell Arrows with Short/Long Bubbles
#Developed 4-9-22 First Edition 8-23-22 Revised
#No Arrow Edition 1/1/23
declare upper;
input atrreversal = 2.0;
def priceh = MovingAverage(AverageType.EXPONENTIAL, high, 5);
def pricel = MovingAverage(AverageType.EXPONENTIAL, low, 5);
def EIL = ZigZagHighLow("price h" = priceh, "price l" = pricel, "percentage reversal" = .01, "absolute reversal" = .05, "atr length" = 5, "atr reversal" = atrreversal).lastL;
def EIH = ZigZagHighLow("price h" = priceh, "price l" = pricel, "percentage reversal" = .01, "absolute reversal" = .05, "atr length" = 5, "atr reversal" = atrreversal).lastH;
def prrevbot = EIH;
def prsigdown = EIL;
def state;
state = if !IsNaN(prsigdown) then 1 # new bullish reversal → set to bull
else if !IsNaN(prrevbot) then -1 # new bearish reversal → set to bear
# else 7
else state[1]; # otherwise keep previous state
;
plot signaldown = !IsNaN(EIH);
plot signalrevBot = !IsNaN(EIL);
# For very first bars (no prior state), default to neutral
#def finalState = if !IsNaN(state) then 0 else state;
def finalState = state;
# Background color based on persistent state
AssignBackgroundColor(
if finalState == 1 then Color.DARK_GREEN
else if finalState == -1 then Color.DARK_RED
else Color.CURRENT
# else Color.Blue
);
AddChartBubble(signaldown, high + .01, "Short", Color.RED, yes);
AddChartBubble(signalrevBot, low - .01, "Long", Color.GREEN, no);
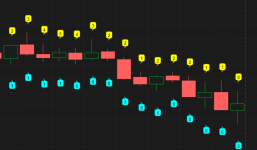
Here is a snapshot of what it looks like when it is in use:
I appreciate your feedback.