Close vs Open For ThinkOrSwim

PonchoMike

Member
VIP
Several years back, I saw a video where someone noted that when the market is bullish, it typically closes higher than it opens. After some thinking, I decided to plot moving averages of the open and closing price on the same chart. I played around with a couple of different moving averages, eventually settling on the 8 and 21 ema. I further refined it by calculating the difference between the two moving averages and making it a histogram.

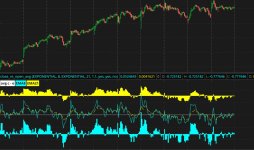
Below is what the chart looks like The blue line is the exponential moving average of the close, the red line is the moving average of the open. The solid lines are based on the 8 ema, the dashed lines are based on the 21 ema.

The first histogram below the curves is the difference between the open and closing price of the 8 ema, the bottom histogram uses the 21 ema.

You can easily scan for the crossing of the open vs close for either moving average. I use it mostly for confirmation that a trend is changing. I think it could be useful to imbed this as part of another indicator to confirm trend changes.

I also attached a screen shot showing how I create the moving average curves.


1749348623437.png

Code:
# This code calculates the difference between two exponential moving averages.
# One moving average is the moving average of the opening price.
# The second moving average is the moving average of the closing price.
# It is bullish when the price closes consistently higher than the open.
# A scan can be easily built to find stocks that transition from negative
# differential to positive differential.

declare lower;

input price1 = close;
input price2 = open;
input length = 8;
input displace = 0;
input showBreakoutSignals = no;

def AvgExp1 = ExpAverage(price1[-displace], length);
def AvgExp2 = ExpAverage(price2[-displace], length);
plot AvgExpdiff = AvgExp1 - AvgExp2;

AvgExpdiff.SetDefaultColor(GetColor(5));
AvgExpdiff.SetPaintingStrategy(PaintingStrategy.HISTOGRAM);
AvgExpdiff.SetLineWeight(3);
AvgExpdiff.DefineColor("Positive and Up", Color.GREEN);
AvgExpdiff.DefineColor("Positive and Down", Color.DARK_GREEN);
AvgExpdiff.DefineColor("Negative and Down", Color.RED);
AvgExpdiff.DefineColor("Negative and Up", Color.DARK_RED);
AvgExpdiff.AssignValueColor(if AvgExpdiff >= 0 then if AvgExpdiff > AvgExpdiff[1] then AvgExpdiff.color("Positive and Up") else AvgExpdiff.color("Positive and Down") else if AvgExpdiff < AvgExpdiff[1] then AvgExpdiff.color("Negative and Down") else AvgExpdiff.color("Negative and Up"));
plot ReferenceLine = 0;
# plot UpSignal = price crosses above AvgExp;
# plot DownSignal = price crosses below AvgExp;
# UpSignal.SetHiding(!showBreakoutSignals);
# DownSignal.SetHiding(!showBreakoutSignals);

# AvgExp.SetDefaultColor(GetColor(1));
# UpSignal.SetDefaultColor(Color.UPTICK);
# UpSignal.SetPaintingStrategy(PaintingStrategy.BOOLEAN_ARROW_UP);
# DownSignal.SetDefaultColor(Color.DOWNTICK);
# DownSignal.SetPaintingStrategy(PaintingStrategy.BOOLEAN_ARROW_DOWN);

1749349149743.png
 
Last edited by a moderator:
here is 1 study that does this,

it is a lower study,
find average of open and close, for 8 and 21
find the difference , subtract open from close, for both
.. plot these 2 lines
draw a histogram for each line,
.. ema8 is cyan , below
.. ema21 is yellow , above
.. the histograms are automatically spaced away from the lines. can adjust the spacing with a factor variable (set to 1.1)

Code:
#close_vs_open_avg
#https://usethinkscript.com/threads/close-vs-open-for-tos.21131/
#Indicator Forums Indicators Custom

declare lower;

def na = double.nan;
def bn = barnumber();
def valid = !isnan(close);

input avg1_type = AverageType.exponential;
input avg1_length = 8;
def avg1o = MovingAverage(avg1_type, open, avg1_length );
def avg1c = MovingAverage(avg1_type, close, avg1_length );
def avg1_diff = avg1c - avg1o;
def x1up = avg1_diff crosses above 0;
def x1dwn = avg1_diff crosses below 0;

input avg2_type = AverageType.exponential;
input avg2_length = 21;
def avg2o = MovingAverage(avg2_type, open, avg2_length );
def avg2c = MovingAverage(avg2_type, close, avg2_length );
def avg2_diff = avg2c - avg2o;
def x2up = avg2_diff crosses above 0;
def x2dwn = avg2_diff crosses below 0;


def hi1 = if bn == 1 then highestall(avg1_diff) else hi1[1];
def lo1 = if bn == 1 then lowestall(avg1_diff) else lo1[1];
def rng1 = hi1 - lo1;

def hi2 = if bn == 1 then highestall(avg2_diff) else hi2[1];
def lo2 = if bn == 1 then lowestall(avg2_diff) else lo2[1];
def rng2 = hi2 - lo2;

input range_factor = 1.1;
def rngx = max(rng1,rng2)*range_factor;


#  avgs
#  blue line is the ma of close
#  red line is the ma of open
#   solid lines , 8 ema
#   dashed lines , 21 ema.

input show_avg1_line = yes;
input show_avg2_line = yes;
plot zavg1 = if show_avg1_line then avg1_diff else na;
plot zavg2 = if show_avg2_line then avg2_diff else na;
zavg1.SetDefaultColor(Color.cyan);
zavg1.setlineweight(1);
zavg1.hidebubble();
zavg2.SetDefaultColor(Color.yellow);
zavg2.setlineweight(1);
zavg2.hidebubble();
zavg2.SetStyle(Curve.MEDIUM_DASH);

plot z0 = if valid then 0 else na;


addlabel(1, "avg c - o", color.white);

addlabel(1,
(if avg1_type == AverageType.Simple then "SMA"
 else if avg1_type == AverageType.exponential then "EMA"
 else if avg1_type == AverageType.hull then "HULL"
 else if avg1_type == AverageType.weighted then "WT"
 else if avg1_type == AverageType.wilders then "WILD"
 else "---") + avg1_length
, color.cyan);

addlabel(1,
(if avg2_type == AverageType.Simple then "SMA"
 else if avg2_type == AverageType.exponential then "EMA"
 else if avg2_type == AverageType.hull then "HULL"
 else if avg2_type == AverageType.weighted then "WT"
 else if avg2_type == AverageType.wilders then "WILD"
 else "---") + avg2_length
, color.yellow);


#avg1_diff  cyan
#avg2_diff  yellow

#def off1 = -5;
def off1 = -rngx/2;
def cond1 = (avg1_diff > 0);
def o1 = off1 + (if cond1 then 0 else avg1_diff);
def c1 = off1 + (if cond1 then avg1_diff else 0);
def h1 = off1 + (if cond1 then avg1_diff else 0);
def l1 = off1 + (if cond1 then 0 else avg1_diff);
AddChart(growColor = Color.cyan, high = h1, low = l1, open = c1, close = o1, type = ChartType.CANDLE);

#def off2 = 2 * off1;
def off2 = -off1;
def cond2 = (avg2_diff > 0);
def o2 = off2 + (if cond2 then 0 else avg2_diff);
def c2 = off2 + (if cond2 then avg2_diff else 0);
def h2 = off2 + (if cond2 then avg2_diff else 0);
def l2 = off2 + (if cond2 then 0 else avg2_diff);
AddChart(growColor = Color.yellow, high = h2, low = l2, open = c2, close = o2, type = ChartType.CANDLE);


input test1_ranges = no;
addlabel(test1_ranges, "R1 " + rng1);
addlabel(test1_ranges, "R2 " + rng2);
addlabel(test1_ranges, "Rx " + rngx);
#
 

Attachments

  • img3.JPG
    img3.JPG
    105.4 KB · Views: 119
I'm sorry, I could have sworn I attached it.

Code:
# This code calculates the difference between two exponential moving averages.
# One moving average is the moving average of the opening price.
# The second moving average is the moving average of the closing price.
# It is bullish when the price closes consistently higher than the open.
# A scan can be easily built to find stocks that transition from negative
# differential to positive differential.

declare lower;

input price1 = close;
input price2 = open;
input length = 8;
input displace = 0;
input showBreakoutSignals = no;

def AvgExp1 = ExpAverage(price1[-displace], length);
def AvgExp2 = ExpAverage(price2[-displace], length);
plot AvgExpdiff = AvgExp1 - AvgExp2;

AvgExpdiff.SetDefaultColor(GetColor(5));
AvgExpdiff.SetPaintingStrategy(PaintingStrategy.HISTOGRAM);
AvgExpdiff.SetLineWeight(3);
AvgExpdiff.DefineColor("Positive and Up", Color.GREEN);
AvgExpdiff.DefineColor("Positive and Down", Color.DARK_GREEN);
AvgExpdiff.DefineColor("Negative and Down", Color.RED);
AvgExpdiff.DefineColor("Negative and Up", Color.DARK_RED);
AvgExpdiff.AssignValueColor(if AvgExpdiff >= 0 then if AvgExpdiff > AvgExpdiff[1] then AvgExpdiff.color("Positive and Up") else AvgExpdiff.color("Positive and Down") else if AvgExpdiff < AvgExpdiff[1] then AvgExpdiff.color("Negative and Down") else AvgExpdiff.color("Negative and Up"));
plot ReferenceLine = 0;
# plot UpSignal = price crosses above AvgExp;
# plot DownSignal = price crosses below AvgExp;
# UpSignal.SetHiding(!showBreakoutSignals);
# DownSignal.SetHiding(!showBreakoutSignals);

# AvgExp.SetDefaultColor(GetColor(1));
# UpSignal.SetDefaultColor(Color.UPTICK);
# UpSignal.SetPaintingStrategy(PaintingStrategy.BOOLEAN_ARROW_UP);
# DownSignal.SetDefaultColor(Color.DOWNTICK);
# DownSignal.SetPaintingStrategy(PaintingStrategy.BOOLEAN_ARROW_DOWN);
 
The chart I show is done in several steps. I use a fast moving average (8 ema) and a slower moving average (21 ema).

1. First, I create the moving averages. I add one exponential moving average based on the opening price, set the line type (solid or dashed), and set the color.
1749512562223.png


2. Next I create a moving average with the same length, but based on the closing price.

1749512633640.png


I like to use the 8 ema's (solid lines, blue and red) and the 21 ema (dashed lines, blue and red). These are all added using the "MovAvgExponential" study.

Then I add the OpenvsCloseDiff study (one for each moving average I want to use).
 
@PonchoMike I wrote essentially the same indicator a while back, but use a more efficient single average calculation that yields the exact same results... The very minor scaling difference is due to the labels on mine...

I'll refrain from posting the code here unless it is requested...

Ruby:
def val = MovingAverage(avgType, close - open, avgLen);

1749516404824.png
 
I mentioned the open vs close indicator on another thread and guthiwari asked me to post the code. Halcyonguy posted a version of code based on the concept as well. Somehow I managed to post images without the code, so I added it. I have no problem if you add your version to this thread.

I'm a hack when it comes to TOS. I know just enough to be dangerous, and I like looking at code written by others to see how it works.
 
Here is my version...

Link: http://tos.mx/!QfkhOUn2

Ruby:
# CODH_Close_Open_Diff_Histogram
# Paints a Histogram  and Average based on the difference between Close and Open
# Created by rad14733 for personal use
# v1.0 : 2025-06-09 : Initial release

declare lower;

input avgLen = 8; # I prefer 5 for scalping
input avgType = AverageType.SIMPLE;
input avgTrend = no;
input showLabels = yes;

def val = MovingAverage(avgType, close - open, avgLen);

DefineGlobalColor("MomoPosUp",Color.GREEN);
DefineGlobalColor("MomoPosDn",Color.DARK_GREEN);
DefineGlobalColor("MomoNegDn",Color.RED);
DefineGlobalColor("MomoNegUp",Color.DARK_RED);

plot ZeroLine = 0;
ZeroLine.SetLineWeight(1);
ZeroLine.SetDefaultColor(Color.WHITE);
ZeroLine.SetPaintingStrategy(PaintingStrategy.LINE);

plot avg = MovingAverage(avgType, val, avgLen);
avg.DefineColor("avgUp", Color.UPTICK);
avg.DefineColor("avgDn", Color.DOWNTICK);
avg.SetLineWeight(2);
avg.SetDefaultColor(Color.ORANGE);
avg.AssignValueColor(if avg > val then avg.Color("avgDn") else avg.Color("avgUp"));

plot Momo = val;
Momo.AssignValueColor(
  if avgTrend and avg > val then Color.RED else if avgTrend and avg < val then Color.GREEN
    else if Momo > Momo[1] and Momo > 0
    then GlobalColor("MomoPosUp")
    else if Momo > 0 and Momo < Momo[1]
    then GlobalColor("MomoPosDn")
    else if Momo < 0 and Momo < Momo[1]
    then GlobalColor("MomoNegDn")
    else GlobalColor("MomoNegUp")
);
Momo.SetPaintingStrategy(PaintingStrategy.HISTOGRAM);
Momo.SetLineWeight(3);

AddLabel(showLabels, " CloseOpenDiff ",
    if avgTrend and avg > val
    then Color.RED
    else if avgTrend and avg < val
    then Color.GREEN
    else if Momo > Momo[1] and Momo > 0
    then GlobalColor("MomoPosUp")
    else if Momo > 0 and Momo < Momo[1]
    then GlobalColor("MomoPosDn")
    else if Momo < 0 and Momo < Momo[1]
    then GlobalColor("MomoNegDn")
    else GlobalColor("MomoNegUp")
);

AddLabel(showLabels, " COD Avg ", if avg > val then avg.Color("avgDn") else avg.Color("avgUp"));

# END - CODH_Close_Open_Diff_Histogram
 
I love it but like everyone I see it a tad differently and just want to see the differential plot - I added a smoothed average but look for cross over of the zeroline to watch and signal for reversals and monitor the plot for exhaustion and weight of change. https://tos.mx/!zlL76cXz

Code:
# MA Diff Spread Indicator - Zero Cross Arrows Only
#https://usethinkscript.com/threads/close-vs-open-for-tos.21131/
#Indicator Forums Indicators Custom
# Enhanced to show directional arrows only on zero line crossovers

declare lower;

input avg1_type = AverageType.EXPONENTIAL;
input avg1_length = 8;
input avg2_type = AverageType.EXPONENTIAL;
input avg2_length = 21;
input plot_diff_between_avgs = yes;
input signalLength = 5;

# Calculate avg1_diff and avg2_diff
def avg1_diff = MovingAverage(avg1_type, close, avg1_length) - MovingAverage(avg1_type, open, avg1_length);
def avg2_diff = MovingAverage(avg2_type, close, avg2_length) - MovingAverage(avg2_type, open, avg2_length);

# Spread between the two MA diffs
def diff_between_avgs = avg1_diff - avg2_diff;

# Main plot
plot diffPlot = if plot_diff_between_avgs then diff_between_avgs else Double.NaN;
diffPlot.SetLineWeight(2);
diffPlot.AssignValueColor(
if diff_between_avgs > diff_between_avgs[1] then Color.MAGENTA
else Color.ORANGE
);

# Zero line
plot ZeroLine = if IsNaN(close) then Double.NaN else 0;
ZeroLine.SetDefaultColor(Color.GRAY);
ZeroLine.SetStyle(Curve.SHORT_DASH);

# Optional smoothed signal line
def signalLine = Average(diff_between_avgs, signalLength);
plot Signal = signalLine;
Signal.SetDefaultColor(Color.LIGHT_GRAY);
Signal.SetStyle(Curve.FIRM);

# === Zero Cross Arrows Only ===
def crossAboveZero = diff_between_avgs crosses above 0;
def crossBelowZero = diff_between_avgs crosses below 0;

plot BullishArrow = if crossAboveZero then diff_between_avgs else Double.NaN;
BullishArrow.SetPaintingStrategy(PaintingStrategy.ARROW_UP);
BullishArrow.SetDefaultColor(Color.GREEN);
BullishArrow.SetLineWeight(2);

plot BearishArrow = if crossBelowZero then diff_between_avgs else Double.NaN;
BearishArrow.SetPaintingStrategy(PaintingStrategy.ARROW_DOWN);
BearishArrow.SetDefaultColor(Color.RED);
BearishArrow.SetLineWeight(2);

# Alerts
Alert(crossAboveZero, "MA Diff Spread Crossed ABOVE Zero", Alert.BAR, Sound.Ring);
Alert(crossBelowZero, "MA Diff Spread Crossed BELOW Zero", Alert.BAR, Sound.Bell);

# Value label
AddLabel(
yes,
"Δ(MA Diff1 - MA Diff2): " + Round(diff_between_avgs, 2),
if diff_between_avgs > 0 then Color.GREEN else Color.RED
);

1749521826705.png
 
Last edited by a moderator:
I love it but like everyone I see it a tad differently and just want to see the differential plot - I added a smoothed average but look for cross over of the zeroline to watch and signal for reversals and monitor the plot for exhaustion and weight of change. https://tos.mx/!zlL76cXz

Code:
# MA Diff Spread Indicator - Zero Cross Arrows Only
#https://usethinkscript.com/threads/close-vs-open-for-tos.21131/
#Indicator Forums Indicators Custom
# Enhanced to show directional arrows only on zero line crossovers

declare lower;

input avg1_type = AverageType.EXPONENTIAL;
input avg1_length = 8;
input avg2_type = AverageType.EXPONENTIAL;
input avg2_length = 21;
input plot_diff_between_avgs = yes;
input signalLength = 5;

# Calculate avg1_diff and avg2_diff
def avg1_diff = MovingAverage(avg1_type, close, avg1_length) - MovingAverage(avg1_type, open, avg1_length);
def avg2_diff = MovingAverage(avg2_type, close, avg2_length) - MovingAverage(avg2_type, open, avg2_length);

# Spread between the two MA diffs
def diff_between_avgs = avg1_diff - avg2_diff;

# Main plot
plot diffPlot = if plot_diff_between_avgs then diff_between_avgs else Double.NaN;
diffPlot.SetLineWeight(2);
diffPlot.AssignValueColor(
if diff_between_avgs > diff_between_avgs[1] then Color.MAGENTA
else Color.ORANGE
);

# Zero line
plot ZeroLine = if IsNaN(close) then Double.NaN else 0;
ZeroLine.SetDefaultColor(Color.GRAY);
ZeroLine.SetStyle(Curve.SHORT_DASH);

# Optional smoothed signal line
def signalLine = Average(diff_between_avgs, signalLength);
plot Signal = signalLine;
Signal.SetDefaultColor(Color.LIGHT_GRAY);
Signal.SetStyle(Curve.FIRM);

# === Zero Cross Arrows Only ===
def crossAboveZero = diff_between_avgs crosses above 0;
def crossBelowZero = diff_between_avgs crosses below 0;

plot BullishArrow = if crossAboveZero then diff_between_avgs else Double.NaN;
BullishArrow.SetPaintingStrategy(PaintingStrategy.ARROW_UP);
BullishArrow.SetDefaultColor(Color.GREEN);
BullishArrow.SetLineWeight(2);

plot BearishArrow = if crossBelowZero then diff_between_avgs else Double.NaN;
BearishArrow.SetPaintingStrategy(PaintingStrategy.ARROW_DOWN);
BearishArrow.SetDefaultColor(Color.RED);
BearishArrow.SetLineWeight(2);

# Alerts
Alert(crossAboveZero, "MA Diff Spread Crossed ABOVE Zero", Alert.BAR, Sound.Ring);
Alert(crossBelowZero, "MA Diff Spread Crossed BELOW Zero", Alert.BAR, Sound.Bell);

# Value label
AddLabel(
yes,
"Δ(MA Diff1 - MA Diff2): " + Round(diff_between_avgs, 2),
if diff_between_avgs > 0 then Color.GREEN else Color.RED
);

View attachment 24927
Your chart looks very interesting. Would you mind sharing a link to that chart?
 

Join useThinkScript to post your question to a community of 21,000+ developers and traders.

Similar threads

Not the exact question you're looking for?

Start a new thread and receive assistance from our community.

87k+ Posts
318 Online
Create Post

Similar threads

Similar threads

The Market Trading Game Changer

Join 2,500+ subscribers inside the useThinkScript VIP Membership Club
  • Exclusive indicators
  • Proven strategies & setups
  • Private Discord community
  • ‘Buy The Dip’ signal alerts
  • Exclusive members-only content
  • Add-ons and resources
  • 1 full year of unlimited support

Frequently Asked Questions

What is useThinkScript?

useThinkScript is the #1 community of stock market investors using indicators and other tools to power their trading strategies. Traders of all skill levels use our forums to learn about scripting and indicators, help each other, and discover new ways to gain an edge in the markets.

How do I get started?

We get it. Our forum can be intimidating, if not overwhelming. With thousands of topics, tens of thousands of posts, our community has created an incredibly deep knowledge base for stock traders. No one can ever exhaust every resource provided on our site.

If you are new, or just looking for guidance, here are some helpful links to get you started.

What are the benefits of VIP Membership?
VIP members get exclusive access to these proven and tested premium indicators: Buy the Dip, Advanced Market Moves 2.0, Take Profit, and Volatility Trading Range. In addition, VIP members get access to over 50 VIP-only custom indicators, add-ons, and strategies, private VIP-only forums, private Discord channel to discuss trades and strategies in real-time, customer support, trade alerts, and much more. Learn all about VIP membership here.
How can I access the premium indicators?
To access the premium indicators, which are plug and play ready, sign up for VIP membership here.
Back
Top