
Author Message : - With Diversions
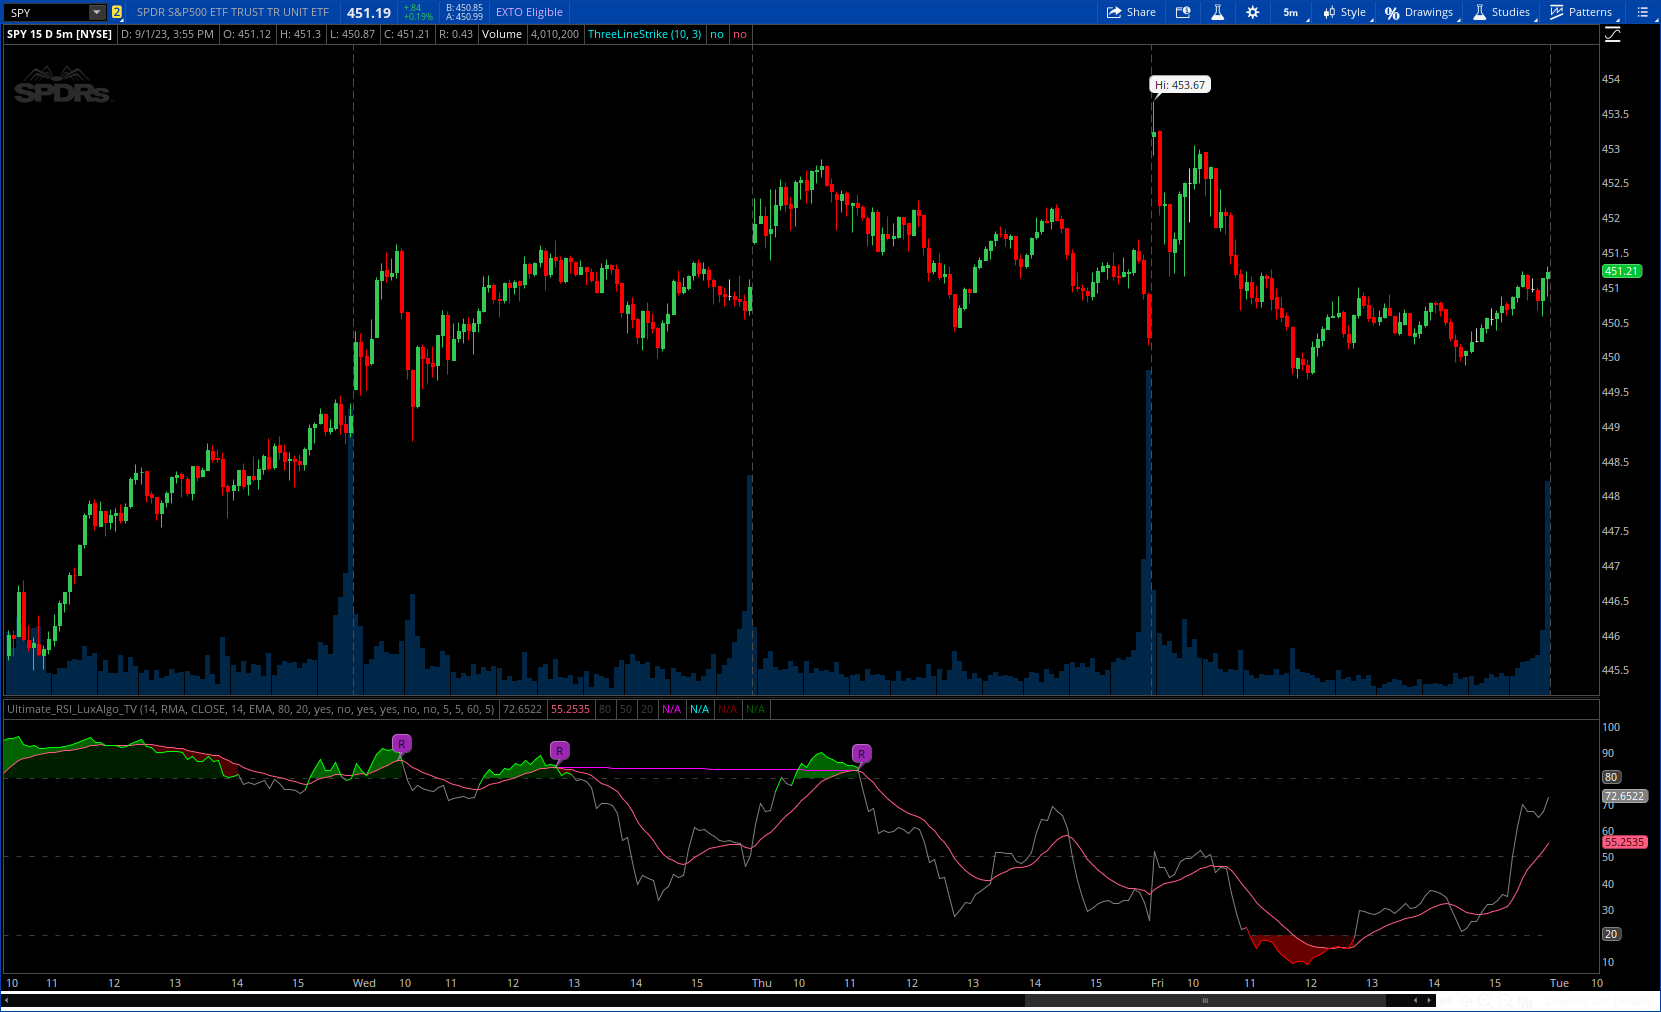
The Ultimate RSI indicator is a new oscillator based on the calculation of the Relative Strength Index that aims to put more emphasis on the trend, thus having a less noisy output. Opposite to the regular RSI, this oscillator is designed for a trend trading approach instead of a contrarian one.
CODE:
CSS:
#// This work is licensed under a Attribution-NonCommercial-ShareAlike 4.0 International
#// © LuxAlgo
#indicator("Ultimate RSI [LuxAlgo]", "LuxAlgo - Ultimate RSI")
# Converted and mod by Sam4Cok@Samer800    - 09/2023

declare lower;

input length = 14;
input method = {EMA, SMA, default RMA, TMA};    # 'Method'
input Source = close;                           # 'Source'
input smooth = 14;                              # 'Signal Line'
input smoothingType = {default EMA, SMA,  RMA, TMA}; # 'Signal Line'
input Overbought = 80;        # 'Overbought'
input Oversold   = 20;        # 'Oversold    '

def na = Double.NaN;
def last = isNaN(close);
#//Functions
script ma {
    input x = close;
    input len = 14;
    input maType = "TMA";
    def ma = if maType == "EMA" then ExpAverage(x, len) else
             if maType == "SMA" then Average(x, len) else
             if maType == "RMA" then WildersAverage(x, len) else
             if maType == "TMA" then Average(Average(x, len), len) else ma[1];
    plot out = ma;
}
#//Augmented RSI
def upper = Highest(Source, length);
def lower = Lowest(Source, length);
def r = upper - lower;

def d = Source - Source[1];
def diff = if upper > upper[1] then r else
           if lower < lower[1] then -r else d;
def absDiff = AbsValue(diff);
def num = ma(diff, length, method);
def den = ma(absDiff, length, method);
def arsi = num / den * 50 + 50;

def signal = ma(arsi, smooth, smoothingType);

def css = if arsi > Overbought then 1 else
          if arsi < Oversold then -1 else 0;

def max = max(signal,Overbought);
def min = min(signal,Oversold);

#//Plots
plot plot_rsi = arsi;#, 'Ultimate RSI'
plot_rsi.AssignValueColor(if css > 0 then Color.GREEN else
                          if css < 0 then Color.RED else Color.GRAY);

plot SigLine = signal;#, 'Signal Line'
SigLine.SetDefaultColor(GetColor(2));
#//Levels
plot plot_up = if last then na else Overbought;
plot plot_avg = if last then na else 50;
plot plot_dn = if last then na else Oversold;

plot_up.SetDefaultColor(Color.DARK_GRAY);
plot_avg.SetDefaultColor(Color.DARK_GRAY);
plot_dn.SetDefaultColor(Color.DARK_GRAY);
plot_up.SetStyle(Curve.SHORT_DASH);
plot_avg.SetStyle(Curve.SHORT_DASH);
plot_dn.SetStyle(Curve.SHORT_DASH);
#//OB-OS
AddCloud(if css > 0 then plot_rsi else na, plot_up, Color.DARK_GREEN);
AddCloud(if css < 0 then plot_dn else na, plot_rsi, Color.DARK_RED);

AddCloud(if css > 0 then plot_rsi else na, max, Color.GREEN);
AddCloud(if css < 0 then min else na, plot_rsi, Color.RED);

#----Div-----------
input ShowLastDivLines = yes;
input ShowLastHiddenDivLines = no;
input DivBull = no;      # "Plot Bullish"
input DivBear = no;      # "Plot Bearish"
input DivHiddenBull = no; # "Plot Hidden Bullish"
input DivHiddenBear = no; # "Plot Hidden Bearish"
input LookBackRight  = 5; # "Pivot Lookback Right"
input LookBackLeft  = 5;  # "Pivot Lookback Left"
input MaxLookback = 60;   # "Max of Lookback Range"
input MinLookback = 5;    # "Min of Lookback Range"

def divSrc = signal;

def h = high;
def l = low;

script FindPivots {
    input dat = close; # default data or study being evaluated
    input HL  = 0;    # default high or low pivot designation, -1 low, +1 high
    input lbL  = 5;    # default Pivot Lookback Left
    input lbR  = 1;    # default Pivot Lookback Right
    ##############
    def _nan;    # used for non-number returns
    def _BN;     # the current barnumber
    def _VStop;  # confirms that the lookforward period continues the pivot trend
    def _V;      # the Value at the actual pivot point
    ##############
    _BN  = BarNumber();
    _nan = Double.NaN;
    _VStop = if !isNaN(dat) and lbr > 0 and lbl > 0 then
                fold a = 1 to lbR + 1 with b=1 while b do
                    if HL > 0 then dat > GetValue(dat,-a) else dat < GetValue(dat,-a) else _nan;
   if (HL > 0) {
        _V = if _BN > lbL + 1 and dat == Highest(dat, lbL + 1) and _VStop
            then dat else _nan;
    } else {
        _V = if _BN > lbL + 1 and dat == Lowest(dat, lbL + 1) and _VStop
            then dat else _nan;
    }
    plot result = if !IsNaN(_V) and _VStop then _V else _nan;
}
#_inRange(cond) =>
script _inRange {
    input cond = yes;
    input rangeUpper = 60;
    input rangeLower = 5;
        def bars = if cond then 0 else bars[1] + 1;
        def inrange =  (rangeLower <= bars) and (bars <= rangeUpper);
plot retrun = inRange;
}
def pl_ = findpivots(divSrc,-1, LookBackLeft, LookBackRight);
def ph_ = findpivots(divSrc, 1, LookBackLeft, LookBackRight);
def pl = !isNaN(pl_);
def ph = !isNaN(ph_);
def pll = lowest(divSrc,LookBackLeft);
def phh = highest(divSrc,LookBackLeft);
def sll = lowest(l, LookBackLeft);
def shh = highest(h, LookBackLeft);
#-- Pvt Low
def plStart  = if pl then yes else plStart[1];
def plFound  = if (plStart and pl) then 1 else 0;
def vlFound1 = if plFound then divSrc else vlFound1[1];
def vlFound_ = if vlFound1!=vlFound1[1] then vlFound1[1] else vlFound_[1];
def vlFound  = if !vlFound_ then pll else vlFound_;
def plPrice1 = if plFound then l else plPrice1[1];
def plPrice_ = if plPrice1!=plPrice1[1] then plPrice1[1] else plPrice_[1];
def plPrice  = if !plPrice_ then sll else plPrice_;
#-- Pvt High
def phStart = if ph then yes else phStart[1];
def phFound = if (phStart and ph) then 1 else 0;
def vhFound1 = if phFound then divSrc else vhFound1[1];
def vhFound_ = if vhFound1!=vhFound1[1] then vhFound1[1] else vhFound_[1];
def vhFound = if !vhFound_ then phh else vhFound_;
def phPrice1 = if phFound then h else phPrice1[1];
def phPrice_ = if phPrice1!=phPrice1[1] then phPrice1[1] else phPrice_[1];
def phPrice = if !phPrice_ then sll else phPrice_;
#// Regular Bullish
def inRangePl = _inRange(plFound[1],MaxLookback,MinLookback);
def oscHL = divSrc > vlFound and inRangePl;
def priceLL = l < plPrice and divSrc <= 40;
def bullCond = plFound and oscHL and priceLL;
#// Hidden Bullish
def oscLL = divSrc < vlFound and inRangePl;
def priceHL = l > plPrice and divSrc <= 50;
def hiddenBullCond = plFound and oscLL and priceHL;
#// Regular Bearish
def inRangePh = _inRange(phFound[1],MaxLookback,MinLookback);
def oscLH   = divSrc < vhFound and inRangePh;
def priceHH = h > phPrice and divSrc >= 60;;
def bearCond = phFound and oscLH and priceHH;
#// Hidden Bearish
def oscHH = divSrc > vhFound and inRangePh;
def priceLH = h < phPrice and divSrc >= 50;
def hiddenBearCond = phFound and oscHH and priceLH;

#------ Bubbles
def bullBub  = DivBull and bullCond;
def HbullBub = DivHiddenBull and hiddenBullCond;
def bearBub  = DivBear and bearCond;
def HbearBub = DivHiddenBear and hiddenBearCond;

addchartbubble(bullBub, divSrc, "R", color.GREEN, no);
addchartbubble(bearBub, divSrc, "R", CreateColor(156,39,176), yes);
addchartbubble(HbullBub, divSrc, "H", color.DARK_green, no);
addchartbubble(HbearBub, divSrc, "H", color.DARK_red, yes);

##### Lines
def bar = BarNumber();
#-- Bear Line
def lastPhBar = if ph then bar else lastPhBar[1];
def prePhBar = if lastPhBar!=lastPhBar[1] then lastPhBar[1] else prePhBar[1];
def priorPHBar = if bearCond then prePhBar else priorPHBar[1];
#-- Bull Line
def lastPlBar = if pl then bar else lastPlBar[1];
def prePlBar = if lastPlBar!=lastPlBar[1] then lastPlBar[1] else prePlBar[1];
def priorPLBar = if bullCond then prePlBar else priorPLBar[1];


def lastBullBar = if bullCond then bar else lastBullBar[1];
def lastBearBar = if bearCond then bar else lastBearBar[1];

def HighPivots = ph and bar >= HighestAll(priorPHBar) and bar <= HighestAll(lastBearBar);
def LowPivots  = pl and bar >= HighestAll(priorPLBar) and bar <= HighestAll(lastBullBar);

def pivotHigh = if HighPivots then divSrc else na;
def pivotLow  = if LowPivots  then divSrc else na;

plot PlotHline = if ShowLastDivLines then pivotHigh else na;
PlotHline.EnableApproximation();
PlotHline.SetDefaultColor(Color.MAGENTA);

plot PlotLline = if ShowLastDivLines then pivotLow else na;
PlotLline.EnableApproximation();
PlotLline.SetDefaultColor(Color.CYAN);

#--- Hidden Lines
#-- Bear Line
def priorHPHBar = if hiddenBearCond then prePhBar else priorHPHBar[1];
#-- Bull Line
def priorHPLBar = if hiddenBullCond then prePlBar else priorHPLBar[1];

def lastHBullBar = if hiddenBullCond then bar else lastHBullBar[1];
def lastHBearBar = if hiddenBearCond then bar else lastHBearBar[1];

def HighHPivots = ph and bar >= HighestAll(priorHPHBar) and bar <= HighestAll(lastHBearBar);
def LowHPivots  = pl and bar >= HighestAll(priorHPLBar) and bar <= HighestAll(lastHBullBar);

def pivotHidHigh = if HighHPivots then divSrc else na;
def pivotHidLow  = if LowHPivots  then divSrc else na;

plot PlotHBearline = if ShowLastHiddenDivLines then pivotHidHigh else na;
PlotHBearline.EnableApproximation();
PlotHBearline.SetDefaultColor(Color.DARK_RED);

plot PlotHBullline = if ShowLastHiddenDivLines then pivotHidLow else na;
PlotHBullline.EnableApproximation();
PlotHBullline.SetDefaultColor(Color.DARK_GREEN);


#-- END of CODE")

 Yes, good idea! Will let you know how it goes.