
mod note:
Author states:
This is my version of a Value Charts Indicator
The VCI identify areas of relative high and low value that provide low-risk entry opportunities and turning points that can be traded in all timeframes.
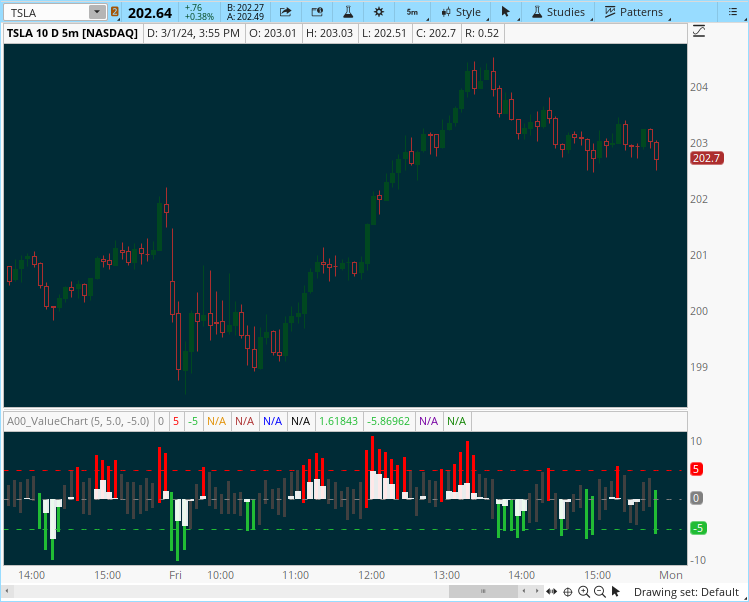
You can use the indicator as confirmation indicator based on your trading style.
CODE :
updated version from @SleepyZ can be found:
https://usethinkscript.com/threads/value-chart-indicator-for-thinkorswim.12423/#post-138932
Author states:
This is my version of a Value Charts Indicator
The VCI identify areas of relative high and low value that provide low-risk entry opportunities and turning points that can be traded in all timeframes.
You can use the indicator as confirmation indicator based on your trading style.
CODE :
CSS:
#https://www.tradingview.com/script/ryWO2cGg-Value-Chart/
#study   (title="Value Chart",shorttitle="VC",overlay=false)
## Converted and mod by Sam4Cok@ 08/2022 ##

declare lower;
#### Input ###
input length  =   5; # 'Length'
input sigTop  =   5.0; # 'Top Line'
input sigBot  =  -5.0; # 'Bottom Line'

def na = Double.NaN;
#prev(s,i) =>
script prev {
    input s = close;
    input i = 0;
    def y = AbsValue(Round(i, 0));
    def prev = s[y];
    plot return = prev;
}
def varp    =   Round(length / 5, 0);
def h_f     =   length > 7;

###### Calculation
def vara   = If(h_f, Highest(high, varp) - Lowest(low, varp), 0);
def varr1  = If(h_f, If(vara == 0 and varp == 1, AbsValue(close - prev(close, -varp)), vara), 0);
def varb   = If(h_f, prev(Highest(high, varp), -varp + 1) - prev(Lowest(low, varp), -varp), 0);
def varr2  = If(h_f, If(varb == 0 and varp == 1, AbsValue( prev(close, -varp) - prev(close, -varp * 2) ), varb), 0);
def varc   = If(h_f, prev(Highest(high, varp), -varp * 2) - prev(Lowest(low, varp), -varp * 2), 0);
def varr3  = If(h_f, If(varc == 0 and varp == 1, AbsValue(prev(close, -varp * 2) - prev(close, -varp * 3)), varc), 0);
def vard   = If (h_f, prev(Highest(high, varp), -varp * 3) - prev(Lowest(low, varp), -varp * 3), 0);
def varr4  = If(h_f, If(vard == 0 and varp == 1, AbsValue(prev(close, -varp * 3) - prev(close, -varp * 4)), vard), 0);
def vare   = If(h_f,  prev(Highest(high, varp), -varp * 4) - prev(Lowest(low, varp), -varp * 4), 0);
def varr5  = If(h_f, If(vare == 0 and varp == 1, AbsValue(prev(close, -varp * 4) - prev(close, -varp * 5)), vare), 0);
def cdelta = AbsValue(close - prev(close, -1));
def var0   = If(!h_f, If((cdelta > (high - low)) or (high == low), cdelta, (high - low)), 0);
def lrange = If(h_f, ((varr1 + varr2 + varr3 + varr4 + varr5) / 5) * .2, SimpleMovingAvg(var0, 5) * .2);

def mba     =   SimpleMovingAvg( (high + low) / 2, length);
def vhigh   =   (high - mba) / lrange;
def vlow    =   (low - mba) / lrange;

def obos   = if vhigh >= sigTop then 1 else
             if vlow  <= sigBot then -1 else 0;

plot ZeroLine  = 0;
ZeroLine.SetDefaultColor(Color.GRAY);
ZeroLine.SetStyle(Curve.SHORT_DASH);

plot top_l   =  sigTop;
top_l.SetDefaultColor(Color.RED);
top_l.SetStyle(Curve.SHORT_DASH);
plot bot_l   =  sigBot;
bot_l.SetDefaultColor(CreateColor(33, 188, 52));
bot_l.SetStyle(Curve.SHORT_DASH);


plot high1 = if vhigh > 0 then na else vhigh;
high1.SetPaintingStrategy(PaintingStrategy.SQUARED_HISTOGRAM);
high1.AssignValueColor(Color.WHITE);
plot high2 = if vhigh > 0 then na else vhigh;
high2.SetPaintingStrategy(PaintingStrategy.SQUARED_HISTOGRAM);
high2.AssignValueColor(Color.WHITE);

plot low1  = if vlow < 0 then na else vlow;
low1.SetPaintingStrategy(PaintingStrategy.SQUARED_HISTOGRAM);
low1.AssignValueColor( Color.WHITE);
plot low2  = if vlow < 0 then na else vlow;
low2.SetPaintingStrategy(PaintingStrategy.SQUARED_HISTOGRAM);
low2.AssignValueColor( Color.WHITE);

plot vHiHis1 = if obos == 0 then na else vhigh;
vHiHis1.SetLineWeight(3);
vHiHis1.SetPaintingStrategy(PaintingStrategy.HISTOGRAM);
vHiHis1.AssignValueColor(if obos > 0 then Color.RED else CreateColor(33, 188, 52));

plot vLoHis1 = if obos == 0 then na else vlow;
vLoHis1.SetLineWeight(3);
vLoHis1.SetPaintingStrategy(PaintingStrategy.HISTOGRAM);
vLoHis1.AssignValueColor( if obos > 0 then Color.RED else CreateColor(33, 188, 52));

plot vHiHis2 = if obos == 0 then vhigh else na;
vHiHis2.SetLineWeight(3);
vHiHis2.SetPaintingStrategy(PaintingStrategy.HISTOGRAM);
vHiHis2.AssignValueColor(Color.DARK_GRAY);
plot vLoHis2 = if obos == 0 then vlow else na;
vLoHis2.SetLineWeight(3);
vLoHis2.SetPaintingStrategy(PaintingStrategy.HISTOGRAM);
vLoHis2.AssignValueColor(Color.DARK_GRAY);

#-- END
Last edited by a moderator: