Value Chart Indicator for ThinkOrSwim

samer800

Moderator - Expert
VIP
Lifetime
mod note:

Author states:
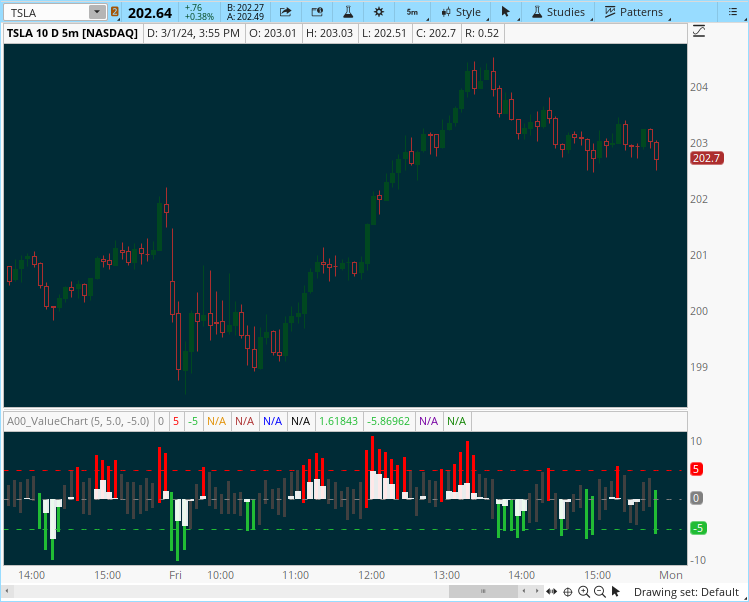
This is my version of a Value Charts Indicator
The VCI identify areas of relative high and low value that provide low-risk entry opportunities and turning points that can be traded in all timeframes.
ZSfC2nO.png

You can use the indicator as confirmation indicator based on your trading style.

CODE :

CSS:
#https://www.tradingview.com/script/ryWO2cGg-Value-Chart/
#study   (title="Value Chart",shorttitle="VC",overlay=false)
## Converted and mod by Sam4Cok@ 08/2022 ##

declare lower;
#### Input ###
input length  =   5; # 'Length'
input sigTop  =   5.0; # 'Top Line'
input sigBot  =  -5.0; # 'Bottom Line'

def na = Double.NaN;
#prev(s,i) =>
script prev {
    input s = close;
    input i = 0;
    def y = AbsValue(Round(i, 0));
    def prev = s[y];
    plot return = prev;
}
def varp    =   Round(length / 5, 0);
def h_f     =   length > 7;

###### Calculation
def vara   = If(h_f, Highest(high, varp) - Lowest(low, varp), 0);
def varr1  = If(h_f, If(vara == 0 and varp == 1, AbsValue(close - prev(close, -varp)), vara), 0);
def varb   = If(h_f, prev(Highest(high, varp), -varp + 1) - prev(Lowest(low, varp), -varp), 0);
def varr2  = If(h_f, If(varb == 0 and varp == 1, AbsValue( prev(close, -varp) - prev(close, -varp * 2) ), varb), 0);
def varc   = If(h_f, prev(Highest(high, varp), -varp * 2) - prev(Lowest(low, varp), -varp * 2), 0);
def varr3  = If(h_f, If(varc == 0 and varp == 1, AbsValue(prev(close, -varp * 2) - prev(close, -varp * 3)), varc), 0);
def vard   = If (h_f, prev(Highest(high, varp), -varp * 3) - prev(Lowest(low, varp), -varp * 3), 0);
def varr4  = If(h_f, If(vard == 0 and varp == 1, AbsValue(prev(close, -varp * 3) - prev(close, -varp * 4)), vard), 0);
def vare   = If(h_f,  prev(Highest(high, varp), -varp * 4) - prev(Lowest(low, varp), -varp * 4), 0);
def varr5  = If(h_f, If(vare == 0 and varp == 1, AbsValue(prev(close, -varp * 4) - prev(close, -varp * 5)), vare), 0);
def cdelta = AbsValue(close - prev(close, -1));
def var0   = If(!h_f, If((cdelta > (high - low)) or (high == low), cdelta, (high - low)), 0);
def lrange = If(h_f, ((varr1 + varr2 + varr3 + varr4 + varr5) / 5) * .2, SimpleMovingAvg(var0, 5) * .2);

def mba     =   SimpleMovingAvg( (high + low) / 2, length);
def vhigh   =   (high - mba) / lrange;
def vlow    =   (low - mba) / lrange;

def obos   = if vhigh >= sigTop then 1 else
             if vlow  <= sigBot then -1 else 0;

plot ZeroLine  = 0;
ZeroLine.SetDefaultColor(Color.GRAY);
ZeroLine.SetStyle(Curve.SHORT_DASH);

plot top_l   =  sigTop;
top_l.SetDefaultColor(Color.RED);
top_l.SetStyle(Curve.SHORT_DASH);
plot bot_l   =  sigBot;
bot_l.SetDefaultColor(CreateColor(33, 188, 52));
bot_l.SetStyle(Curve.SHORT_DASH);


plot high1 = if vhigh > 0 then na else vhigh;
high1.SetPaintingStrategy(PaintingStrategy.SQUARED_HISTOGRAM);
high1.AssignValueColor(Color.WHITE);
plot high2 = if vhigh > 0 then na else vhigh;
high2.SetPaintingStrategy(PaintingStrategy.SQUARED_HISTOGRAM);
high2.AssignValueColor(Color.WHITE);

plot low1  = if vlow < 0 then na else vlow;
low1.SetPaintingStrategy(PaintingStrategy.SQUARED_HISTOGRAM);
low1.AssignValueColor( Color.WHITE);
plot low2  = if vlow < 0 then na else vlow;
low2.SetPaintingStrategy(PaintingStrategy.SQUARED_HISTOGRAM);
low2.AssignValueColor( Color.WHITE);

plot vHiHis1 = if obos == 0 then na else vhigh;
vHiHis1.SetLineWeight(3);
vHiHis1.SetPaintingStrategy(PaintingStrategy.HISTOGRAM);
vHiHis1.AssignValueColor(if obos > 0 then Color.RED else CreateColor(33, 188, 52));

plot vLoHis1 = if obos == 0 then na else vlow;
vLoHis1.SetLineWeight(3);
vLoHis1.SetPaintingStrategy(PaintingStrategy.HISTOGRAM);
vLoHis1.AssignValueColor( if obos > 0 then Color.RED else CreateColor(33, 188, 52));

plot vHiHis2 = if obos == 0 then vhigh else na;
vHiHis2.SetLineWeight(3);
vHiHis2.SetPaintingStrategy(PaintingStrategy.HISTOGRAM);
vHiHis2.AssignValueColor(Color.DARK_GRAY);
plot vLoHis2 = if obos == 0 then vlow else na;
vLoHis2.SetLineWeight(3);
vLoHis2.SetPaintingStrategy(PaintingStrategy.HISTOGRAM);
vLoHis2.AssignValueColor(Color.DARK_GRAY);

#-- END
 
Last edited by a moderator:

Join useThinkScript to post your question to a community of 21,000+ developers and traders.

here's a variation on the above study that fires infrequently but can be deadly accurate.

Code:
input length = 5;

def VarP = Round(length / 5);
def VarA = Highest(high, VarP) - Lowest(low, VarP);
def VarR1 = if VarA == 0 and VarP == 1 then AbsValue(close - close[VarP]) else VarA;
def VarB = Highest(high, VarP)[VarP + 1] - Lowest(low, VarP)[VarP];
def VarR2 = if VarB == 0 and VarP == 1 then AbsValue(close[VarP] - close[VarP * 2]) else VarB;
def VarC = Highest(high, VarP)[VarP * 2] - Lowest(low, VarP)[VarP * 2];

def VarR3 = if VarC == 0 and VarP == 1 then AbsValue(close[VarP * 2] - close[VarP * 3]) else VarC;

def VarD = Highest(high, VarP)[VarP * 3] - Lowest(low, VarP)[VarP * 3];
def VarR4 =
if VarD == 0 and VarP == 1 then AbsValue(close[VarP * 3] - close[VarP * 4]) else VarD;

def VarE = Highest(high, VarP)[VarP * 4] - Lowest(low, VarP)[VarP * 4];
def VarR5 = if VarE == 0 and VarP == 1 then AbsValue(close[VarP * 4] - close[VarP * 5]) else VarE;

def LRange = ((VarR1 + VarR2 + VarR3 + VarR4 + VarR5) / 5) * 0.2;

def Var0 = if AbsValue(close - close[1]) > (high - low) then AbsValue(close - close[1]) else (high - low);
def LRange2 = if high == low then Average(AbsValue(close - close[1]), 5) * 0.2 else Average(Var0, 5) * 0.2;

def range = high + low;
def delta = high - low;
def median = range / 2;
def floatingAxis = Average(median, length);
def dynamicVolatilityUnit = if length <= 7 then LRange2 else LRange;
def relativeHigh = (high - floatingAxis) / dynamicVolatilityUnit;
def relativeLow = (low - floatingAxis) / dynamicVolatilityUnit;
def relativeOpen = (open - floatingAxis) / dynamicVolatilityUnit;
def relativeClose = (close - floatingAxis) / dynamicVolatilityUnit;

def "High" = relativeHigh;
def "Low" = relativeLow;

input length2 = 10;
input stdLength = 60;

def rolling = (close - close[length2]) * 100 / close[length2];

def updev = StDev(rolling, stdLength);

def twoupdev = 2 * StDev(rolling, stdLength);

def downdev = -StDev(rolling, stdLength);

def twodowndev = -2 * StDev(rolling, stdLength);


def combined = rolling <= downdev and "Low" <= -8;
 def criteria = close >= median;

def bigbuy = combined and criteria;

def sell = rolling >= updev and "high" >= 8;

plot roll = if IsNaN(close) then Double.NaN else 3;
roll.SetPaintingStrategy(PaintingStrategy.POINTS);
roll.SetLineWeight(5);
roll.AssignValueColor(if combined then Color.GREEN else if bigbuy then color.dark_green else if sell then color.red else Color.BLACK);
roll.HideBubble();
 
Last edited by a moderator:
Very useful indicator but my mind is heavily programmed for green up and red down. Having a hard time changing it here for some reason. Can anyone help? Just need green above zero and red below zero. Thanks
 
Very useful indicator but my mind is heavily programmed for green up and red down. Having a hard time changing it here for some reason. Can anyone help? Just need green above zero and red below zero. Thanks

You may find this helpful modification of post #1
1. It reverses the red/green colors of the histogram
Code:
plot vHiHis1 = if obos == 0 then na else vhigh;
vHiHis1.SetLineWeight(3);
vHiHis1.SetPaintingStrategy(PaintingStrategy.HISTOGRAM);
vHiHis1.AssignValueColor(if obos > 0 then #Color.RED else CreateColor(33, 188, 52));
Color.GREEN else Color.RED);

plot vLoHis1 = if obos == 0 then na else vlow;
vLoHis1.SetLineWeight(3);
vLoHis1.SetPaintingStrategy(PaintingStrategy.HISTOGRAM);
vLoHis1.AssignValueColor( if obos > 0 then  #Color.RED else CreateColor(33, 188, 52));
Color.GREEN else Color.RED);
2. Adds optional pricebar coloring and bubbles. The light shading (light_gray, pink and lime) seem to indicate transition or weaking. The red/green seems to indicate a stronger move.
Code:
### OPTIONAL PRICE COLORING AND BUBBLES TO EXPLAIN COLORRING OF HISTOGRRAM AND PRICE
input pricecolor = yes;
AssignPriceColor(
if !pricecolor then Color.CURRENT
else if obos > 0 and vlow > 0 then Color.GREEN
else if obos > 0 and vlow < 0 then Color.LIME
else if obos < 0 and vhigh < 0 then Color.RED
else if obos < 0 and vhigh > 0 then Color.PINK
else if obos == 0 and (vhigh < 0 and vlow < 0 or vhigh > 0 and vlow > 0) then Color.LIGHT_GRAY
else Color.DARK_GRAY);

input bubbles = no;
AddChartBubble(bubbles and mba, 0, vhigh + "\n" + obos + "\n" + vlow,
if obos > 0 and vlow > 0 then Color.GREEN
else if obos > 0 and vlow < 0 then Color.LIME
else if obos < 0 and vhigh < 0 then Color.RED
else if obos < 0 and vhigh > 0 then Color.PINK
else if obos == 0 and (vhigh < 0 and vlow < 0 or vhigh > 0 and vlow > 0) then Color.LIGHT_GRAY
else Color.DARK_GRAY);
3. The image shows the same indicator in both panes, with the upper using pricecolor and tthe lower showing pricebar coloring and the bubbles to help explain the coloring.
Screenshot 2024-03-03 114713.png
Code:
#ValueChart_ReverseColors
#Price Bar Coloring Option to Mimic Value Chart Reverse Colors
#Bubble Option helps explain coloring

#https://www.tradingview.com/script/ryWO2cGg-Value-Chart/
#study   (title="Value Chart",shorttitle="VC",overlay=false)
## Converted and mod by Sam4Cok@ 08/2022 ##

declare lower;
#### Input ###
input length  =   5; # 'Length'
input sigTop  =   5.0; # 'Top Line'
input sigBot  =  -5.0; # 'Bottom Line'

def na = Double.NaN;
#prev(s,i) =>
script prev {
    input s = close;
    input i = 0;
    def y = AbsValue(Round(i, 0));
    def prev = s[y];
    plot return = prev;
}
def varp    =   Round(length / 5, 0);
def h_f     =   length > 7;

###### Calculation
def vara   = If(h_f, Highest(high, varp) - Lowest(low, varp), 0);
def varr1  = If(h_f, If(vara == 0 and varp == 1, AbsValue(close - prev(close, -varp)), vara), 0);
def varb   = If(h_f, prev(Highest(high, varp), -varp + 1) - prev(Lowest(low, varp), -varp), 0);
def varr2  = If(h_f, If(varb == 0 and varp == 1, AbsValue( prev(close, -varp) - prev(close, -varp * 2) ), varb), 0);
def varc   = If(h_f, prev(Highest(high, varp), -varp * 2) - prev(Lowest(low, varp), -varp * 2), 0);
def varr3  = If(h_f, If(varc == 0 and varp == 1, AbsValue(prev(close, -varp * 2) - prev(close, -varp * 3)), varc), 0);
def vard   = If (h_f, prev(Highest(high, varp), -varp * 3) - prev(Lowest(low, varp), -varp * 3), 0);
def varr4  = If(h_f, If(vard == 0 and varp == 1, AbsValue(prev(close, -varp * 3) - prev(close, -varp * 4)), vard), 0);
def vare   = If(h_f,  prev(Highest(high, varp), -varp * 4) - prev(Lowest(low, varp), -varp * 4), 0);
def varr5  = If(h_f, If(vare == 0 and varp == 1, AbsValue(prev(close, -varp * 4) - prev(close, -varp * 5)), vare), 0);
def cdelta = AbsValue(close - prev(close, -1));
def var0   = If(!h_f, If((cdelta > (high - low)) or (high == low), cdelta, (high - low)), 0);
def lrange = If(h_f, ((varr1 + varr2 + varr3 + varr4 + varr5) / 5) * .2, SimpleMovingAvg(var0, 5) * .2);

def mba     =   SimpleMovingAvg( (high + low) / 2, length);
def vhigh   =   (high - mba) / lrange;
def vlow    =   (low - mba) / lrange;

def obos   = if vhigh >= sigTop then 1 else
             if vlow  <= sigBot then -1 else 0;

plot ZeroLine  = 0;
ZeroLine.SetDefaultColor(Color.GRAY);
ZeroLine.SetStyle(Curve.SHORT_DASH);

plot top_l   =  sigTop;
top_l.SetDefaultColor(Color.RED);
top_l.SetStyle(Curve.SHORT_DASH);
plot bot_l   =  sigBot;
bot_l.SetDefaultColor(CreateColor(33, 188, 52));
bot_l.SetStyle(Curve.SHORT_DASH);


plot high1 = if vhigh > 0 then na else vhigh;
high1.SetPaintingStrategy(PaintingStrategy.SQUARED_HISTOGRAM);
high1.AssignValueColor(Color.WHITE);
plot high2 = if vhigh > 0 then na else vhigh;
high2.SetPaintingStrategy(PaintingStrategy.SQUARED_HISTOGRAM);
high2.AssignValueColor(Color.WHITE);

plot low1  = if vlow < 0 then na else vlow;
low1.SetPaintingStrategy(PaintingStrategy.SQUARED_HISTOGRAM);
low1.AssignValueColor( Color.WHITE);
plot low2  = if vlow < 0 then na else vlow;
low2.SetPaintingStrategy(PaintingStrategy.SQUARED_HISTOGRAM);
low2.AssignValueColor( Color.WHITE);

plot vHiHis1 = if obos == 0 then na else vhigh;
vHiHis1.SetLineWeight(3);
vHiHis1.SetPaintingStrategy(PaintingStrategy.HISTOGRAM);
vHiHis1.AssignValueColor(if obos > 0 then #Color.RED else CreateColor(33, 188, 52));
Color.GREEN else Color.RED);

plot vLoHis1 = if obos == 0 then na else vlow;
vLoHis1.SetLineWeight(3);
vLoHis1.SetPaintingStrategy(PaintingStrategy.HISTOGRAM);
vLoHis1.AssignValueColor( if obos > 0 then  #Color.RED else CreateColor(33, 188, 52));
Color.GREEN else Color.RED);


plot vHiHis2 = if obos == 0 then vhigh else na;
vHiHis2.SetLineWeight(3);
vHiHis2.SetPaintingStrategy(PaintingStrategy.HISTOGRAM);
vHiHis2.AssignValueColor(Color.DARK_GRAY);
plot vLoHis2 = if obos == 0 then vlow else na;
vLoHis2.SetLineWeight(3);
vLoHis2.SetPaintingStrategy(PaintingStrategy.HISTOGRAM);
vLoHis2.AssignValueColor(Color.DARK_GRAY);

### OPTIONAL PRICE COLORING AND BUBBLES TO EXPLAIN COLORRING OF HISTOGRRAM AND PRICE
input pricecolor = yes;
AssignPriceColor(
if !pricecolor then Color.CURRENT
else if obos > 0 and vlow > 0 then Color.GREEN
else if obos > 0 and vlow < 0 then Color.LIME
else if obos < 0 and vhigh < 0 then Color.RED
else if obos < 0 and vhigh > 0 then Color.PINK
else if obos == 0 and (vhigh < 0 and vlow < 0 or vhigh > 0 and vlow > 0) then Color.LIGHT_GRAY
else Color.DARK_GRAY);

input bubbles = no;
AddChartBubble(bubbles and mba, 0, vhigh + "\n" + obos + "\n" + vlow,
if obos > 0 and vlow > 0 then Color.GREEN
else if obos > 0 and vlow < 0 then Color.LIME
else if obos < 0 and vhigh < 0 then Color.RED
else if obos < 0 and vhigh > 0 then Color.PINK
else if obos == 0 and (vhigh < 0 and vlow < 0 or vhigh > 0 and vlow > 0) then Color.LIGHT_GRAY
else Color.DARK_GRAY);
#-- END
 
Last edited:
You may find this helpful modification of post #1
1. It reverses the red/green colors of the histogram

2. Adds optional pricebar coloring and bubbles. The light shading (light_gray, pink and lime) seem to indicate transition or weaking. The red/green seems to indicate a stronger move.

3. The image shows the same indicator in both panes, with the upper using pricecolor and tthe lower showing pricebar coloring and the bubbles to help explain the coloring.
Would you please submit the whole code please?
 

Similar threads

Not the exact question you're looking for?

Start a new thread and receive assistance from our community.

87k+ Posts
191 Online
Create Post

Similar threads

Similar threads

The Market Trading Game Changer

Join 2,500+ subscribers inside the useThinkScript VIP Membership Club
  • Exclusive indicators
  • Proven strategies & setups
  • Private Discord community
  • ‘Buy The Dip’ signal alerts
  • Exclusive members-only content
  • Add-ons and resources
  • 1 full year of unlimited support

Frequently Asked Questions

What is useThinkScript?

useThinkScript is the #1 community of stock market investors using indicators and other tools to power their trading strategies. Traders of all skill levels use our forums to learn about scripting and indicators, help each other, and discover new ways to gain an edge in the markets.

How do I get started?

We get it. Our forum can be intimidating, if not overwhelming. With thousands of topics, tens of thousands of posts, our community has created an incredibly deep knowledge base for stock traders. No one can ever exhaust every resource provided on our site.

If you are new, or just looking for guidance, here are some helpful links to get you started.

What are the benefits of VIP Membership?
VIP members get exclusive access to these proven and tested premium indicators: Buy the Dip, Advanced Market Moves 2.0, Take Profit, and Volatility Trading Range. In addition, VIP members get access to over 50 VIP-only custom indicators, add-ons, and strategies, private VIP-only forums, private Discord channel to discuss trades and strategies in real-time, customer support, trade alerts, and much more. Learn all about VIP membership here.
How can I access the premium indicators?
To access the premium indicators, which are plug and play ready, sign up for VIP membership here.
Back
Top