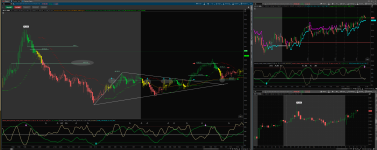
/ES Futures Trading Strategy on ThinkorSwim

New Indicator: Buy the Dip

Check out our Buy the Dip indicator and see how it can help you find profitable swing trading ideas. Scanner, watchlist columns, and add-ons are included.

Download the indicator

CHOP-A-PALOOZA UPDATE

Long @3134.5 with breakout of triangle
Exit @ 3137.25 - overnight resistance

Short @ 3136.25
Exit @ 3133.75 - classic ES shelf setup @ 3133.50

MipH9oI.png
 

Attachments

  • MipH9oI.png
    MipH9oI.png
    290.1 KB · Views: 87
@skynetgen That one lone pull back candle to 3134.50 at 2:24........yeah I had parked a long order at 3135 expecting exactly that (either 3134.50 or 3134.75) but didn't have the balls to see it through.
 
Well I'm curious is there a script that picks out/ draws the triangles.... not lazy just curious.. I entered RL today using the 512t chart and it is a beautiful chart.
 
I was just thinking the same thing the other day dude. That would be quite a feat to be able to code something like that.
 
Well I'm curious is there a script that picks out/ draws the triangles.... not lazy just curious.. I entered RL today using the 512t chart and it is a beautiful chart.

@J007RMC The closest script that might do something like you're looking for probably is something like the Harmonics and Fractals study that was undertaken by somebody. You can read about it here, just posting info to share with you

https://usethinkscript.com/threads/...igzag-bat-butterfly-abcd.69/page-3#post-10359
 
Last edited:
Probably not going to trade tomorrow. Day before thanksgiving with overnight ATH. Would have to be something beautiful for me to jump in. I will keep my news feed active however just in case there is something regarding the trade deal with China. Happy thanksgiving gentlemen!
 
@tomsk The script you suggested is simply just a high/low zig zag that does not show the triangle formations we are looking for. I can draw trend lines all day long looking for M/W patterns. Any knowledgeable trader can do that without drawing trend lines. And I don't need a study to do that for me. What I am looking for is an indicator that can plot exactly what I drew on the 1000t chart over the past two days: simply a triangle formation looking for a breakout. A lot of times the triangle can be forming right in front of your face and you don't even know it. That is what I seek to accomplish here. In the words of Maverick, "You don't have time to think up there. If you think you're dead". The goal in my mind of a triangle formation ON A TICK CHART would be to eliminate hesitation/time. Over the past two days I am 4/4 playing these formations.
 
That message basically directed @J007RMC that someone else did quite a lot of work on patterns and if anyone was interested they might approach the original code writer for assistance as such patterns are rather complex to plot on charts
 
Last edited:
@skynetgen I was thinking the exact same thing man. Picked up a couple quick scalps off some head and shoulders patterns but other than that I've been sitting on the bench watching this play out.
 

Join useThinkScript to post your question to a community of 21,000+ developers and traders.

Not the exact question you're looking for?

Start a new thread and receive assistance from our community.

87k+ Posts
339 Online
Create Post

The Market Trading Game Changer

Join 2,500+ subscribers inside the useThinkScript VIP Membership Club
  • Exclusive indicators
  • Proven strategies & setups
  • Private Discord community
  • ‘Buy The Dip’ signal alerts
  • Exclusive members-only content
  • Add-ons and resources
  • 1 full year of unlimited support

Frequently Asked Questions

What is useThinkScript?

useThinkScript is the #1 community of stock market investors using indicators and other tools to power their trading strategies. Traders of all skill levels use our forums to learn about scripting and indicators, help each other, and discover new ways to gain an edge in the markets.

How do I get started?

We get it. Our forum can be intimidating, if not overwhelming. With thousands of topics, tens of thousands of posts, our community has created an incredibly deep knowledge base for stock traders. No one can ever exhaust every resource provided on our site.

If you are new, or just looking for guidance, here are some helpful links to get you started.

What are the benefits of VIP Membership?
VIP members get exclusive access to these proven and tested premium indicators: Buy the Dip, Advanced Market Moves 2.0, Take Profit, and Volatility Trading Range. In addition, VIP members get access to over 50 VIP-only custom indicators, add-ons, and strategies, private VIP-only forums, private Discord channel to discuss trades and strategies in real-time, customer support, trade alerts, and much more. Learn all about VIP membership here.
How can I access the premium indicators?
To access the premium indicators, which are plug and play ready, sign up for VIP membership here.
Back
Top