RickK
Active member
Hey All,
Not sure if anyone has ever put this up, but I know that it has been around for quite some time. I found it a long time ago on FunWithThinkscript.
It's called Stochastic Scalper and I don't know who has taken credit for designing it....boy would I like to know and ask some questions. I've been hot and cold on it for a long time....lately warming back up since I took some time to tweak the settings.
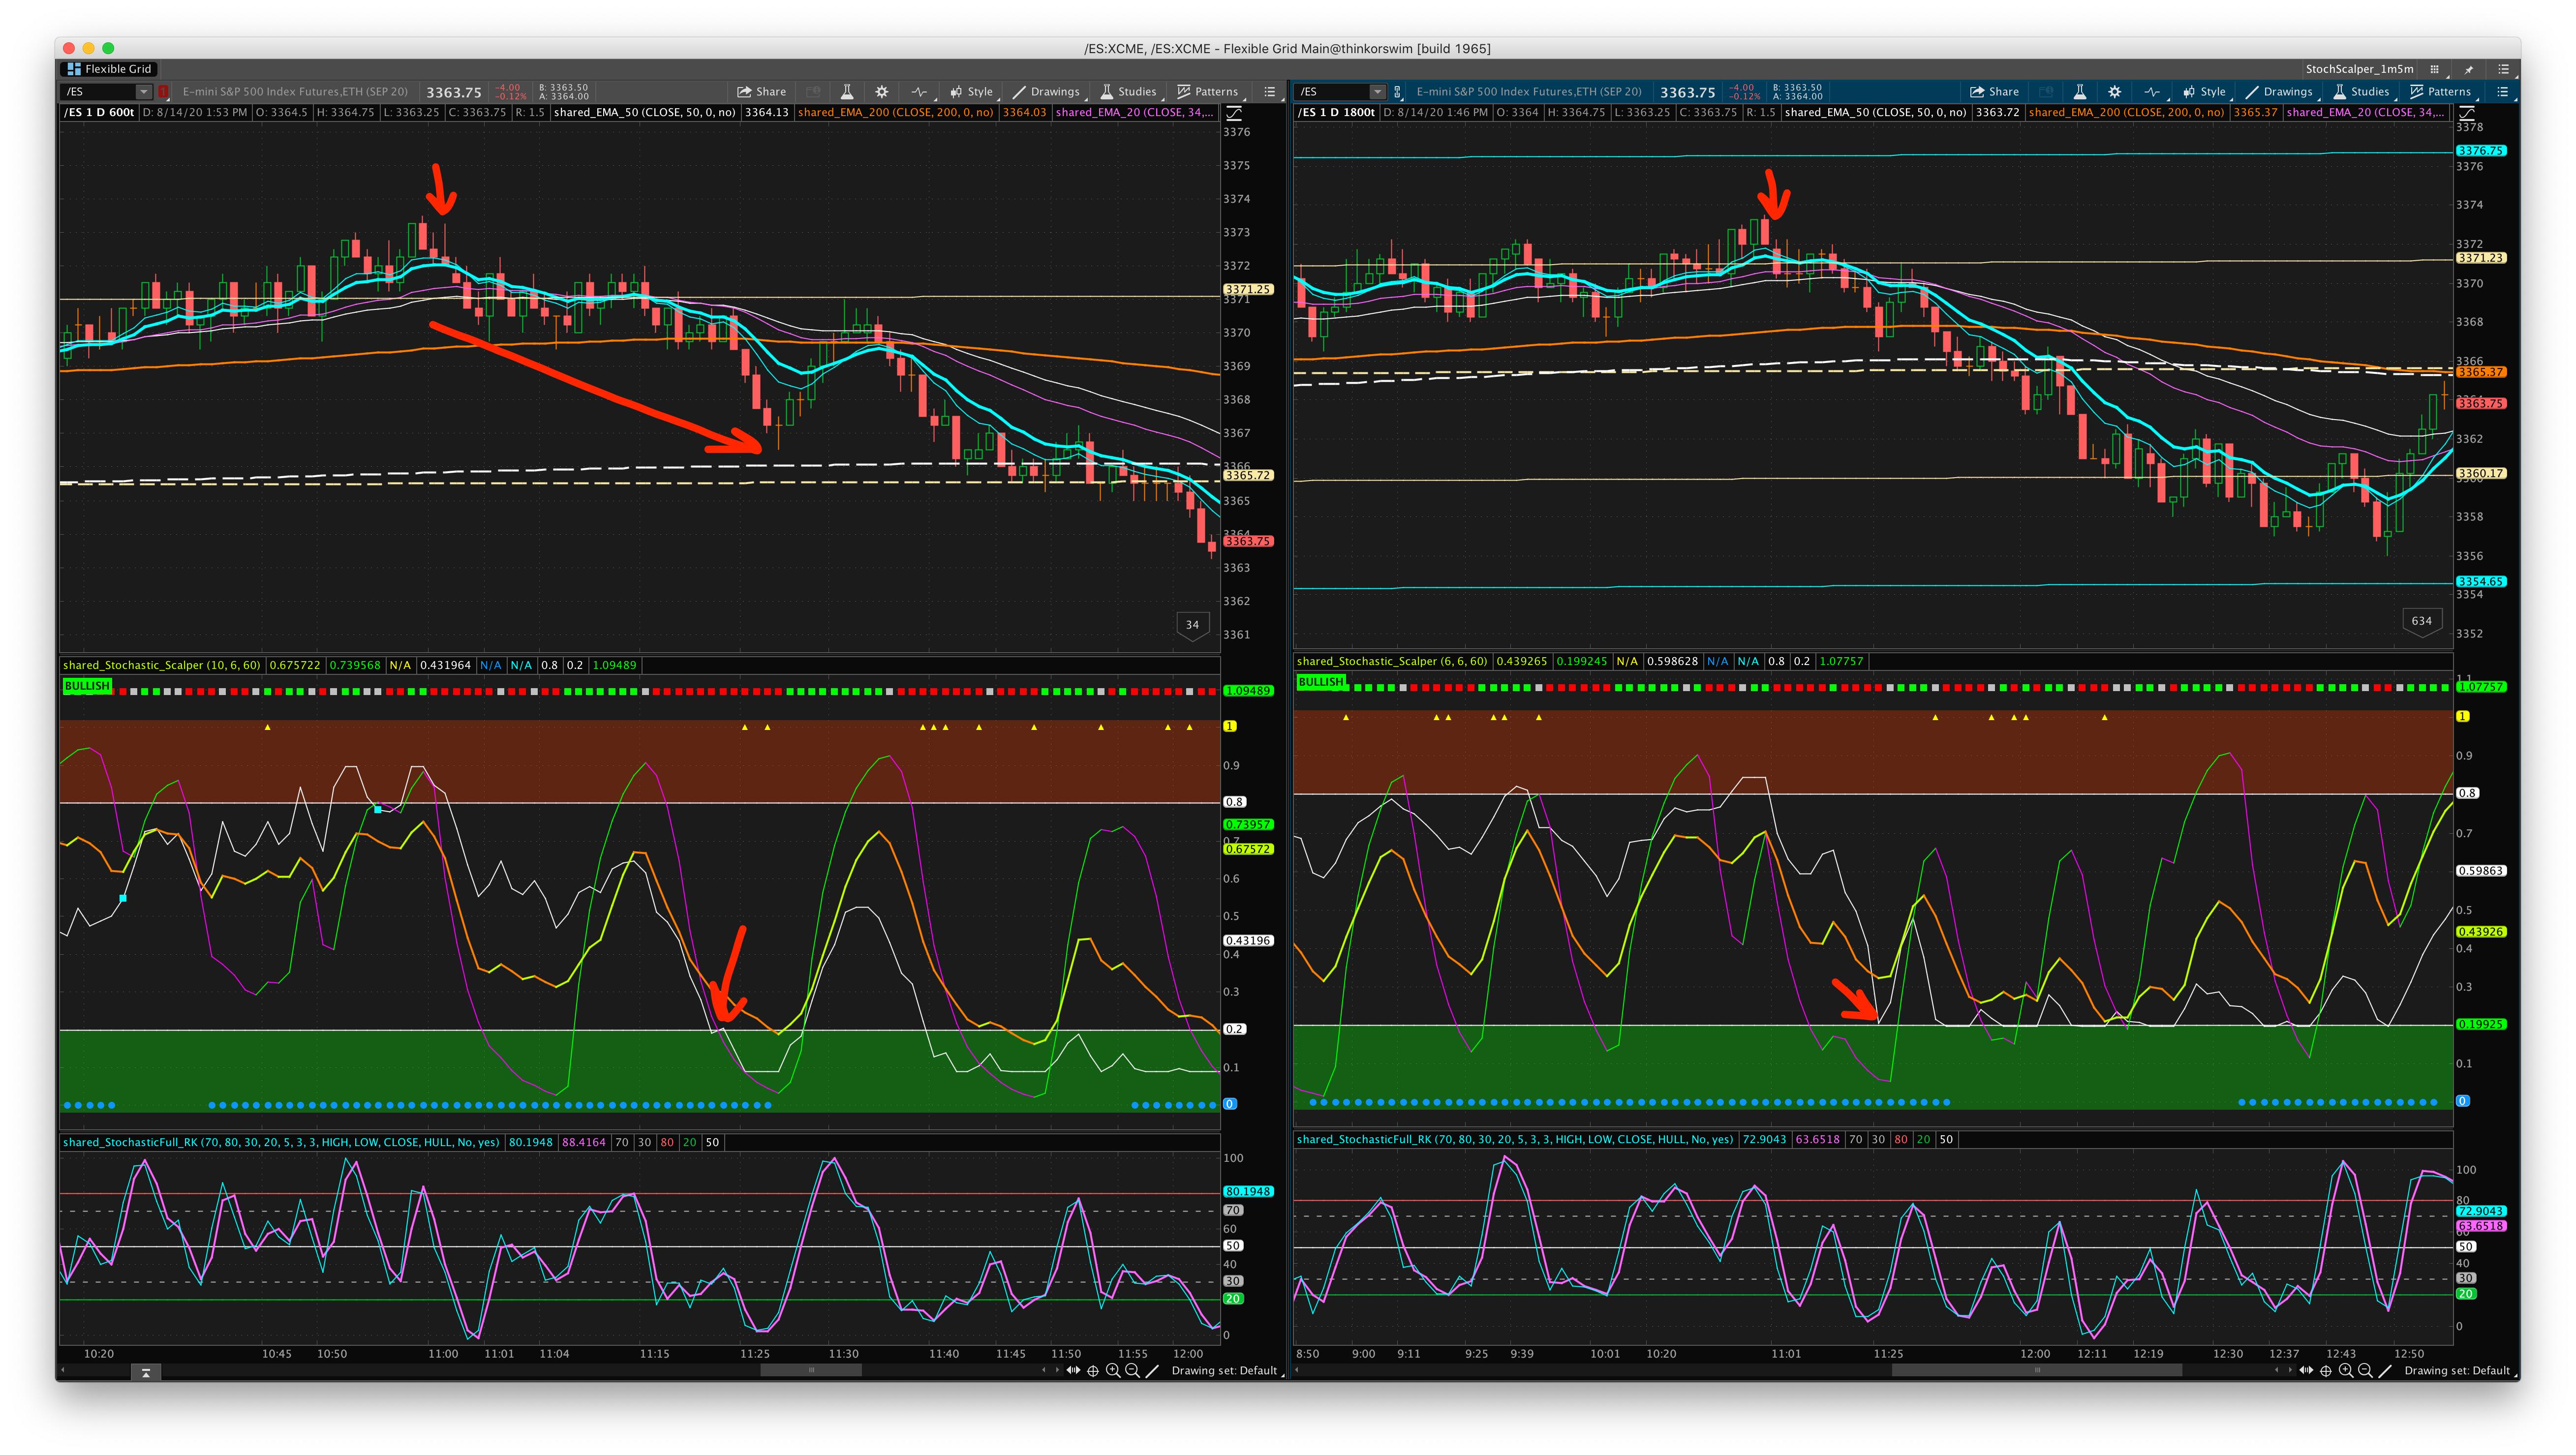
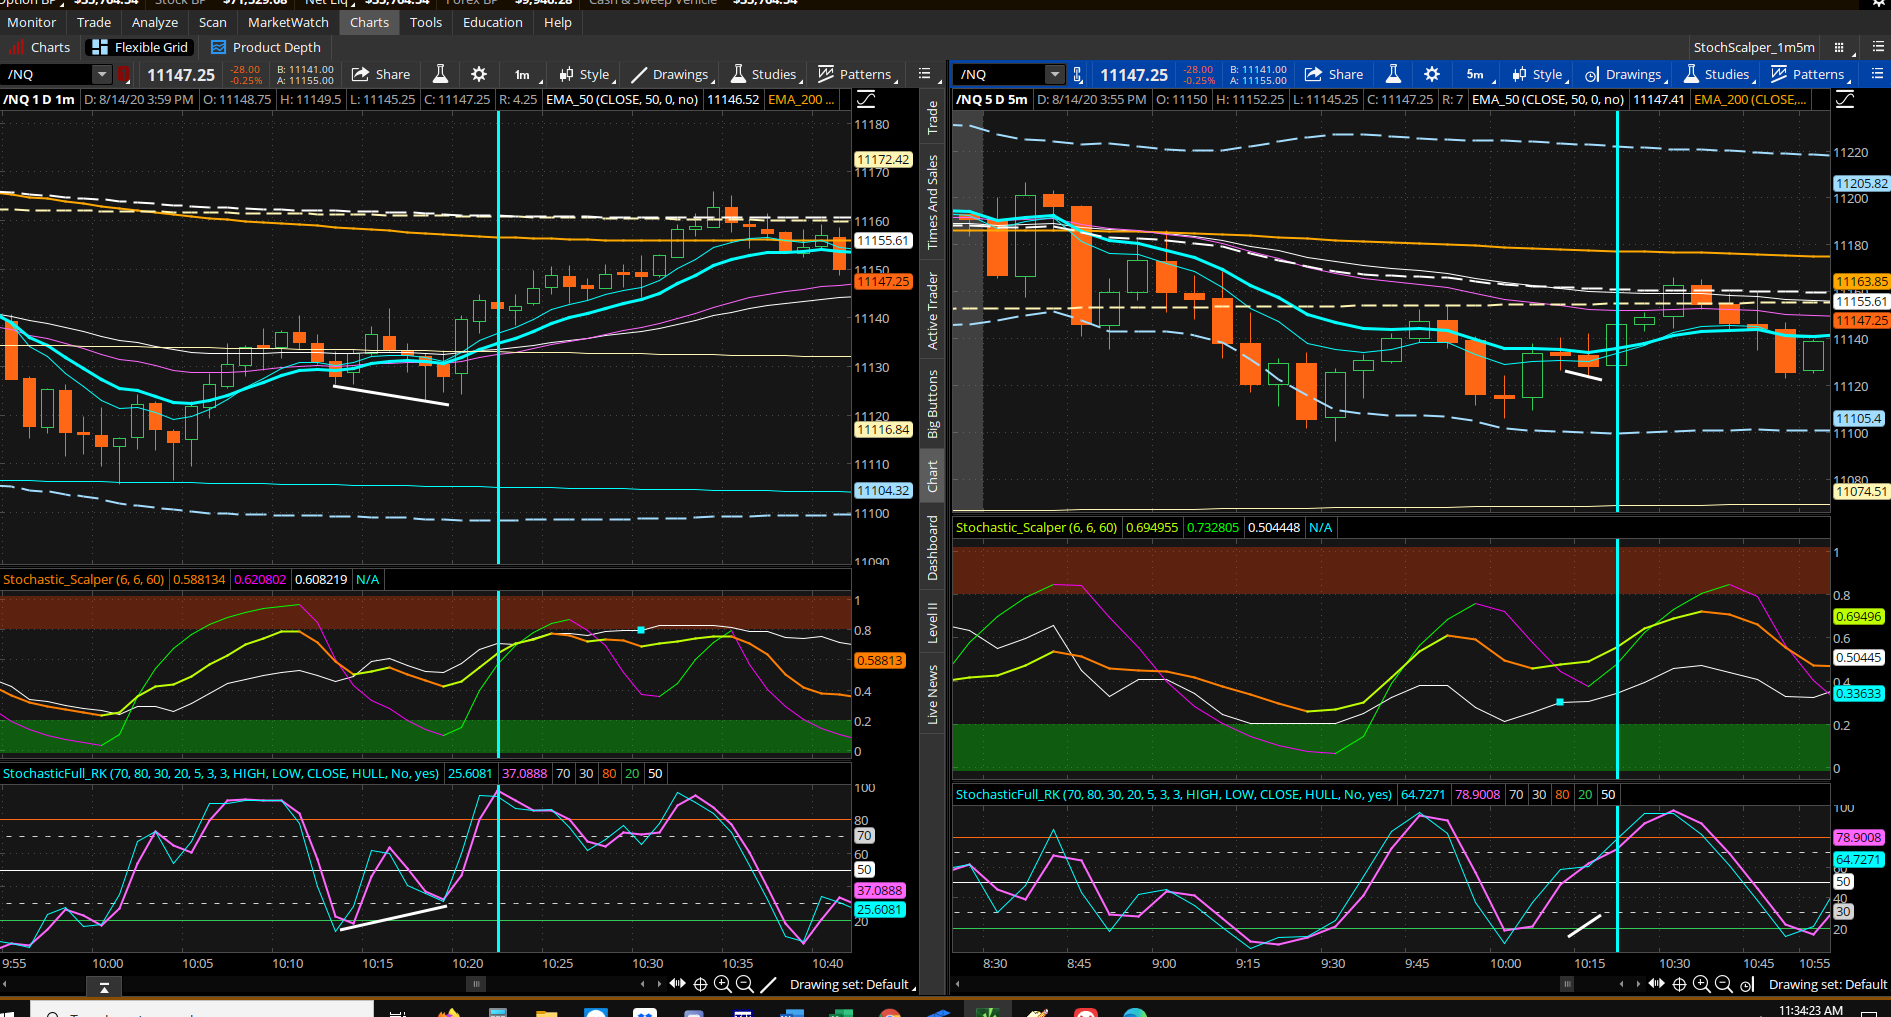
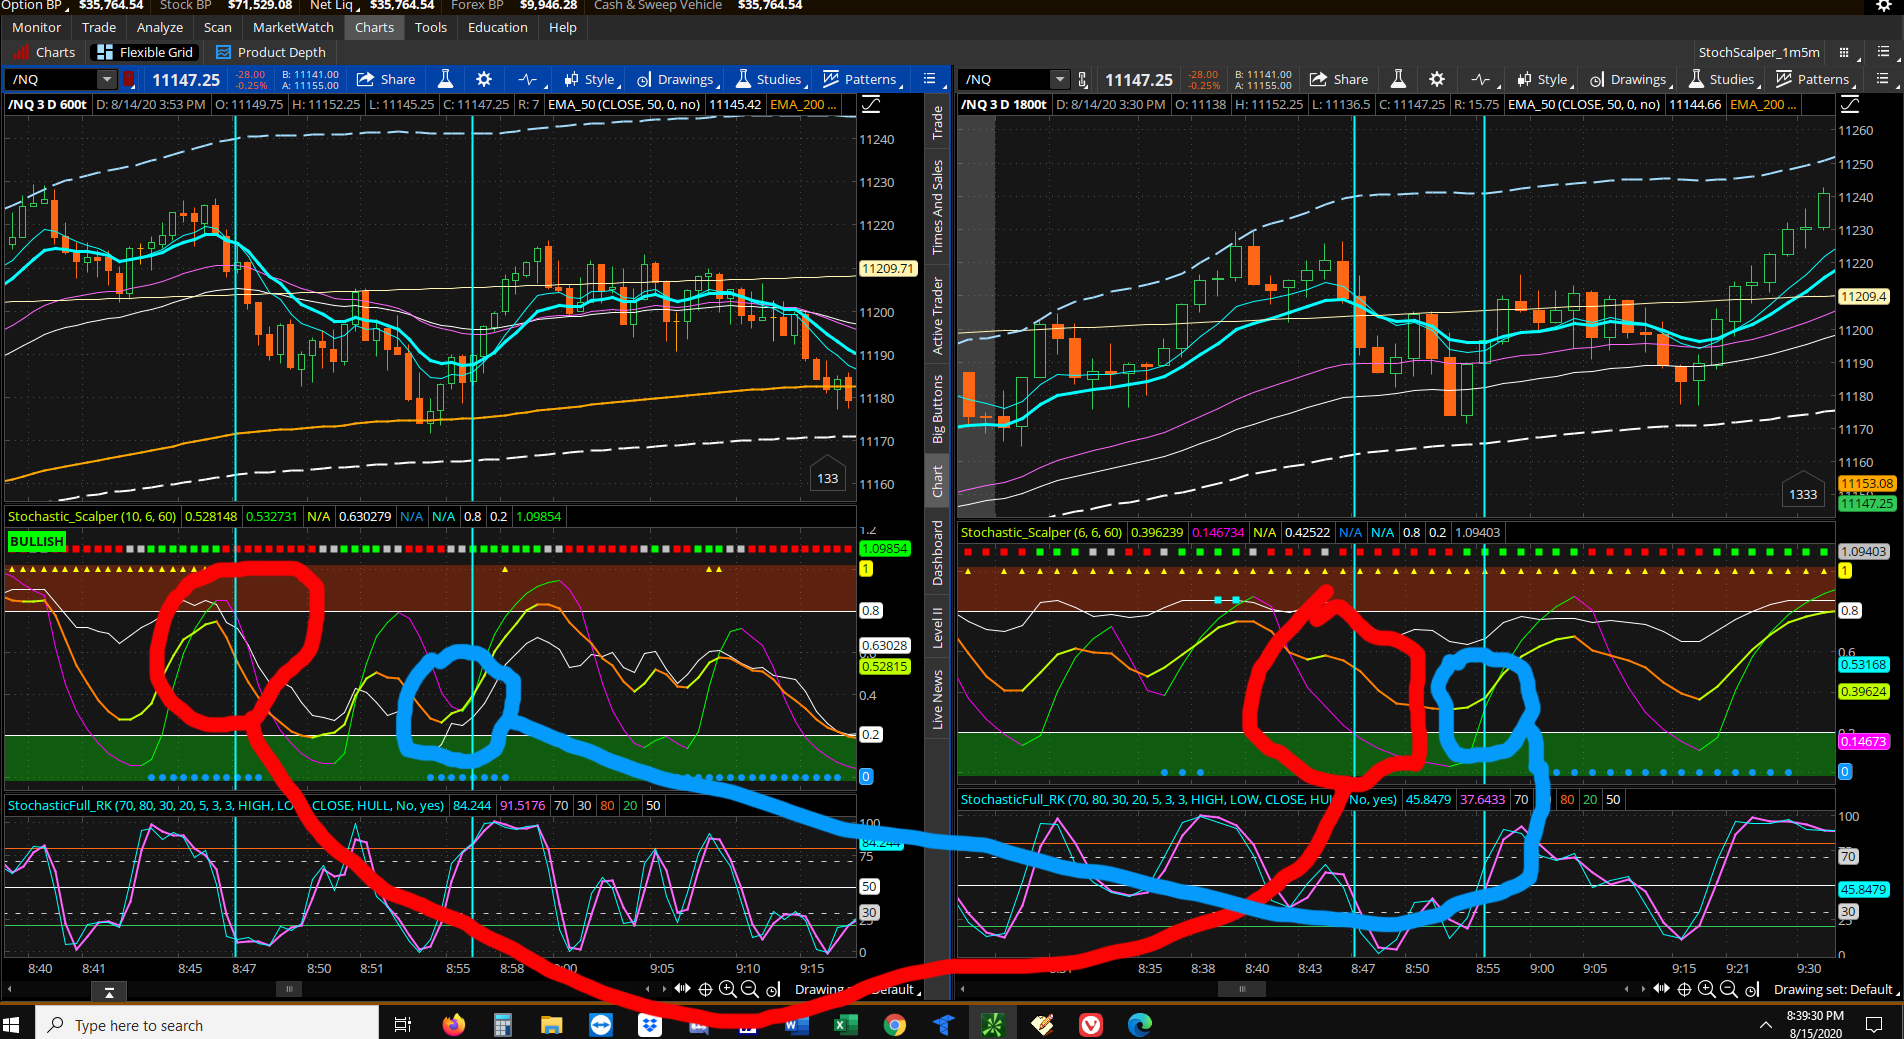
I've included an image, the code (which I liberally modified the "instructions"[if you want to call it that....but don't]), and links to a workspace and a link to the thinkscript itself. Would love to see some dialog on this to see what kind of results, if any, others are getting. Currently I'm trading mostly /NQ on 1m/5m timeframes.
Also, if there is anyone that can convert this code to Tradingview pinescript, that would be awesome! I trade with Tradovate mostly now and chart using Tradingview because I got tired of TOS locking up, bogging down and just plain stopping for minutes at a time..... and because Tradovate's charting is sort of crap.
Enjoy!
Here's the link to the workspace of the image I've shown above: https://tos.mx/O7oxLBP
Here's the link to the thinkscript indicator itself: https://tos.mx/UwPpmjI
Note: the code below has a huge "hint" section that seems to be displaying as one line on usethinkscript. Copy and paste it into notepad to read it or just read it once you download the indicator. In it, I have discussed mods that I've made to the script itself and also parameters that I've changed in my testing.")
Not sure if anyone has ever put this up, but I know that it has been around for quite some time. I found it a long time ago on FunWithThinkscript.
It's called Stochastic Scalper and I don't know who has taken credit for designing it....boy would I like to know and ask some questions. I've been hot and cold on it for a long time....lately warming back up since I took some time to tweak the settings.
I've included an image, the code (which I liberally modified the "instructions"[if you want to call it that....but don't]), and links to a workspace and a link to the thinkscript itself. Would love to see some dialog on this to see what kind of results, if any, others are getting. Currently I'm trading mostly /NQ on 1m/5m timeframes.
Also, if there is anyone that can convert this code to Tradingview pinescript, that would be awesome! I trade with Tradovate mostly now and chart using Tradingview because I got tired of TOS locking up, bogging down and just plain stopping for minutes at a time..... and because Tradovate's charting is sort of crap.
Enjoy!
Here's the link to the workspace of the image I've shown above: https://tos.mx/O7oxLBP
Here's the link to the thinkscript indicator itself: https://tos.mx/UwPpmjI
Note: the code below has a huge "hint" section that seems to be displaying as one line on usethinkscript. Copy and paste it into notepad to read it or just read it once you download the indicator. In it, I have discussed mods that I've made to the script itself and also parameters that I've changed in my testing.
Code:
#Stochastic Scalper

#hint: Stochastic Scalper - unattributed - I think it was originally designed for forex trading on MT4  Modifications to hints(info) done by @RickKennedy, member usethinkscript.com................ INFO: This is designed to give short aggregation Signals 1 to 5 min.  When used on a single chart, scalp when both lines agree (green  lines long, red lines short). Best situation is when both lines agree on  the 1m chart and both lines agree on the 5m chart ...all 4 lines agreeing. (Lately I've been testing it on a 600 tick/1800 tick chart combo with fast but interesting results.) Using the two chart method is usually a very high probability  trade.  ................ The white line is pure price scaled to the Stochastic range. ................The straight line is a Linear Regression of the Total Chart aggregation showing the charts trend (red=downward, yellow=upward).  Note:  I have turned off the linear regression lines as I didn't feel that they really added anything, for me. Likewise, I have turned off its chart labels that said "CHART TREND UP", "CHART TREND DOWN". Also I changed the labels from "BUY" to "BULLISH" and "SELL" to "BEARISH" and "SQUEEZE" to "SQZ".................. Yellow Triangles at the top of indicator show volume in the 30 percentile for that Volume Period or above. ................ Blue Dots at the bottom of the indicator show when price is in a squeeze, such as with the TTM_Squeeze indicator. ................ When a light blue square appears on the white price line, this  indicates divergence between price and the stochastic lines. A reversal could be coming. Labels are used for trading signals.  ................Added at the end of the script is a new bit of code that will  display a heat map line at the top of the indicator (green  when both stochastic lines are green, red when both stochastic  lines are red, and white when the lines are not the same). ................ Lastly, there is a section of code (that I have turned off) which  allows the indicator to assign colors to the candles on the chart.  I couldn't figure out the use, so I commented it out................. Finally, there is a bit of complimentary code (a separate indicator) that will display the results of Stochastic Scalper on your watchlist.  Thus, if a TSLA is Green/Bullish/Buy on the indicator, it will display  a Green block on the watchlist. This works for 1m and 5m.  Nice feature..........Oh, I forgot to mention. You might want to play with the settings.  Currently I am using it with a 10,6,60 setting on the short term chart and 6,6,60 on the longer term chart. Advice: look for the lines to correlate on the longer term chart, then look for the lines to coincide on the short term chart. Good luck!


declare lower;

input period = 21;
input periodEMA = 13;
input VolumePeriod = 60;

def o;
def h;
def l;
def c;
def v;
def r;
def p1;
def s;
def p3;
plot K;
plot D;
#plot A;
def Min;
def Max;
def vS;
def vK;
plot vP;
plot PLine;
def mean;
def sd;
def atr;
plot squeeze;
plot Div;
o = (open[1] + close[1]) / 2;
h = Max(high, close[1]);
l = Min(low, close[1]);
c = (o + h + l + close) / 4;
v = volume;
script ScalingPlot {
    input c = close;
    input Min = 0;
    input Max = 100;
    def hh = Highest(c, 63);
    def ll = Lowest(c, 63);
    plot Range = (((Max - Min) * (c - ll)) /  (hh - ll)) + Min;
}
r  = Highest(h, period) - Lowest(l, period);
p1 = (c - Lowest(l, period)) / r;
K  = ExpAverage(p1, periodEMA);
s  = Highest(K, period) - Lowest(K, period);
p3 = (K - Lowest(K, period)) / s;
D  = ExpAverage(p3, periodEMA);
Min = LowestAll(K);
Max = HighestAll(K);
PLine   = scalingPlot(c = c, Min = Min, Max = Max);
#A   = InertiaAll(b);
vS = Highest(v, VolumePeriod) - Lowest(v, VolumePeriod);
vK = (v - Lowest(v, VolumePeriod)) / vS;
vP = if vK > .7 then 1 else Double.NaN;
vP.SetPaintingStrategy(PaintingStrategy.TRIANGLES);
mean = Average(c, 20);
sd = StDev(c, 20);
atr = Average(TrueRange(c, h, l), 20);
squeeze = if (mean + (2 * sd)) < (mean + (1.5 * atr)) then 0 else Double.NaN;
squeeze.SetPaintingStrategy(PaintingStrategy.POINTS);
K.AssignValueColor(if K > K[1] then Color.LIME else Color.DARK_ORANGE);
K.SetLineWeight (2);
D.AssignValueColor(if D > D[1] then Color.GREEN else Color.MAGENTA);
#A.AssignValueColor(if A > A[1] then Color.yellow else Color.Red);
PLine.SetDefaultColor(Color.WHITE);
vP.SetDefaultColor(Color.YELLOW);
squeeze.SetDefaultColor(CreateColor(15, 150, 250));
squeeze.SetLineWeight(4);
#AddLabel(1, if A > A[1]
#           then "Chart Trend Up"
#            else "Chart Trend Down",
#           if A > A[1]
#            then Color.Green
#            else Color.Red);
AddLabel(K < K[1] and D < D[1], "BEARISH", Color.RED);
AddLabel(K > K[1] and D > D[1], "BULLISH", Color.GREEN);
AddLabel(!IsNaN(vP), "VOL!!", Color.YELLOW);
AddLabel(!IsNaN(squeeze), "SQZ", CreateColor(15, 150, 250));
plot OB = if IsNaN(close) then Double.NaN else .8;
OB.SetDefaultColor(Color.WHITE);
plot OS = if IsNaN(close) then Double.NaN else .2;
OS.SetDefaultColor(Color.WHITE);
# Scan Plots
plot Long = if K > K[1] and
               D > D[1] and
               D[1] < D[2]
            then 1
            else 0;
Long.Hide();
plot Short = if K < K[1] and
                D < D[1] and
                D[1] > D[2]
             then 1
             else 0;
Short.Hide();

#The following 5 lines of code will color the candles on the
#chart for some reason.....can't figure out why
#AssignPriceColor(if Long
#                then Color.Yellow
#                else if Short
#                then Color.Plum
#                else Color.Current);


# Price and Stochastic Divergence
Div = if Correlation(D, PLine, 3) >= -.99 then Double.NaN else PLine;
Div.SetPaintingStrategy(PaintingStrategy.SQUARES);
Div.SetDefaultColor(Color.CYAN);
Div.SetLineWeight(4);

#code to add clouds for overbought and oversold zones
AddCloud(-.02, .2, Color.LIGHT_GRAY, Color.GREEN);
AddCloud(.8, 1.02, Color.DARK_GRAY, Color.LIGHT_RED);

# End original Code for  Stochastic Scalper


# copy and paste the following to the very end of the
# original Stochastic Scalper script ( http://tos.mx/R91bLn )
# this will add squares to the top of the scalper plot
# the squares will be green when both K and D are higher
# the squares will be red when both K and D are lower
# the squares will be gray when K and D are mixed

plot Neut = if IsNaN(close) then Double.NaN else (Max(HighestAll(K), HighestAll(D))) * 1.1;
Neut.SetPaintingStrategy(PaintingStrategy.SQUARES);
Neut.AssignValueColor(if K > K[1] and D > D[1] then Color.GREEN else if K < K[1] and D < D[1] then Color.RED else Color.LIGHT_GRAY);
Neut.SetLineWeight(4);
Last edited: