
Author Message:
The Zigzag Tails Indicator, a groundbreaking tool from Trendoscope, redefines technical analysis by seamlessly integrating anchored VWAPs (Volume Weighted Average Prices) and Average Price calculations with Zigzag pivot points. This advanced indicator recalculates Average Price or VWAP from one Zigzag pivot to the next, offering unparalleled insights into market movements.
Innovative Design
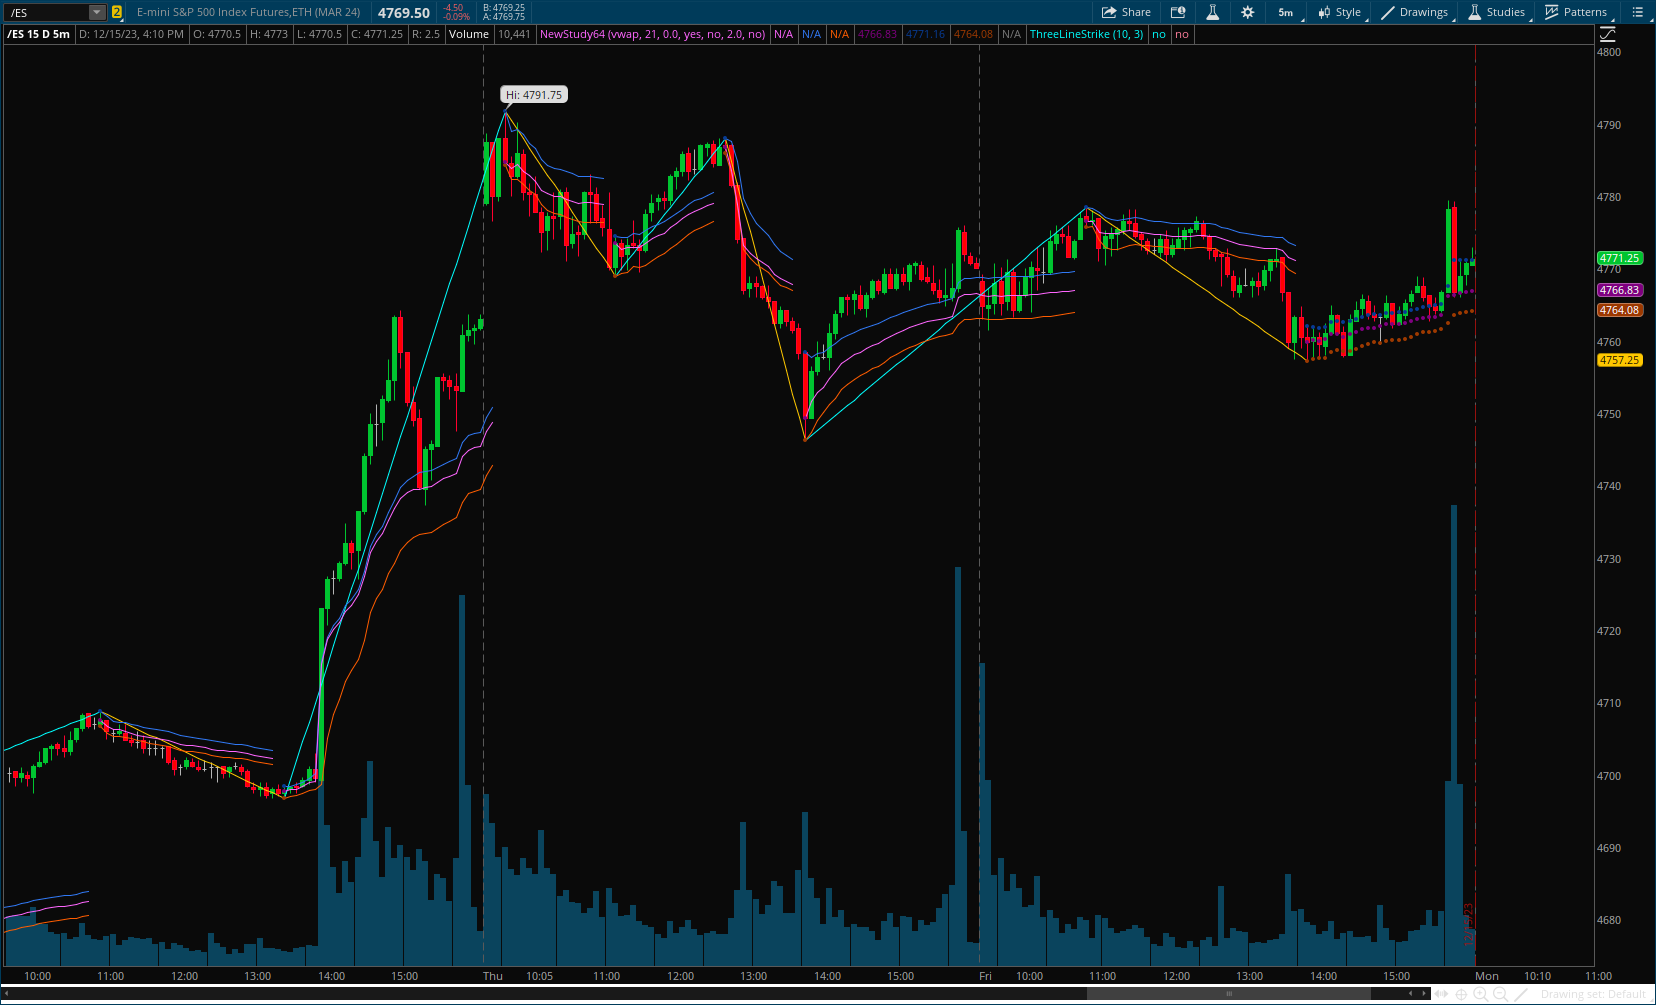
Each Zigzag pivot can feature up to three distinct tails, corresponding to the high, low, and close prices of each candle. Users have the flexibility to select between Average Price and VWAP for display on their charts. By default, the indicator plots all three tails, but individual tail visibility is customizable via the settings panel.
- Average Price Mode: When selected, tails depict the average price across a specified number of bars.
- VWAP Mode: In this mode, tails represent the VWAP, calculated for a given price over a set number of bars.
CSS:
#//https://www.tradingview.com/v/0rjAASPq/
#// This work is licensed under Creative Commons Attribution-NonCommercial-ShareAlike 4.0 International License
#// © Trendoscope
# indicator("Zigzag Tails [Trendoscope®]", 'ZT[Trendoscope®]', overlay=true, max_lines_count = 500,
# Converted by Sam4Cok@Samer800    - 12/2023

input tailType =  {default "vwap", "Average"};     # 'Tail Type'
input zigzagLength   = 21;    # 'Zigzag Length' tooltip = 'Length on which the zigzag is calculated
input pivotPriceChangePercent = 0.0;
input showZigzagLine = no;
input showStdevCloud = no;
input StdevMulti = 2.0;
input repaint = no;            # 'Repaint'

def na = Double.NaN;
def bar = CompoundValue(1, BarNumber(), 0);
def avg = tailType == tailType."Average";
DefineGlobalColor("Blue"      , CreateColor(49,121,245));
DefineGlobalColor("Dark Blue" , CreateColor(7,59,149));
DefineGlobalColor("Red"       , CreateColor(255,93,0));
DefineGlobalColor("Dark Red"  , CreateColor(157,57,0));
script f_vwap {
    input src = vwap;
    input dir = yes;
    input StdevMulti = 1.0;
    input trailAvg = no;
    def na = Double.NaN;
    def volu = if volume then volume else 1;
    def vol = if trailAvg then 1 else volu;
    def isPeriodRolled = dir;
    def volumeSum;
    def volumeVwapSum;
    def volumeVwap2Sum;
    if (isPeriodRolled) {
        volumeSum = vol;
        volumeVwapSum = vol * src;
        volumeVwap2Sum = vol * Sqr(src);
    } else {
        volumeSum = CompoundValue(1, volumeSum[1] + vol, vol);
        volumeVwapSum = CompoundValue(1, volumeVwapSum[1] + vol * src, vol * src);
        volumeVwap2Sum = CompoundValue(1, volumeVwap2Sum[1] + vol * Sqr(src), vol * Sqr(src));
    }
    def price = volumeVwapSum / volumeSum;
    def deviation = Sqrt(Max(volumeVwap2Sum / volumeSum - Sqr(price), 0));

    plot vwap = price;#if isPeriodRolled then na else price;
    plot bandUp = vwap + deviation * StdevMulti;
    plot bandDn = vwap - deviation * StdevMulti;
}
script ZigZag {
    input zigzagLength = 21;
    input ZZPercent = 0;
    input repaint = no;
    def na = Double.NaN;
    def PivotChg = Max(ZZPercent * 0.01, 0.00001);
    def h  = Highest(high[-zigzagLength + 1], zigzagLength - 1);
    def l  = Lowest(low[-zigzagLength + 1], zigzagLength - 1);
    def trend;
    def LL;
    def HH;
    def zigzag;
    def trend1 = if trend[1]==0 then 1 else trend[1];
    def LL1 = if !LL[1] then l else LL[1];
    def HH1 = if !HH[1] then h else HH[1];
    if (trend1 > 0) {
        if (h >= HH1) {
            HH = h;
            zigzag = na;
            trend = trend1;
            LL = LL1;
        } else {
            HH = HH1;
            if (l < HH1 * (1 - PivotChg)) {
                zigzag = h[1];
                trend = -1;
                LL = l;
            } else {
                trend  = trend1;
                zigzag = if !repaint then na else if IsNaN(close[-1]) then
                                                  if trend>0 then high else low else na;
                LL     = LL1;
            }
        }
    } else {
        if (l <= LL1) {
            LL = l;
            HH = HH1;
            zigzag = na;
            trend = trend1;
        } else {
            LL = LL1;
            if (h > LL1 * (1 + PivotChg)) {
                zigzag = l[1];
                trend = 1;
                HH = h;
            } else {
                trend  = trend1;
                zigzag = if !repaint then na else if IsNaN(close[-1]) then
                                                  if trend>0 then high else low else na;
                HH     = HH1;
            }
        }
    }
    plot zz = zigzag;
    plot dir = trend;
}
def zz  = zigzag(zigzagLength, pivotPriceChangePercent, repaint).zz;
def dir = zigzag(zigzagLength, pivotPriceChangePercent, repaint).dir;
def isRolled = CompoundValue(1, !IsNaN(zz), yes);
def lastBar = if isRolled then bar else lastBar[1];
def plotCond = !repaint and bar > HighestAll(lastBar) or isRolled;
def wapH  = f_Vwap(high, isRolled, StdevMulti, avg).vwap;
def wapC  = f_Vwap(close,isRolled, StdevMulti, avg).vwap;
def wapL  = f_Vwap(low  ,isRolled, StdevMulti, avg).vwap;
def wapUp = f_Vwap(hl2,isRolled, StdevMulti, avg).bandUp;
def wapDn = f_Vwap(hl2,isRolled, StdevMulti, avg).bandDn;

plot VWAP   = if plotCond[-1] then na else wapC;
plot VWAPH  = if plotCond[-1] then na else wapH;
plot VWAPL  = if plotCond[-1] then na else wapL;
plot VWAPr  = if !plotCond then na else wapC;
plot VWAPHr = if !plotCond then na else wapH;
plot VWAPLr = if !plotCond then na else wapL;

plot zigZag = if !IsNaN(zz) and showZigzagLine then zz else na;
def UpperBand = if !showStdevCloud or isRolled[-1] then na else wapUp;
def LowerBand = if !showStdevCloud or isRolled[-1] then na else wapDn;

zigZag.EnableApproximation();
zigZag.AssignValueColor(if dir[1] > 0 then Color.CYAN else Color.ORANGE);
VWAP.SetDefaultColor(GetColor(0));
VWAPH.SetDefaultColor(GlobalColor("Blue"));
VWAPL.SetDefaultColor(GlobalColor("Red"));
VWAPr.SetDefaultColor(Color.PLUM);
VWAPHr.SetDefaultColor(GlobalColor("Dark Blue"));
VWAPLr.SetDefaultColor(GlobalColor("Dark Red"));
VWAPr.SetStyle(Curve.POINTS);
VWAPHr.SetStyle(Curve.POINTS);
VWAPLr.SetStyle(Curve.POINTS);

AddCloud(UpperBand,  LowerBand,  Color.DARK_GRAY, Color.DARK_GRAY, yes);

#-- END of CODE