Hi Everyone,
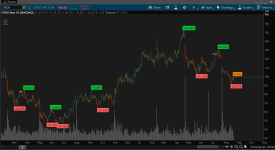
I'd like to add two labels to TD Ameritrade's ZigZag Percent indicator. The first label should display the average of the last five ZigZag percentage highs. For example, in the photo I have attached, the last five Zig Zag percentage highs were: 24.79%, 130.38%, 77.06%, 25.86%, and 23.64%. This would give an average of 56.35% that I would like displayed on the first label titled "ZigZag percentage high: ". The second label should display the average of the last five ZigZag percentage lows.
The code for the indicator is below.
Thanks for your help!
----------------------
input price = close;
input reversalAmount = 8.0;
input showBubbles = no;
input showLabel = no;
assert(reversalAmount > 0, "'reversal amount' should be positive: " + reversalAmount);
plot "ZZ%" = reference ZigZagHighLow(price, price, reversalAmount, 0, 1, 0);
def zzSave = if !IsNaN("ZZ%") then price else getValue(zzSave, 1);
def chg = (price / getValue(zzSave, 1) - 1) * 100;
def isUp = chg >= 0;
def isConf = AbsValue(chg) >= reversalAmount or (IsNaN(getValue("ZZ%", 1)) and getValue(isConf, 1));
"ZZ%".EnableApproximation();
"ZZ%".DefineColor("Up Trend", Color.UPTICK);
"ZZ%".DefineColor("Down Trend", Color.DOWNTICK);
"ZZ%".DefineColor("Undefined", Color.DARK_ORANGE);
"ZZ%".AssignValueColor(if !isConf then "ZZ%".color("Undefined") else if isUp then "ZZ%".color("Up Trend") else "ZZ%".color("Down Trend"));
DefineGlobalColor("Unconfirmed", Color.DARK_ORANGE);
DefineGlobalColor("Up", Color.UPTICK);
DefineGlobalColor("Down", Color.DOWNTICK);
def barNumber = barNumber();
AddChartBubble(showBubbles and !IsNaN("ZZ%") and barNumber != 1, price, round(chg) + "%", if !isConf then globalColor("Unconfirmed") else if isUp then globalColor("Up") else globalColor("Down"), isUp);
AddLabel(showLabel and barNumber != 1, (if isConf then "Confirmed " else "Unconfirmed ") + "ZigZag: " + round(chg) + "%", if !isConf then globalColor("Unconfirmed") else if isUp then globalColor("Up") else globalColor("Down"));
Attachments
Last edited:

