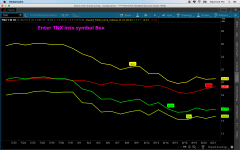
This indicator was shared by Ken Rose of TD Ameritrade to help you build your own Yield curve chart in ThinkorSwim. Be sure to visit the ToS' settings page and set your chart type to Line.

thinkScript Code
Code:
#TWITTER: @KROSE_TDA
#Yield curve two indexes
#declare lower;
def barn = if !IsNaN(close) then BarNumber() else Double.NEGATIVE_INFINITY;
input line_Weight = 3;
#input color = ("Light_Background", "Dark_Bacjkground");
Input Bubble_Offset = 12;
################################################
plot ThirtyYear = close("TYX");
thirtyYear.AssignValueColor(color.YELLOW);
thirtyYear.SetLineWeight(line_Weight);
addChartBubble  (barNumber()==highestAll(barn)-bubble_offset,thirtyYear,"30Yr",color.yellow);
#################################################
plot TenYear = close("TNX");
tenYear.AssignValueColor(color.GREEN);
tenYear.SetLineWeight(line_Weight);
addChartBubble  (barNumber()==highestAll(barn)-(bubble_offset -4),tenyear,"10Yr",color.GREEN);
########################################
plot FiveYear = close("FVX");
FiveYear.AssignValueColor(color.LIME);
FiveYear.SetLineWeight(line_Weight);
addChartBubble  (barNumber()==highestAll(barn)-(bubble_offset -6),fiveyear,"5Yr",color.LIME);
########################################
plot Threemonth = close("IRX");
threemonth.AssignValueColor(color.RED);
threemonth.SetLineWeight(line_Weight);
addChartBubble  (barNumber()==highestAll(barn)-(bubble_offset -8),threemonth,"3Mo",color.RED);
