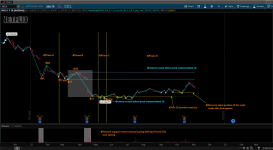
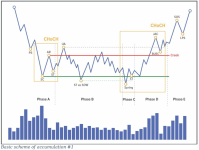
@halcyonguy have helped me get to a good point for this wyckoff indicator I've working on to identify the different phases and locate when a spring occur. I would like to share it and get some feedback on how to make it efficient and scannable.
Ruby:
# seq_peaks_valleys_01d

# https://usethinkscript.com/threads/how-do-i-code-a-sequence-of-events.11956/
# I am trying to code the sequence of events: ST then UR then LS as seen below with horizontal lines. If the sequence does not occur nothing gets plot on the chart. I have post the script and looking for some tips to do this. Thanks!

def bn = barnumber();
def na = double.nan;

def lastbn = HighestAll(If(IsNaN(close), 0, bn));
def lastbar = if (bn == lastbn) then 1 else 0;

def hibn = HighestAll(bn);
#def lastbar = !isnan(close[0]) and isnan(close[-1]);

def priceH = high;
def priceL = low;
def priceC = close;

def o = open;
def h = high;
def l = low;
def c = close;

input percentageReversal = 2;
input absoluteReversal = 0.0;
input atrLength = 2;
input atrReversal = 1;
input tickReversal = 0;

Assert(percentageReversal >= 0, "'percentage reversal' must not be negative: " + percentageReversal);
Assert(absoluteReversal >= 0, "'absolute reversal' must not be negative: " + absoluteReversal);
Assert(atrReversal >= 0, "'atr reversal' must not be negative: " + atrReversal);
Assert(tickReversal >= 0, "'ticks' must not be negative: " + tickReversal);
Assert(percentageReversal != 0 or absoluteReversal != 0 or atrReversal != 0 or tickReversal != 0, "Either 'percentage reversal' or 'absolute reversal' or 'atr reversal' or 'tick reversal' must not be zero");

def absReversal;
if (absoluteReversal != 0) {
    absReversal = absoluteReversal;
} else {
    absReversal =  tickReversal * TickSize();
}

def hlPivot;
if (atrReversal != 0) {
    hlPivot = percentageReversal / 100 + WildersAverage(TrueRange(high, close, low), atrLength) / close * atrReversal;
} else {
    hlPivot = percentageReversal / 100;
}


def state = {default init, undefined, uptrend, downtrend};
def maxPriceH;
def minPriceL;
def newMax;
def newMin;
def prevMaxH = GetValue(maxPriceH, 1);
def prevMinL = GetValue(minPriceL, 1);

if GetValue(state, 1) == GetValue(state.init, 0) {
    maxPriceH = priceH;
    minPriceL = priceL;
    newMax = yes;
    newMin = yes;
    state = state.undefined;
} else if GetValue(state, 1) == GetValue(state.undefined, 0) {
    if priceH >= prevMaxH {
        state = state.uptrend;
        maxPriceH = priceH;
        minPriceL = prevMinL;
        newMax = yes;
        newMin = no;
    } else if priceL <= prevMinL {
        state = state.downtrend;
        maxPriceH = prevMaxH;
        minPriceL = priceL;
        newMax = no;
        newMin = yes;
    } else {
        state = state.undefined;
        maxPriceH = prevMaxH;
        minPriceL = prevMinL;
        newMax = no;
        newMin = no;
    }
} else if GetValue(state, 1) == GetValue(state.uptrend, 0) {
    if priceL <= prevMaxH - prevMaxH * hlPivot - absReversal {
        state = state.downtrend;
        maxPriceH = prevMaxH;
        minPriceL = priceL;
        newMax = no;
        newMin = yes;
    } else {
        state = state.uptrend;
        if (priceH >= prevMaxH) {
            maxPriceH = priceH;
            newMax = yes;
        } else {
            maxPriceH = prevMaxH;
            newMax = no;
        }
        minPriceL = prevMinL;
        newMin = no;
    }
} else {
    if priceH >= prevMinL + prevMinL * hlPivot + absReversal {
        state = state.uptrend;
        maxPriceH = priceH;
        minPriceL = prevMinL;
        newMax = yes;
        newMin = no;
    } else {
        state = state.downtrend;
        maxPriceH = prevMaxH;
        newMax = no;
        if (priceL <= prevMinL) {
            minPriceL = priceL;
            newMin = yes;
        } else {
            minPriceL = prevMinL;
            newMin = no;
        }
    }
}


def barNumber = BarNumber();
def barCount = HighestAll(If(IsNaN(priceH), 0, barNumber));
def newState = GetValue(state, 0) != GetValue(state, 1);
def offset = barCount - barNumber + 1;
def highPoint = state == state.uptrend and priceH == maxPriceH;
def lowPoint = state == state.downtrend and priceL == minPriceL;

def lastH;
if highPoint and offset > 1 {
    lastH = fold iH = 1 to offset with tH = priceH while !IsNaN(tH) and !GetValue(newState, -iH) do if GetValue(newMax, -iH) or iH == offset - 1 and GetValue(priceH, -iH) == tH then Double.NaN else tH;
} else {
    lastH = Double.NaN;
}


def lastL;
if lowPoint and offset > 1 {
    lastL = fold iL = 1 to offset with tL = priceL while !IsNaN(tL) and !GetValue(newState, -iL) do if GetValue(newMin, -iL) or iL == offset - 1 and GetValue(priceL, -iL) == tL then Double.NaN else tL;
} else {
    lastL = Double.NaN;
}


plot ZZ;
if barNumber == 1 {
    ZZ = fold iF = 1 to offset with tP = Double.NaN while IsNaN(tP) do if GetValue(state, -iF) == GetValue(state.uptrend, 0) then priceL else if GetValue(state, -iF) == GetValue(state.downtrend, 0) then priceH else Double.NaN;
} else if barNumber == barCount {
    ZZ = if highPoint or state == state.downtrend and priceL > minPriceL then priceH else if lowPoint or state == state.uptrend and priceH < maxPriceH then priceL else Double.NaN;
} else {
    ZZ = if !IsNaN(lastH) then lastH else if !IsNaN(lastL) then lastL else Double.NaN;
}
ZZ.SetDefaultColor(GetColor(1));
ZZ.EnableApproximation();


input toggle = no;
input reversalamount = 8.0;

def ATRSave = if  !IsNaN(ZZ) then ZZ else GetValue(ATRSave, 1);
def ATRSave1 = if ATRSave != ATRSave[1] then ATRSave[1] else GetValue(ATRSave1, 1);
def ATRSave2 = if ATRSave != ATRSave then ATRSave else GetValue(ATRSave1, 1);
def ATRSave3 = if  ATRSave2 != ATRSave2[1] then ATRSave2[1] else GetValue(ATRSave3, 1);
def ATRSave4 = if  ATRSave3 != ATRSave3[1] then ATRSave3[1] else GetValue(ATRSave4, 1);
def ATRSave5 = if  ATRSave4 != ATRSave4[1] then ATRSave4[1] else GetValue(ATRSave5, 1);
def ATRSave6 = if  ATRSave5 != ATRSave5[1] then ATRSave5[1] else GetValue(ATRSave6, 1);
def ATRSave7 = if  ATRSave6 != ATRSave6[1] then ATRSave6[1] else GetValue(ATRSave7, 1);


#########################################################################################
#Sequence 1
#########################################################################################
input length = 20;
input trendSetup = 2;
input error = .90;

def ErrMargin = error * Average(BodyHeight(), length);
def IsWhite = open < close;
def IsAlmostEqual = AbsValue(ATRSave - ATRSave2) <= ErrMargin and IsDescending(ATRSave, trendSetup);

#def LR = isAlmostEqual;
def st1 = isAlmostEqual;


#plot test =  if st1 or st1[1] or st1[2] then (low - 3 * TickSize()) else Double.NaN;
plot test =  if st1 then (low - 3 * TickSize()) else Double.NaN;
Test.SetPaintingStrategy(PaintingStrategy.LINE_VS_POINTS);
Test.SetStyle(Curve.POINTS);
Test.SetDefaultColor(Color.white);
Test.HideBubble();
Test.HideTitle();

#########################################################################################
#Sequence 2
#########################################################################################
def Upper_ID = ATRSave > ATRSave1 && ATRSave > ATRSAve2 && ATRSave > ATRSave3 && ATRSave2 > ATRSave1 && ATRSave2 > ATRSave3 && (ATRSave1 > ATRSave3 or ATRSave3 > ATRSave1) ;

plot Upper_Resistance =  if Upper_ID then (high + 3 * TickSize()) else Double.NaN;
Upper_Resistance.SetPaintingStrategy(PaintingStrategy.LINE_VS_POINTS);
Upper_Resistance.SetStyle(Curve.POINTS);
Upper_Resistance.SetDefaultColor(Color.RED);
Upper_Resistance.HideBubble();
Upper_Resistance.HideTitle();

#########################################################################################
#Sequence 3
#########################################################################################
def Lower_ID = ATRSave1 > ATRSave && ATRSave1 > ATRSAve2 && ATRSave1 > ATRSave3 && ATRSave1 > ATRSave4 && ATRSave3 > ATRSave && ATRSave3 > ATRSave2 && ATRSave3 > ATRSave4 && ATRSave4 > ATRSave && (ATRSave4 > ATRSave2 or ATRSave2 > ATRSave4) && ATRSave2 > ATRSave;

plot Lower_Range =  if Lower_ID then (low - 3 * TickSize()) else Double.NaN;
Lower_Range.SetPaintingStrategy(PaintingStrategy.LINE_VS_POINTS);
Lower_Range.SetStyle(Curve.POINTS);
Lower_Range.SetDefaultColor(Color.GREEN);
Lower_Range.HideBubble();
Lower_Range.HideTitle();

#########################################################################################
#Chartbubble
#########################################################################################
addchartBubble(toggle, Test, "ST", color.WHITE, no);
addchartBubble(toggle, Upper_Resistance, "UR", color.RED, yes);
addchartBubble(toggle, Lower_Range, "LS", color.GREEN, no);

#########################################################################################


#
#

#   chg , disable these plots
#########################################################################################
#Horizontal Lines , most recent
#########################################################################################
input lineLength = 5;
#def BN = BarNumber();
def barCount1 = Highestall(If(IsNaN(test), 0.0, BN));
def closeLine = if BN == 1 then Double.NaN
                else if BN == barCount1 - linelength
                then test[-lineLength]
                else closeLine[1];
#plot x = closeline;


def barCount2 = Highestall(If(IsNaN(Upper_Resistance), 0.0, BN));
def closeLine2 = if BN == 1 then Double.NaN
                else if BN == barCount2 - linelength
                then Upper_Resistance[-lineLength]
                else closeLine2[1];
#plot x2 = closeline2;

def barCount3 = Highestall(If(IsNaN(Lower_Range), 0.0, BN));
def closeLine3 = if BN == 1 then Double.NaN
                else if BN == barCount3 - linelength
                then Lower_Range[-lineLength]
                else closeLine3[1];
#plot x3 = closeline3;


#-------------------------------------------------------------------
#-------------------------------------------------------------------
#-------------------------------------------------------------------

# check for the seq of 3 vars , ST , then UR, then LS

#chg vars
def st = test;
def ur = Upper_Resistance;
def ls = Lower_Range;

def st_bn = barCount1;
def ur_bn = barCount2;
def ls_bn = barCount3;

def st_lvl = closeLine;
def ur_lvl = closeLine2;
def ls_lvl = closeLine3;

#---------------------------

def st_bn2 = if st_bn != st_bn[1] then st_bn else st_bn[1];

def signal_bn = if st then st_bn
  else if ur then ur_bn
  else if ls then ls_bn
  else signal_bn[1];

def sigchg = if signal_bn[1] != signal_bn then 1 else 0;


def lines_en = if bn == 1 then 0
  else if bn == st_bn then
  fold i = 1 to (lastbn - bn +1)
    with p
    do p + (if (bn == getvalue(ur_bn, -i) or bn == getvalue(ls_bn, -i)) then 1 else 0)
  else lines_en[1];


def st2 = st1;

def ur2 = if bn == 1 then 0
  else if isnan(ur) then 0
  else if ur then 1
  else ur2[1];

def ls2 = if bn == 1 then 0
  else if isnan(ls) then 0
  else if ls then 1
  else ls2[1];


# cyan line peaks/valleys
def zz2 = if bn == 1 then 0
  else if isnan(zz) then 0
  else zz;

# var with values, that determine when a pattern is found
# when a value of 3 occurs, a full pattern exists , ST, UR, LS
def signals = if bn == 1 then 0
  else if st2 and signals[1] != 0 then 0
  else if ur2 and signals[1] != 1 then 0
  else if ls2 and signals[1] != 2 then 0
  else if signals[1] == 3 then 0
  else if st2 then 1
  else if ur2 and signals[1] == 1 then 2
  else if ls2 and signals[1] == 2 then 3
# if a non labeled peak or valley then 0
  else if (zz2 > 0 and (!st2 or !ur2 or !ls2)) then 0
  else signals[1];


def ls2_off = if bn == 1 then 0
  else if lastbar then 0
  else if st2 then fold j = 1 to ( (hibn+1) - bn)
    with q
    while !isnan(getvalue(close, -j)) and getvalue(signals, -j) > 0
    do ( if getvalue(signals, -(j-1)) == 2 and getvalue(signals, -j) == 3 then j else q)
  else if ls2_off[1] == 0 then 0
  else ls2_off[1] - 1;


def st2_bn = if bn == 1 then 0
  else if st2 and ls2_off > 0 then bn
  else if signals > 0 then st2_bn[1]
  else 0;

def ur2_bn = If bn == 1 then 0
  else if ur2 and ls2_off > 0 then bn
  else if signals > 0 then ur2_bn[1]
  else 0;

def ls2_bn = if st2 then (bn + ls2_off)
  else if signals > 0 then ls2_bn[1]
  else 0;

def pattern = if bn == 1 then 0
  else if (bn >= st2_bn and bn <= ls2_bn) then 1
  else 0;

#-----------------------------

# find high of pattern rng
def rnghi = if (bn == st2_bn and ls2_bn > 0) then
  Fold k = 0 to 100
  with r
  while getvalue(pattern, -k) > 0
  do if getvalue(high, -k) > r  then getvalue(high, -k) else r
else if pattern > 0 then rnghi[1]
else na;
#plot yy = rnghi;
#yy.SetPaintingStrategy(PaintingStrategy.HORIZONTAL);


def rnglo = if (bn == st2_bn and ls2_bn > 0) then
  fold m = 0 to 100
  with s = 99999
  while getvalue(pattern, -m) > 0
  do if getvalue(low, -m) < s  then getvalue(low, -m) else s
else if pattern > 0 then rnglo[1]
else na;
#plot ww = rnglo;
#ww.SetPaintingStrategy(PaintingStrategy.HORIZONTAL);


input show_clouds = yes;
def factor_percent = 4.0;
def top = if show_clouds then (1+(factor_percent/100))*rnghi else na;
def bot = if show_clouds then (1-(factor_percent/100))*rnglo else na;
addcloud(top, bot, color.light_gray, color.light_gray);


#plot zp = if pattern then high * 1.05 else na;
#zp.setdefaultcolor(color.cyan);
#zp.setlineweight(4);

# ---------------------------------------


#########################################################################################
#Horizontal Lines , most recent
#   chg to be when a pattern happens
#########################################################################################
#input lineLength = 5;
#def BN = BarNumber();
#def barCount1 = Highestall(If(IsNaN(test), 0.0, BN));


# plot test =  if st1 then (low - 3 * TickSize()) else Double.NaN;
def diplvl = low - (3 * TickSize());
def peaklvl = high + (3 * TickSize());

def st_line = if BN == 1 then 0
  else if bn == st2_bn and ls2_bn > 0 then diplvl
  else st_line[1];
plot stx = if st_line > 0 then st_line else na;
stx.setdefaultcolor(color.cyan);
#stx.setlineweight(4);
stx.SetPaintingStrategy(PaintingStrategy.HORIZONTAL);

Def ur_Line = if BN == 1 then Double.NaN
  else if BN == ur2_bn and ls2_bn > 0 then peaklvl
  else ur_line[1];
plot urx = if ur_line > 0 then ur_line else na;
urx.setdefaultcolor(color.violet);
urx.SetPaintingStrategy(PaintingStrategy.HORIZONTAL);

def ls_line = if BN == 1 then Double.NaN
  else if BN == ls2_bn and signals[1] == 2 then diplvl
  else ls_line[1];
plot lsx = if ls_line > 0 then ls_line else na;
lsx.setdefaultcolor(color.orange);
lsx.SetPaintingStrategy(PaintingStrategy.HORIZONTAL);


#--------------------------------------------

#  LR = true on st valley
input test1 = no;
addchartbubble(test1, 100,
st1 + " LR\n" +
(low - 3 * TickSize()) + "\n" +
ticksize()
#+
#test
, (if st1 then color.yellow else color.gray), no);


addchartbubble(0, low*0.88,
bn + "\n" +
st2_bn + "\n" +
st_line + "\n" +

ur2_bn + "\n" +
ls2_bn + "\n" +
signals  + "\n" +

# na
#test[-lineLength] + "\n" +
pattern + "\n" +
diplvl
# cause fold error
#pattern[-lineLength]
, color.yellow, no);


#-----------------------------------------------

addchartbubble(0, low*0.96 ,
#addchartbubble(signals > 0, low*0.96 ,
bn + " \n" +
( lastbn - bn) + "\n" +
ls2_off + " off\n" +
(bn + ls2_off) + " LS bn\n" +
zz2 + " zz\n" +
st2 + " st2\n" +
ur2 + " ur2\n" +
ls2 + " ls2\n" +
signals + "\n" +
ls2_bn
, color.yellow, no);

#addverticalline( signals == 3 , "-", color.cyan);