Workaround for passing a variable to fold?

pkerrant

New member
I've been trying to write a script that, for a given segment of time (say BarNumber = x, to BarNumber = y), finds the price level at which the area of the price action above that level is equal to the area of the price action below that price level.

It's easy enough to write fold statements that calculate area above and below a given price level, but after that I run into problems. I'm new to thinkscript, so I'm hoping there's a way to do this I'm not familiar with. Since for this study I need to iterate through a price range to check if the area_above(p) = area_below(p), and I'm not aware of another way of iterating in thinkscript other than using fold, I wrote a script that is passed the relevant variables and calculates the areas, then tried to call that script in another fold statement (passing the index of that fold to the script to determine the price level) which would return either the price level if area_above = area_below or 0 otherwise. The problem is that the index of the final fold is not recognized as a variable for the script.

I've included the code below so you can see what I mean. I found a post from 2019 on stackOverflow asking about this problem and the answer at the time was "it's a known bug, no workaround exists," so I'm really hoping that someone's figured out a workaround since. (I get the same error as that post from 2019.)

Does anyone know of any workarounds? Or can think of another way to algorithmically find such a price level for a given chart segment? In the end I'd like to have a plot where I pass either a starting bar number X and ending bar number Y (or just an ending bar number Y, and X can be 1) and at each bar Z on that segment (X < Z < Y) it plots the price at which the price action area above that price is equal to the price action area under that price for segment Z to Y.

Code:
input fromBar = 1;
input toBar = 10;
input center_price = 400.00;
input price_range_low = 400.00;
input price_range_high = 410.00;
input band_increment = 0.25;


script areaDelta_hilo {


input index_map = 0;
input price_increment = 1;
input segStart = 0;
input segEnd = 10;
input range_bottom = 0;
input range_top = 10;


#### index_map is what will be passed to the script, is the index of the fold that returns either a price that meets the criteria or 0


def price = index_map * price_increment + range_bottom;


def above_price_highs = fold
i = 0 to BarNumber()
with j = 0
DO
if (
    GetValue(BarNumber(), i) >= segStart
    and
    Getvalue(BarNumber(), i) < segEnd
    and GetValue(high, i) > price,
    j + GetValue(high, i) - price,
    j);


def below_price_lows = fold
a = 0 to BarNumber()
with b = 0
DO
if (
    GetValue(BarNumber(), a) >= segStart
    and
    GetValue(BarNumber(), a) < segEnd
    and
    GetValue(low, a) < price,
    b + price - GetValue(low, a),
    b);


plot area_delta = above_price_highs - below_price_lows;


}


def index_high = (1/band_increment)*(price_range_high - price_range_low);


def isMean = fold
index = 0 to index_high
with d = 0
DO
if (
    areaDelta_hilo(index_map = index, price_increment = band_increment, segStart=fromBar, segEnd=toBar, range_bottom = price_range_low, range_top = price_range_high).area_delta == 0,
    d + (d*band_increment) + price_range_low,
    d);

### Thinkscript throws the error: No such variable: index.
 
Solution
i just reread your post1 and realize this isn't exactly what you asked for.
you wanted to specify a start and stop bar. mine runs on the last 4 bars on the chart.

i've been looking at this for awhile. sometimes it seems to work fine, sometimes not. maybe it is a fluke in how fold loops are processed?
i'm going to post my code that i have so far, so maybe someone can fix it or say it is as good as it gets.


find a price level where half the area of the x bars are below that level.

pick a quantity of bars, x, that define the last x bars on the chart,
calc total area (high - low) of the x bars,
calc half the area,
do stuff on the x bar before the lastbar,
loop from lowest low of the x bars, up towards the highest high,
calculating...
I've been trying to write a script that, for a given segment of time (say BarNumber = x, to BarNumber = y), finds the price level at which the area of the price action above that level is equal to the area of the price action below that price level.

It's easy enough to write fold statements that calculate area above and below a given price level, but after that I run into problems. I'm new to thinkscript, so I'm hoping there's a way to do this I'm not familiar with. Since for this study I need to iterate through a price range to check if the area_above(p) = area_below(p), and I'm not aware of another way of iterating in thinkscript other than using fold, I wrote a script that is passed the relevant variables and calculates the areas, then tried to call that script in another fold statement (passing the index of that fold to the script to determine the price level) which would return either the price level if area_above = area_below or 0 otherwise. The problem is that the index of the final fold is not recognized as a variable for the script.

I've included the code below so you can see what I mean. I found a post from 2019 on stackOverflow asking about this problem and the answer at the time was "it's a known bug, no workaround exists," so I'm really hoping that someone's figured out a workaround since. (I get the same error as that post from 2019.)

Does anyone know of any workarounds? Or can think of another way to algorithmically find such a price level for a given chart segment? In the end I'd like to have a plot where I pass either a starting bar number X and ending bar number Y (or just an ending bar number Y, and X can be 1) and at each bar Z on that segment (X < Z < Y) it plots the price at which the price action area above that price is equal to the price action area under that price for segment Z to Y.

Code:
input fromBar = 1;
input toBar = 10;
input center_price = 400.00;
input price_range_low = 400.00;
input price_range_high = 410.00;
input band_increment = 0.25;


script areaDelta_hilo {


input index_map = 0;
input price_increment = 1;
input segStart = 0;
input segEnd = 10;
input range_bottom = 0;
input range_top = 10;


#### index_map is what will be passed to the script, is the index of the fold that returns either a price that meets the criteria or 0


def price = index_map * price_increment + range_bottom;


def above_price_highs = fold
i = 0 to BarNumber()
with j = 0
DO
if (
    GetValue(BarNumber(), i) >= segStart
    and
    Getvalue(BarNumber(), i) < segEnd
    and GetValue(high, i) > price,
    j + GetValue(high, i) - price,
    j);


def below_price_lows = fold
a = 0 to BarNumber()
with b = 0
DO
if (
    GetValue(BarNumber(), a) >= segStart
    and
    GetValue(BarNumber(), a) < segEnd
    and
    GetValue(low, a) < price,
    b + price - GetValue(low, a),
    b);


plot area_delta = above_price_highs - below_price_lows;


}


def index_high = (1/band_increment)*(price_range_high - price_range_low);


def isMean = fold
index = 0 to index_high
with d = 0
DO
if (
    areaDelta_hilo(index_map = index, price_increment = band_increment, segStart=fromBar, segEnd=toBar, range_bottom = price_range_low, range_top = price_range_high).area_delta == 0,
    d + (d*band_increment) + price_range_low,
    d);

### Thinkscript throws the error: No such variable: index.


sorry, i don't understand what you are trying to do.
the words you used don't describe what is supposed to happen.
area has no meaning.
please try to think about your task and rewrite the rules. make specific , short statements, using just open, high, low, close. don't write code, don't mention fold.


example,

on every bar,
look back at the 15 previous bars,
calc the difference of the current bar close to each of the 15 previous high's
if a difference is > 0 then ... do something... add up the numbers?

do similar for comparing close to previous lows

compare the high-number to the low-number
test if they are within x %

what to do if they are equal?
draw a horizontal line?
draw some colors over some regions/rectangles?


------------------
this isn't going to do what you think it should.
= fold i = 0 to BarNumber()
looping to barnumber can produce odd results. i have seen it skip every other value.
should use a constant or highestall(barnumber())

-----------------

studies with fold , to study, that might give you some ideas

rank
https://usethinkscript.com/threads/rank-volume-1-10.9504/

mvp - nested fold loops
https://usethinkscript.com/threads/ants-—-momentum-volume-and-price-mvp.7497/#post-74080
 
Last edited:

Join useThinkScript to post your question to a community of 21,000+ developers and traders.

sorry, i don't understand what you are trying to do.
the words you used don't describe what is supposed to happen.
area has no meaning.
please try to think about your task and rewrite the rules. make specific , short statements, using just open, high, low, close. don't write code, don't mention fold.


example,

on every bar,
look back at the 15 previous bars,
calc the difference of the current bar close to each of the 15 previous high's
if a difference is > 0 then ... do something... add up the numbers?

do similar for comparing close to previous lows

compare the high-number to the low-number
test if they are within x %

what to do if they are equal?
draw a horizontal line?
draw some colors over some regions/rectangles?


------------------
this isn't going to do what you think it should.
= fold i = 0 to BarNumber()
looping to barnumber can produce odd results. i have seen it skip every other value.
should use a constant or highestall(barnumber())

-----------------

studies with fold , to study, that might give you some ideas

rank
https://usethinkscript.com/threads/rank-volume-1-10.9504/

mvp - nested fold loops
https://usethinkscript.com/threads/ants-—-momentum-volume-and-price-mvp.7497/#post-74080
The study I posted does indeed do what I describe it doing (I test results manually bc of how buggy I've found thinkscript to be), and area under a curve certainly does have a very standard meaning, so I admit I'm confused about your confusion. Maybe I can be clearer: since candle charts condense price action information into discrete blocks of time, you obviously can't take a standard integral, and there are various established analogs of the usual analytic (calculus) operations on a continuous function that you can apply to discrete data sets. This is just a really simple hacked together version of one of those, where I just take the min/max (high or low) for a given candle / discrete unit of time to represent the value of the function for that discrete delta (dx) of time. It's actually part of the way integral operations are built from the ground up in analysis. (Rudin is a good book for this if you're interested, and it touches on other cool areas of math in a way that got me interested in those areas, too.)

I'm confused (ha) about what you mean by this:

"
what to do if they are equal?
draw a horizontal line?
draw some colors over some regions/rectangles?"

I don't care what they are; I'm interested in the plot of the summation over a segment of time and where that crosses zero. If they're "equal" for a given candle -- I assume you're talking about the case where a candle's high is the same "distance" from this price level as that same level's low -- the contribution to the summation is zero, and that is correct for that candle. Over the length of a given segment the total sum will vary, and I'm interested in when it's zero.

"
this isn't going to do what you think it should.
= fold i = 0 to BarNumber()
looping to barnumber can produce odd results. i have seen it skip every other value.
should use a constant or highestall(barnumber())"

This is concerning; I've already seen thinkscript behave in incredibly weird ways, so I'm in the habit of testing results with random sampling already (which is tiring). I get consistent error messages when I try to limit the index range to an input variable (which I would have preferred to do for memory reasons). is this a known bug too?

Regardless of how you feel about the purpose, I gather you don't have a workaround for passing a variable involving the index to a predefined script within fold? Someone suggested this wasn't possible in TS in a DM, but I'd like to clarify if they specifically meant what I was trying to do here or if those were more general limitations of TS.
 
@pkerrant,
You're coming in from the perspective of a java programmer or other similar language, yes? This is not a personal attack, but figuring out where your assumptions about ThinkScript are coming from may help in deciphering how best to approach a solution for you.

ThinkScript does not, categorically, behave in weird ways. But it is a functional language, and the ways of the functional language paradigm can be off-putting to people who aren't familiar with them. If you are well versed in functional programming, you have my condolences and apologies for making assumptions.

I suggested java as your language of history as you talk about saving memory. We don't usually worry about such things in ThinkScript, as the system handles all of that for us. Any script that ThinkOrSwim deems too complex, is given a warning triangle, and that limits what you can do with it to some degree. Any use of highestAll() -- any *all() function, really -- will result in complexity warnings.

I wonder though about java as your language of history since the idea of variable scope would tell you that index would be out of scope outside of its fold function. We cannot use inner variables outside of their loops, they just don't exist. They are declared, used, and destroyed as needed by the fold() function and do not persist.

You can build fold loops that will return a counter when a condition is met. That is, they iterate over their length (whole, no parts, no early break) and add one to a counter and stop adding when the condition is met, then returning that counter variable with the bar number inside their loop where the condition was met.

As general advice, I see fold statements kind of like many folks see regex... if the solution requires regex, it isn't the correct solution. It's an exaggeration, but not by much for ThinkScript.

To your proposed indicator, you're looking to find the points (as bars within a fold) where the integral of the midpoint of price crosses some arbitrary "zero" line? Can you explain what you're looking to do with that information? I'm drawing a blank on how to use that information... if you had a counter, you could plot the relative bar number in a series (say 1 to 20 bars back) and have a graph that would show how close to the most recent bar in the series the zero (first crossing only) happened. That would tell you something, but I'm not sure it's what you're looking for beyond my understanding the mathematics of what you're attempting.

We really do try to help around here. But we may need some more on what you're trying to do (not just the code but the idea behind it sometimes) to be able to help you.

-mashume
 
The study I posted does indeed do what I describe it doing (I test results manually bc of how buggy I've found thinkscript to be), and area under a curve certainly does have a very standard meaning, so I admit I'm confused about your confusion. Maybe I can be clearer: since candle charts condense price action information into discrete blocks of time, you obviously can't take a standard integral, and there are various established analogs of the usual analytic (calculus) operations on a continuous function that you can apply to discrete data sets. This is just a really simple hacked together version of one of those, where I just take the min/max (high or low) for a given candle / discrete unit of time to represent the value of the function for that discrete delta (dx) of time. It's actually part of the way integral operations are built from the ground up in analysis. (Rudin is a good book for this if you're interested, and it touches on other cool areas of math in a way that got me interested in those areas, too.)

I'm confused (ha) about what you mean by this:

"
what to do if they are equal?
draw a horizontal line?
draw some colors over some regions/rectangles?"

I don't care what they are; I'm interested in the plot of the summation over a segment of time and where that crosses zero. If they're "equal" for a given candle -- I assume you're talking about the case where a candle's high is the same "distance" from this price level as that same level's low -- the contribution to the summation is zero, and that is correct for that candle. Over the length of a given segment the total sum will vary, and I'm interested in when it's zero.

"
this isn't going to do what you think it should.
= fold i = 0 to BarNumber()
looping to barnumber can produce odd results. i have seen it skip every other value.
should use a constant or highestall(barnumber())"

This is concerning; I've already seen thinkscript behave in incredibly weird ways, so I'm in the habit of testing results with random sampling already (which is tiring). I get consistent error messages when I try to limit the index range to an input variable (which I would have preferred to do for memory reasons). is this a known bug too?

Regardless of how you feel about the purpose, I gather you don't have a workaround for passing a variable involving the index to a predefined script within fold? Someone suggested this wasn't possible in TS in a DM, but I'd like to clarify if they specifically meant what I was trying to do here or if those were more general limitations of TS.

i've read your post 1 about 10 times and think i'm getting it. working on something, but just on my cell for now. might be a day or.. til i get to computer.

i was hung up on area, thinking of lower area from a curve(close) down to 0. then the above area would be from close up to infinity.... but that's not what you want.
if instead of saying area, you only used open,high,low,close to describe the desired regions, it would be clearer.
 
Last edited:
The study I posted does indeed do what I describe it doing (I test results manually bc of how buggy I've found thinkscript to be), and area under a curve certainly does have a very standard meaning, so I admit I'm confused about your confusion. Maybe I can be clearer: since candle charts condense price action information into discrete blocks of time, you obviously can't take a standard integral, and there are various established analogs of the usual analytic (calculus) operations on a continuous function that you can apply to discrete data sets. This is just a really simple hacked together version of one of those, where I just take the min/max (high or low) for a given candle / discrete unit of time to represent the value of the function for that discrete delta (dx) of time. It's actually part of the way integral operations are built from the ground up in analysis. (Rudin is a good book for this if you're interested, and it touches on other cool areas of math in a way that got me interested in those areas, too.)

I'm confused (ha) about what you mean by this:

"
what to do if they are equal?
draw a horizontal line?
draw some colors over some regions/rectangles?"

I don't care what they are; I'm interested in the plot of the summation over a segment of time and where that crosses zero. If they're "equal" for a given candle -- I assume you're talking about the case where a candle's high is the same "distance" from this price level as that same level's low -- the contribution to the summation is zero, and that is correct for that candle. Over the length of a given segment the total sum will vary, and I'm interested in when it's zero.

"
this isn't going to do what you think it should.
= fold i = 0 to BarNumber()
looping to barnumber can produce odd results. i have seen it skip every other value.
should use a constant or highestall(barnumber())"

This is concerning; I've already seen thinkscript behave in incredibly weird ways, so I'm in the habit of testing results with random sampling already (which is tiring). I get consistent error messages when I try to limit the index range to an input variable (which I would have preferred to do for memory reasons). is this a known bug too?

Regardless of how you feel about the purpose, I gather you don't have a workaround for passing a variable involving the index to a predefined script within fold? Someone suggested this wasn't possible in TS in a DM, but I'd like to clarify if they specifically meant what I was trying to do here or if those were more general limitations of TS.

just an update...
been looking at this on and off...
i think i have something ( with a nested fold) , but as usual got interupted ...
hope to test and post something later on.

....and... there's a bug..... aaargh
 
Last edited:
i just reread your post1 and realize this isn't exactly what you asked for.
you wanted to specify a start and stop bar. mine runs on the last 4 bars on the chart.

i've been looking at this for awhile. sometimes it seems to work fine, sometimes not. maybe it is a fluke in how fold loops are processed?
i'm going to post my code that i have so far, so maybe someone can fix it or say it is as good as it gets.


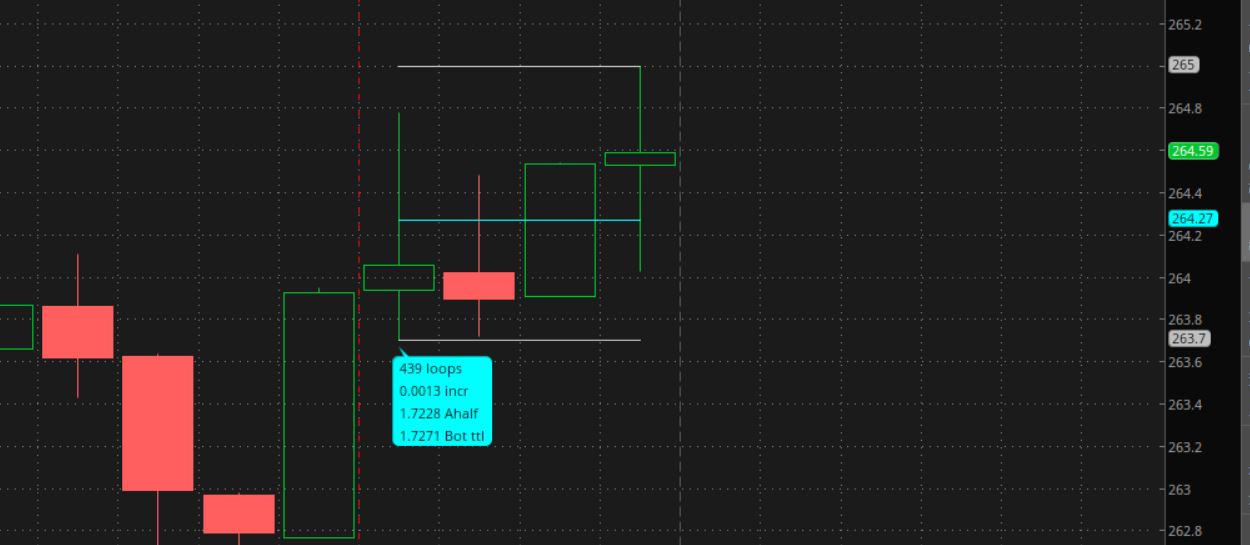
find a price level where half the area of the x bars are below that level.

pick a quantity of bars, x, that define the last x bars on the chart,
calc total area (high - low) of the x bars,
calc half the area,
do stuff on the x bar before the lastbar,
loop from lowest low of the x bars, up towards the highest high,
calculating the area under a calculated price level, until half the area is found.
then save the main loop counter

loop counter * increment + lolo = the price level


Code:
#fold_area_barsback_horz_line_00j

# find a price level where half the area of the x bar are below the line.
# do stuff on the x bar before the lastbar.
#  loop from lowest low of the x bars,
#   up towards the highest high,
#    calculating the area under a calculated price level, until half the area is found.
#     then save the main loop counter

#https://usethinkscript.com/threads/workaround-for-passing-a-variable-to-fold.15791/
#I've been trying to write a script that, for a given segment of time (say BarNumber = x, to BarNumber = y),
#finds the price level at which the area of the price action above that level
#is equal to the area of the price action below that price level.

def na = Double.NaN;
def bn = BarNumber();

def lastbn = HighestAll(If(IsNaN(close), 0, bn));
def lastbar = if (bn == lastbn) then 1 else 0;

input bars = 4;
def barx = !IsNaN(close[-(bars-1)]) and IsNaN(close[-(bars+0)]);
def bars_rng = !IsNaN(close) and IsNaN(close[-(bars+0)]);

addlabel(1, bars + " bars back", color.yellow);
input show_vert_line = yes;
AddVerticalLine(show_vert_line and barx, "-");


def ht = (high - low);
# calc area in future bars
def areasum = Sum(ht[-(bars-1)], bars);
def areahalf = areasum / 2;

# calc area of x last bars
def a2 = fold c = 0 to bars
  with r
  do r + (getValue(high, -c) - GetValue(low, -c));

def n = 1000;

def x;
def pricelevel;
def hi;
def lo;
def rng;
def res;
if bn == 1 then {
x = 0;
pricelevel = 0;
hi = 0;
lo = 0;
rng = 0;
res = 0;
} else if barx then {
hi = Highest(high[-(bars-1)], bars);
lo = Lowest(low[-(bars-1)], bars);
rng = hi - lo;
x = 0;
res = round(rng/n, 4);

pricelevel = fold i = 0 to n
 with p
 do p + if (
  fold b = 0 to bars
  with q
  do q + (if (lo + (i*res)) < GetValue(low, -b) then 0
   else if ((lo + (i*res)) < GetValue(high, -b)) and ((lo + (i*res)) > GetValue(low, -b)) then ((lo + (i*res)) - GetValue(low, -b))
   else ht)) < areahalf then 1 else 0;
#   else ht)) < areahalf then i else p;

} else if isnan(close) then {
x = 0;
pricelevel = 0;
hi = 0;
lo = 0;
rng = 0;
res = 0;
} else {
x = x[1];
pricelevel = pricelevel[1];
hi = hi[1];
lo = lo[1];
rng = rng[1];
res = res[1];
}

def pricelevel2 = round(lo + (pricelevel * res),3);

plot zpr = if pricelevel2 > 0 then pricelevel2 else na;
plot zhi = if hi > 0 then hi else na;
plot zlo = if lo > 0 then lo else na;
zpr.SetDefaultColor(Color.cyan);
zhi.SetDefaultColor(Color.light_gray);
zlo.SetDefaultColor(Color.light_gray);
#x.hidebubble();


# calc partial bars on each side of horz line
def topz =  if high <= pricelevel2 then 0
 else if low >= pricelevel2 then ht
 else (high - pricelevel2);

def botz = if low >= pricelevel2 then 0
 else if high <= pricelevel2 then ht
 else (pricelevel2 - low);

def topttl = if bn == 1 then 0 else if bars_rng then (topttl[1] + topz) else topttl[1];
def botttl = if bn == 1 then 0 else if bars_rng then (botttl[1] + botz) else botttl[1];

def t = if pricelevel2 > low then pricelevel2 - low else 0;


input show_triangle_first_bar = no;
plot zb = if show_triangle_first_bar and barx then high*1.001 else na;
zb.SetPaintingStrategy(PaintingStrategy.TRIANGLES);
#zb.SetPaintingStrategy(PaintingStrategy.points);
zb.SetDefaultColor(Color.cyan);
zb.setlineweight(3);
zb.hidebubble();

#----------------
# test stuff

input test3 = yes;
addchartbubble(test3 and barx, lo-0.03,
pricelevel + " loops\n" +
res + " incr\n" +
areahalf + " Ahalf\n" +
botttl[-bars-1] + " Bot ttl\n"
, color.cyan, no);


input test1 = no;
addchartbubble(test1 and bars_rng, lo-0.03,
ht + " ht\n" +
pricelevel2 + " p2\n" +
topz + " top\n" +
botz + " bot\n" +
topttl + " Tttl\n" +
botttl + " Bttl\n" +
t + "\n" +
x
, color.yellow, no);


input test2 = no;
addchartbubble(test2 and barx[-1], lo[-1]-0.03,
ht[-1] + " ht\n" +
areasum[-1] + " A\n" +
a2[-1] + " a2\n" +
areahalf[-1] + " Ah\n" +
hi[-1] + " hi\n" +
lo[-1] + " lo\n" +
rng[-1] + " rng\n" +
pricelevel[-1] + " pr\n" +
pricelevel2[-1] + " p2\n" +
res[-1] + " res"
, color.cyan, no);


# test - mid line
#def mid = (lo + (rng/2));
#plot w = if mid > 0 then mid else na;
#

draw a cyan horizontal line, at the price level ,
where area of the x bars area is below the line
list : quantity of loop iterations, increment $, areas
uyTBZ0g.jpg
 
Last edited:
Solution

Similar threads

Not the exact question you're looking for?

Start a new thread and receive assistance from our community.

87k+ Posts
409 Online
Create Post

Similar threads

Similar threads

The Market Trading Game Changer

Join 2,500+ subscribers inside the useThinkScript VIP Membership Club
  • Exclusive indicators
  • Proven strategies & setups
  • Private Discord community
  • ‘Buy The Dip’ signal alerts
  • Exclusive members-only content
  • Add-ons and resources
  • 1 full year of unlimited support

Frequently Asked Questions

What is useThinkScript?

useThinkScript is the #1 community of stock market investors using indicators and other tools to power their trading strategies. Traders of all skill levels use our forums to learn about scripting and indicators, help each other, and discover new ways to gain an edge in the markets.

How do I get started?

We get it. Our forum can be intimidating, if not overwhelming. With thousands of topics, tens of thousands of posts, our community has created an incredibly deep knowledge base for stock traders. No one can ever exhaust every resource provided on our site.

If you are new, or just looking for guidance, here are some helpful links to get you started.

What are the benefits of VIP Membership?
VIP members get exclusive access to these proven and tested premium indicators: Buy the Dip, Advanced Market Moves 2.0, Take Profit, and Volatility Trading Range. In addition, VIP members get access to over 50 VIP-only custom indicators, add-ons, and strategies, private VIP-only forums, private Discord channel to discuss trades and strategies in real-time, customer support, trade alerts, and much more. Learn all about VIP membership here.
How can I access the premium indicators?
To access the premium indicators, which are plug and play ready, sign up for VIP membership here.
Back
Top