Why Using Different Types of Indicators Is Important To Successful Trading In ThinkOrSwim

Hi @MerryDay

1) I am new to trading on thinkorswim and I was reading about The Big Four Indicator study which includes four indicators, AK Trend + Zscore + Ehlers + Anchored Momentum in addition to the TMO indicator.

Are any of these (4 + the TMO) part of the multicollinearity trap that are mentioned above in this thread?

AK Trend = Trend indicator?
Zscore = Volatility indicator? (because of being based on signed number of standard deviations)
Ehlers = ??
Anchored Momentum = Momentum indicator?
TMO = Momentum indicator?


2) And are you familiar with any other studies on the UTS forums that combine the indicators mentioned below for example, or have multiple indicators combined with no multicollinearity?

  • Standard deviation + MACD + OBV
  • MA crossover + MFI
  • Bollinger bands + RSI + Volume Oscillator
  • PSAR + ROC + Trendlines
  • PSAR + MFI + Trendlines
Thank you.

1. Yes, The Big Four is a collinear trend indicator.
Trend indicators, whether you use 1 or 4 can be very profitable when a trending.
Can be losers, when a trade ranges.

2. There is NEVER a need to stuff multiple indicators into one study. There is no Holy Grail. There are no indicators that are going to line up perfectly on one bar under all circumstances on all timeframes to give you a perfect arrow. If you find such a thing, run in the other direction.

a. Choose your three non-collinear indicators.
b. Google why you always review three different timeframe charts and then choose what yours are going to be.
Then read more:
https://usethinkscript.com/threads/basics-for-developing-a-good-strategy.8058/
 
Last edited:
@MerryDay Very interesting thread. Surprised I didn't come across this earlier. In my experience I too have come across many indicators that spit out the same information 2/3 of the time. Even custom indicators that have been posted on here are very similar to the already popular indicators. My thing with these collinear indicators is that they will give you the same results if you do not change the default paramters. As the big 4 indicator uses 4 indicators which you could say are collinear to some degree they all have different paramters and when compared individually they give you different entries and exits. So, my question is, if you change the paramters on a collinear indicator and combine it with another one which also has different paramters does that change the affect hiw collinear they are?
 
@MerryDay Very interesting thread. Surprised I didn't come across this earlier. In my experience I too have come across many indicators that spit out the same information 2/3 of the time. Even custom indicators that have been posted on here are very similar to the already popular indicators. My thing with these collinear indicators is that they will give you the same results if you do not change the default paramters. As the big 4 indicator uses 4 indicators which you could say are collinear to some degree they all have different paramters and when compared individually they give you different entries and exits. So, my question is, if you change the paramters on a collinear indicator and combine it with another one which also has different paramters does that change the affect hiw collinear they are?
Absolutely!
By changing the defaults, the indicators are no longer collinear, they are not showing the same information.
By changing the defaults, it is possible to mimic multiple timeframe views, shorter lengths approximate lower aggregations, while longer lengths provide upper aggregation viewpoint which is so important to find trend; but without the repainting aspect of MTFs.

I use mostly Volume indicators. While technically collinear; they emphasize different views of volume with different defaults;
This allows me to view pure candle-by-candle Volume action with one indicator but important Volume trends on another.
https://usethinkscript.com/threads/favorite-volume-indicators-in-thinkorswim.15694/#post-126275
 
Last edited:
This post is a condensed compilation of Dr. Rajeev Shukla’s Study of Multicollinearity of Technical Indicators

The use of multiple indicators is a fundamental basis of technical analysis. Two or more different types of indicators confirming entry greatly increase the odds of a profitable trade.

Ahhhh. But there is the rub. They must be different types of indicators. Half of all retail investors trading technical indicators have poor overall results due to using multicollinear analysis. Meaning their strategy is using multiple indicators but one or more of them are the same type of indicator.

So look at your charts. Indicators are collinear with another one if they rise, fall, make bottoms and tops in about the same locations.
View attachment 10087

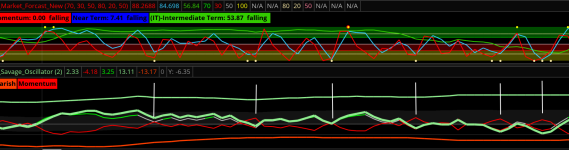
Here are some of the most common indicators that investors use together under the mistaken assumption that they are confirming their entry signal:
View attachment 10088
The study linked at the top of this post provides a more complete list of common indicators that cannot be used together to confirm signal.

A good strategy must use two or more of these different types of indicators:
Trend indicators
Volatility indicators
Momentum indicators
Cycle indicators
Market strength indicators
Support and resistance indicators

Advantages of unrelated indicators:
• The best regression models are those in which the predictor variables each correlate highly with the dependent (outcome) variable but correlate at most only minimally with each other.
• Such a model is often called "low noise" and will be statistically robust (that is, it will predict reliably across numerous samples of variable sets drawn from the same statistical population).

Some examples of indicators when used together in certain strategies provide strong confirmation of entry:
The research referenced at the top of the post provides charts and illustrates the proper use of these groups of indicators. These are NOT the only grouping of indicators that result in strong confirmation signals. You can mix from the categories of indicators above and see which ones improve the signal for your strategy.

Traders who use technical indicators carefully and effectively can more accurately pinpoint high probability trading set-ups, increasing their odds of success in the markets. However, combining different types of indicators in a strategy results in much fewer trade possibilities, as only strong confirmations are triggered. It takes maturity, experience, confidence, and patience to wait for a strong confirmation signal. As a result, a majority of retail traders don't follow the concepts laid out here. They still have a chance of making profitable trades. The problem with trading lower probability setups is that you will have profits but you will chance incurring significant unprofitable trades.

Technical analysis deals in probabilities rather than certainties. There is no combination of indicators that will accurately predict the markets' moves 100% of the time. The point is that the use of different types of indicators has been shown to statistically significantly increase those probabilities. If your strategy isn't working for you or is working but also incurs large losses, try adding one of the above combinations to your strategy. You will make fewer trades but increase profitability.

PS: This doesn’t mean you never use same-type, non-repainting indicators. Same-type indicators using different lengths and lookbacks are useful in weeding out false signals of any one indicator. But you then still need a different type of indicator for confirmation of entry. (Multiple repainting indicators are redundant. The repainting has already eliminated all the false signals).
HTH
I just found this. It make a lot of sense. I had not even thought of that concept. @MerryDay , Do you know if there are any specific strategies/studies that have been put together that implements a combination of these?
 
I just found this. It make a lot of sense. I had not even thought of that concept. @MerryDay , Do you know if there are any specific strategies/studies that have been put together that implements a combination of these?
For scalping? You are limited because many of the technical indicators have lag.

For momentum: RSI is no lag.
For trend following: they all have lag so are contra-indicated on your timeframes
For trend confirming: MACD is no lag.
For volume: try relative volume spike.

For entry: look at candle patterns, support & resistance, and price action:
https://usethinkscript.com/threads/price-action-toolbox-for-thinkorswim.10747/
 

Join useThinkScript to post your question to a community of 21,000+ developers and traders.

Similar threads

Not the exact question you're looking for?

Start a new thread and receive assistance from our community.

87k+ Posts
502 Online
Create Post

Similar threads

Similar threads

The Market Trading Game Changer

Join 2,500+ subscribers inside the useThinkScript VIP Membership Club
  • Exclusive indicators
  • Proven strategies & setups
  • Private Discord community
  • ‘Buy The Dip’ signal alerts
  • Exclusive members-only content
  • Add-ons and resources
  • 1 full year of unlimited support

Frequently Asked Questions

What is useThinkScript?

useThinkScript is the #1 community of stock market investors using indicators and other tools to power their trading strategies. Traders of all skill levels use our forums to learn about scripting and indicators, help each other, and discover new ways to gain an edge in the markets.

How do I get started?

We get it. Our forum can be intimidating, if not overwhelming. With thousands of topics, tens of thousands of posts, our community has created an incredibly deep knowledge base for stock traders. No one can ever exhaust every resource provided on our site.

If you are new, or just looking for guidance, here are some helpful links to get you started.

What are the benefits of VIP Membership?
VIP members get exclusive access to these proven and tested premium indicators: Buy the Dip, Advanced Market Moves 2.0, Take Profit, and Volatility Trading Range. In addition, VIP members get access to over 50 VIP-only custom indicators, add-ons, and strategies, private VIP-only forums, private Discord channel to discuss trades and strategies in real-time, customer support, trade alerts, and much more. Learn all about VIP membership here.
How can I access the premium indicators?
To access the premium indicators, which are plug and play ready, sign up for VIP membership here.
Back
Top