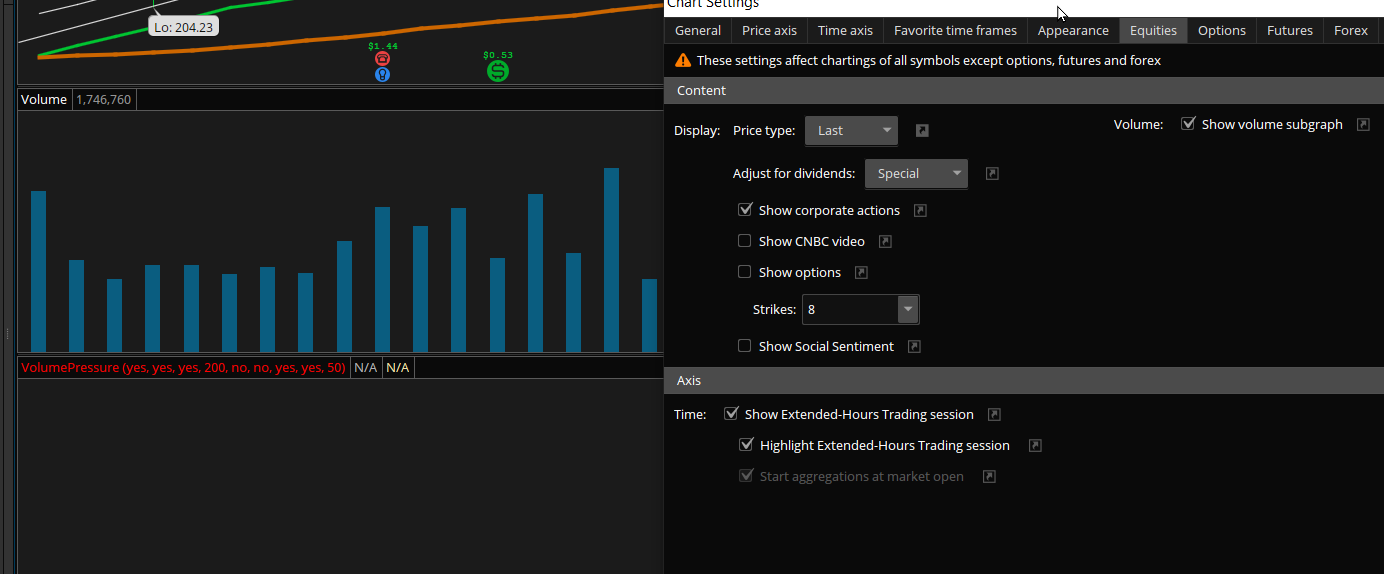
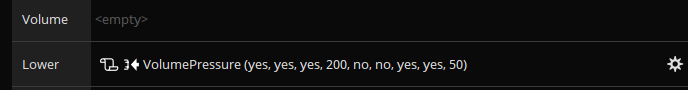
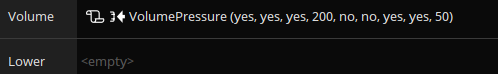
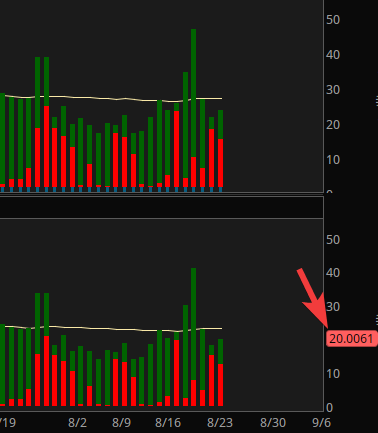
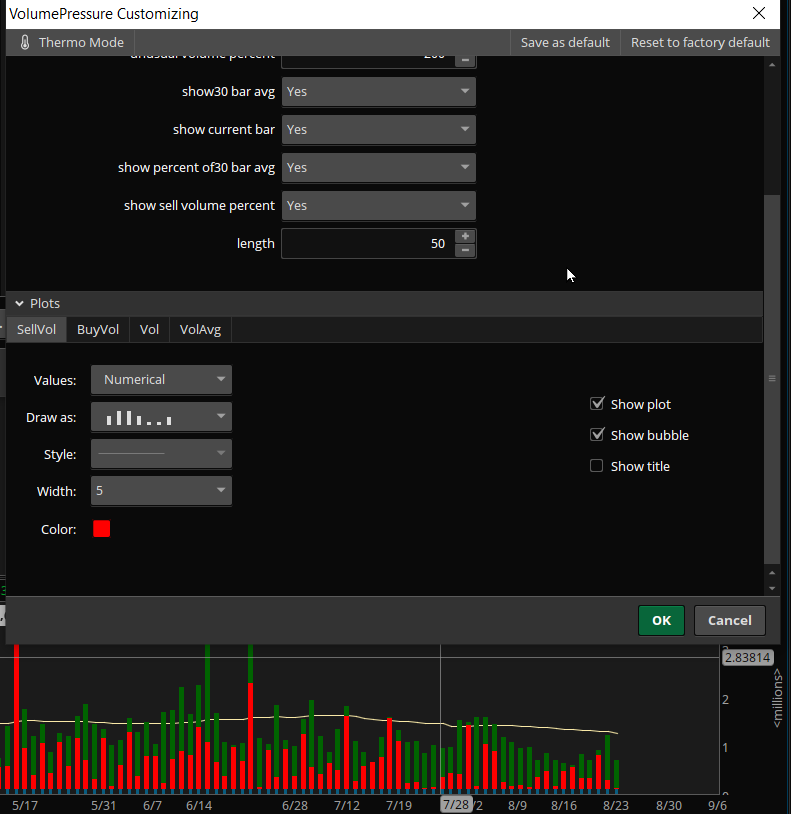
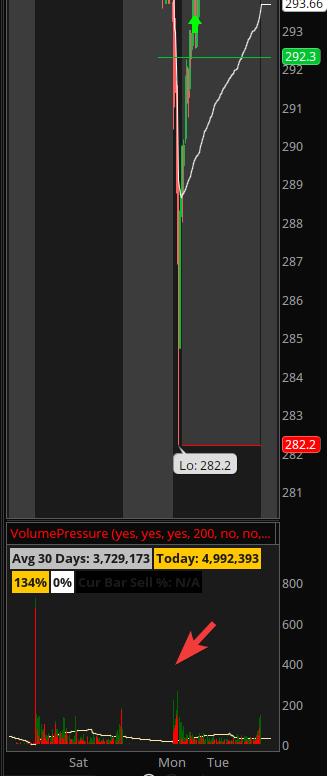
Why is custom volume study indicator not showing on 1 of my charts?

c0der

Member
it's not showing on my 1Y1W chart regardless of where I put it, but the same study appears on all my other Daily / Minute charts. Why is that so?

eMYmAjt.png


IKc85Qr.png


3Iun3cl.png
 
@c0der I don't believe that checking/unchecking the "show volume subgraph" is causing the issue - since it is a custom study, it should plot regardless. As @shanakrp2752 says, it could either be an error in your script, or:
  • it might have something to do with assigning the study to the left axis
  • some ThinkScript functions will not work on weekly charts - your input settings may be different from the parameters on other charts, and some function in the selected logic chain is preventing the study from showing on weekly
  • your 1Y1W chart timeframe may be too short to collect the data required, try something like 5Y1W or 10Y1W
Thats probably all that can be tried to fix it without actually getting someone else to attempt to duplicate the problem using your study.
 
Sharing my script below. I notice it doesn't work on 1Y1W and 1D5M. It works on 6M1D, 5Y1W. Hopefully anyone here can spot what's wrong..

Code:
# Volume Pressure

declare lower;

#Inputs

input Show30DayAvg = yes;
input ShowTodayVolume = yes;
input ShowPercentOf30DayAvg = yes;
input UnusualVolumePercent = 200;
input Show30BarAvg = yes;
input ShowCurrentBar = yes;
input ShowPercentOf30BarAvg = yes;
input ShowSellVolumePercent = yes;

def O = open;
def H = high;
def C = close;
def L = low;
def V = volume;
def buying = V*(C-L)/(H-L);
def selling = V*(H-C)/(H-L);

# Selling Volume

Plot SellVol = selling;
SellVol.setPaintingStrategy(PaintingStrategy.Histogram);
SellVol.SetDefaultColor(Color.Red);
SellVol.HideTitle();
SellVol.HideBubble();
SellVol.SetLineWeight(5);

# Total Volume

Plot BuyVol = volume;
BuyVol.setPaintingStrategy(PaintingStrategy.Histogram);
BuyVol.SetDefaultColor(Color.Dark_Green);
BuyVol.HideTitle();
BuyVol.HideBubble();
BuyVol.SetLineWeight(5);

#Volume Data

def volLast30DayAvg = (volume(period = "DAY")[1] + volume(period = "DAY")[2] + volume(period = "DAY")[3] + volume(period = "DAY")[4] + volume(period = "DAY")[5] + volume(period = "DAY")[6] + volume(period = "DAY")[7] + volume(period = "DAY")[8] + volume(period = "DAY")[9] + volume(period = "DAY")[10] + volume(period = "DAY")[11] + volume(period = "DAY")[12] + volume(period = "DAY")[13] + volume(period = "DAY")[14] + volume(period = "DAY")[15] + volume(period = "DAY")[16] + volume(period = "DAY")[17] + volume(period = "DAY")[18] + volume(period = "DAY")[19] + volume(period = "DAY")[20] + volume(period = "DAY")[21] + volume(period = "DAY")[22] + volume(period = "DAY")[23] + volume(period = "DAY")[24] + volume(period = "DAY")[25] + volume(period = "DAY")[26] + volume(period = "DAY")[27] + volume(period = "DAY")[28] + volume(period = "DAY")[29] + volume(period = "DAY")[30]) / 30;
def today = volume(period = "DAY");
def percentOf30Day = Round((today / volLast30DayAvg) * 100, 0);
def avg30Bars = (volume[1] + volume[2] + volume[3] + volume[4] + volume[5] + volume[6] + volume[7] + volume[8] + volume[9] + volume[10] + volume[11] + volume[12] + volume[13] + volume[14] + volume[15] + volume[16] + volume[17] + volume[18] + volume[19] + volume[20] + volume[21] + volume[22] + volume[23] + volume[24] + volume[25] + volume[26] + volume[27] + volume[28] + volume[29] + volume[30]) / 30;
def curVolume = volume;
def percentOf30Bar = Round((curVolume / avg30Bars) * 100, 0);
def SellVolPercent = Round((Selling / Volume) * 100, 0);

# Labels

AddLabel(Show30DayAvg, "Avg 30 Days: " + Round(volLast30DayAvg, 0), Color.LIGHT_GRAY);

AddLabel(ShowTodayVolume, "Today: " + today, (if percentOf30Day >= UnusualVolumePercent then Color.GREEN else if percentOf30Day >= 100 then Color.ORANGE else Color.LIGHT_GRAY));

AddLabel(ShowPercentOf30DayAvg, percentOf30Day + "%", (if percentOf30Day >= UnusualVolumePercent then Color.GREEN else if percentOf30Day >= 100 then Color.ORANGE else Color.WHITE) );

AddLabel(Show30BarAvg, "Avg 30 Bars: " + Round(avg30Bars, 0), Color.LIGHT_GRAY);

AddLabel(ShowCurrentBar, "Cur Bar: " + curVolume, (if percentOf30Bar >= UnusualVolumePercent then Color.GREEN else if PercentOf30Bar >= 100 then Color.ORANGE else Color.LIGHT_GRAY));

AddLabel(ShowPercentOf30BarAvg, PercentOf30Bar + "%", (if PercentOf30Bar >= UnusualVolumePercent then Color.GREEN else if PercentOf30Bar >= 100 then Color.ORANGE else Color.WHITE) );

AddLabel(ShowSellVolumePercent, "Cur Bar Sell %: " + SellVolPercent, (if SellVolPercent > 51 then Color.RED else if SellVolPercent < 49 then Color.GREEN else Color.ORANGE));

input length = 50;

plot Vol = volume;
plot VolAvg = Average(volume, length);

Vol.SetPaintingStrategy(PaintingStrategy.HISTOGRAM);
Vol.SetLineWeight(3);
Vol.DefineColor("Up", Color.UPTICK);
Vol.DefineColor("Down", Color.DOWNTICK);
Vol.AssignValueColor(if close > close[1] then Vol.color("Up") else if close < close[1] then Vol.color("Down") else GetColor(1));
VolAvg.SetDefaultColor(GetColor(8));
 
@c0der The only reason I can see why your study is not plotting on lower length charts is that it needs at least 30 bars of data to calculate the volume, and 50 bars of data to calculate the volume average. Otherwise it seems to work fine when I test it. If you are using it on IPO's such as DOCS on the daily agg, its likely you will get nothing shown until 50 bars of data are loaded. It can't show anything if it doesn't have the data to calculate your plots.
So to sum everything up, there's nothing wrong with your code, it just needs enough data to calculate correctly.

One thing interesting is how the original coder of portions of this study wrote the drawn-out method to calculate volLast30DayAvg and the avg30Bars variables -
Code:
def volLast30DayAvg = (volume(period = "DAY")[1] + volume(period = "DAY")[2] + volume(period = "DAY")[3] + volume(period = "DAY")[4] + volume(period = "DAY")[5] + volume(period = "DAY")[6] + volume(period = "DAY")[7] + volume(period = "DAY")[8] + volume(period = "DAY")[9] + volume(period = "DAY")[10] + volume(period = "DAY")[11] + volume(period = "DAY")[12] + volume(period = "DAY")[13] + volume(period = "DAY")[14] + volume(period = "DAY")[15] + volume(period = "DAY")[16] + volume(period = "DAY")[17] + volume(period = "DAY")[18] + volume(period = "DAY")[19] + volume(period = "DAY")[20] + volume(period = "DAY")[21] + volume(period = "DAY")[22] + volume(period = "DAY")[23] + volume(period = "DAY")[24] + volume(period = "DAY")[25] + volume(period = "DAY")[26] + volume(period = "DAY")[27] + volume(period = "DAY")[28] + volume(period = "DAY")[29] + volume(period = "DAY")[30]) / 30;
I've noticed that code floating around many places, and always wonder why no one ever codes this in a simpler fashion -
Code:
#Volume Data
def volLast30DayAvg = average(volume(period = "DAY")[1],30);
def today = volume(period = "DAY");
def percentOf30Day = Round((today / volLast30DayAvg) * 100, 0);
def avg30Bars = average(volume[1],30);
def curVolume = volume;
def percentOf30Bar = Round((curVolume / avg30Bars) * 100, 0);
def SellVolPercent = Round((Selling / Volume) * 100, 0);
 
that's the thing - 1Y1W has >30 weeks of data, and I tested it old time tickers like MSFT, AMZN. How can it not show on the 1Y1W chart then?

u previously mentioned it could be that the script doesn't accept weekly charts - how do I get it to fit weekly or minute charts? 🤔
 
@c0der Whenever you are using a study that references period = ... Be aware that it is a study that is using a secondary aggregation. Secondary Aggregations have limits in the manner in which they may be used.
The Peculiarities Of Secondary Aggregations
The secondary aggregation period cannot be less than the chart that it is being displayed on. Higher timeframes can be used on lower timeframe charts but not the other way around.

The secondary aggregation period can not be referenced in scans on the TOS platform.
https://tlc.thinkorswim.com/center/...hapter-11---Referencing-Secondary-Aggregation
As your study is using a secondary aggregation of DAY, it is limited to be used on Daily or lower timeframe charts. It cannot be utilized on a weekly chart.

The other typical reason for a study that is not displaying or is displaying incorrectly is when the chart does not have enough history to provide the necessary data for the calculations. Your 1D5min chart does not work but a 30D5min works fine:
Screenshot (64).png
 
that's the thing - 1Y1W has >30 weeks of data, and I tested it old time tickers like MSFT, AMZN. How can it not show on the 1Y1W chart then?

u previously mentioned it could be that the script doesn't accept weekly charts - how do I get it to fit weekly or minute charts? 🤔
@c0der After looking at the code again, I realized that when I tested it earlier I somehow failed to test it on weekly aggs. The study doesn't show on weekly charts because of the use of the daily aggregation in the code. I apologize for the faulty advice.
Here's a test code that automatically selects the daily agg if on daily or below, else it will choose the weekly. I've tested it on daily, weekly, and 5 min aggs. See if this works for you, or if changes are necessary -
Code:
# Volume Pressure

declare lower;

#Inputs
input Show30DayAvg = yes;
input ShowTodayVolume = yes;
input ShowPercentOf30DayAvg = yes;
input UnusualVolumePercent = 200;
input Show30BarAvg = yes;
input ShowCurrentBar = yes;
input ShowPercentOf30BarAvg = yes;
input ShowSellVolumePercent = yes;

def O = open;
def H = high;
def C = close;
def L = low;
def V = volume;
def buying = V*(C-L)/(H-L);
def selling = V*(H-C)/(H-L);

# Selling Volume
Plot SellVol = selling;
SellVol.setPaintingStrategy(PaintingStrategy.Histogram);
SellVol.SetDefaultColor(Color.Red);
SellVol.HideTitle();
SellVol.HideBubble();
SellVol.SetLineWeight(5);

# Total Volume

Plot BuyVol = volume;
BuyVol.setPaintingStrategy(PaintingStrategy.Histogram);
BuyVol.SetDefaultColor(Color.Dark_Green);
BuyVol.HideTitle();
BuyVol.HideBubble();
BuyVol.SetLineWeight(5);

#Volume Data
def agg = if getaggregationperiod() <= aggregationperiod.DAY then aggregationperiod.day else aggregationPeriod.WEEK;
def volLast30DayAvg = average(volume(period = agg)[1],30);
def today = volume(period = agg);
def percentOf30Day = Round((today / volLast30DayAvg) * 100, 0);
def avg30Bars = average(volume[1],30);
def curVolume = volume;
def percentOf30Bar = Round((curVolume / avg30Bars) * 100, 0);
def SellVolPercent = Round((Selling / Volume) * 100, 0);

# Labels
AddLabel(Show30DayAvg, "Avg 30 Days: " + Round(volLast30DayAvg, 0), Color.LIGHT_GRAY);
AddLabel(ShowTodayVolume, "Today: " + today, (if percentOf30Day >= UnusualVolumePercent then Color.GREEN else if percentOf30Day >= 100 then Color.ORANGE else Color.LIGHT_GRAY));
AddLabel(ShowPercentOf30DayAvg, percentOf30Day + "%", (if percentOf30Day >= UnusualVolumePercent then Color.GREEN else if percentOf30Day >= 100 then Color.ORANGE else Color.WHITE) );
AddLabel(Show30BarAvg, "Avg 30 Bars: " + Round(avg30Bars, 0), Color.LIGHT_GRAY);
AddLabel(ShowCurrentBar, "Cur Bar: " + curVolume, (if percentOf30Bar >= UnusualVolumePercent then Color.GREEN else if PercentOf30Bar >= 100 then Color.ORANGE else Color.LIGHT_GRAY));
AddLabel(ShowPercentOf30BarAvg, PercentOf30Bar + "%", (if PercentOf30Bar >= UnusualVolumePercent then Color.GREEN else if PercentOf30Bar >= 100 then Color.ORANGE else Color.WHITE) );
AddLabel(ShowSellVolumePercent, "Cur Bar Sell %: " + SellVolPercent, (if SellVolPercent > 51 then Color.RED else if SellVolPercent < 49 then Color.GREEN else Color.ORANGE));

input length = 50;
plot Vol = volume;
plot VolAvg = Average(volume, length);
Vol.SetPaintingStrategy(PaintingStrategy.HISTOGRAM);
Vol.SetLineWeight(3);
Vol.DefineColor("Up", Color.UPTICK);
Vol.DefineColor("Down", Color.DOWNTICK);
Vol.AssignValueColor(if close > close[1] then Vol.color("Up") else if close < close[1] then Vol.color("Down") else GetColor(1));
VolAvg.SetDefaultColor(GetColor(8));
 
@c0der Whenever you are using a study that references period = ... Be aware that it is a study that is using a secondary aggregation. Secondary Aggregations have limits in the manner in which they may be used.

As your study is using a secondary aggregation of DAY, it is limited to be used on Daily or lower timeframe charts. It cannot be utilized on a weekly chart.

The other typical reason for a study that is not displaying or is displaying incorrectly is when the chart does not have enough history to provide the necessary data for the calculations. Your 1D5min chart does not work but a 30D5min works fine:
View attachment 833

@MerryDay That's interesting that it doesn't plot either for you or @c0der on 1D 5M charts . . . using the original code supplied in this post, 1D 5M works fine -
example.png
 
@Pensar Ahhhh.... But I didn't test 1D5min... I took the poster's word that it didn't work and just added the additional data points.
You are correct 5minute charts all work :)
 
@c0der Sorry, I am confused.
When you state: "doesn't show using your code", what do you mean? @Pensar nor I wrote any codes and as you can see from the charts that @Pensar & I posted, the bubble works fine. You might be having platform issues?

Just for future reference: screenshots of partial charts do not provide enough information leaving members to guess at the problem.

Lastly, @Pensar unselfishly volunteers his time and expertise to provide assistance, it is proper forum etiquette to show appreciation for worthy contributions, by clicking on the 'thumbs-up' like at the bottom of his posts to give an emoji ‘like’. It is nice to be appreciated. :)
 
the only thing missing now is the bubble (enabled in settings but doesn't show using your code..)

KaAHS47.png
@c0der It works well here as far as I can tell. Perhaps try using a 1Y 1D chart of SEE, this should be the result (as of pre-market) -
example.png


@MerryDay Likes (or not) etc., never really bother me. I don't post to try to get them, but to help others to the best of my ability - which often isn't much anyway :D
 
thanks! just one last question. the volume bars on my 1d5m chart looks extremely tiny despite not many bars being shown. How do I make it normal sized like what we see above? I'm guessing it's because I'm showing extending trading hours, but would prefer to retain this view if possible.

bM8ZvXd.png
 

Join useThinkScript to post your question to a community of 21,000+ developers and traders.

Similar threads

Not the exact question you're looking for?

Start a new thread and receive assistance from our community.

87k+ Posts
302 Online
Create Post

Similar threads

Similar threads

The Market Trading Game Changer

Join 2,500+ subscribers inside the useThinkScript VIP Membership Club
  • Exclusive indicators
  • Proven strategies & setups
  • Private Discord community
  • ‘Buy The Dip’ signal alerts
  • Exclusive members-only content
  • Add-ons and resources
  • 1 full year of unlimited support

Frequently Asked Questions

What is useThinkScript?

useThinkScript is the #1 community of stock market investors using indicators and other tools to power their trading strategies. Traders of all skill levels use our forums to learn about scripting and indicators, help each other, and discover new ways to gain an edge in the markets.

How do I get started?

We get it. Our forum can be intimidating, if not overwhelming. With thousands of topics, tens of thousands of posts, our community has created an incredibly deep knowledge base for stock traders. No one can ever exhaust every resource provided on our site.

If you are new, or just looking for guidance, here are some helpful links to get you started.

What are the benefits of VIP Membership?
VIP members get exclusive access to these proven and tested premium indicators: Buy the Dip, Advanced Market Moves 2.0, Take Profit, and Volatility Trading Range. In addition, VIP members get access to over 50 VIP-only custom indicators, add-ons, and strategies, private VIP-only forums, private Discord channel to discuss trades and strategies in real-time, customer support, trade alerts, and much more. Learn all about VIP membership here.
How can I access the premium indicators?
To access the premium indicators, which are plug and play ready, sign up for VIP membership here.
Back
Top