Trigun1127
Member
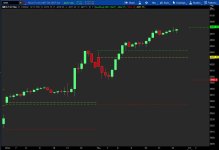
So I have my code set to display yesterdays High And Low while also displaying just the days open price for that current day. However the open price has been inaccurate for the past two days either by a tick or a whole point. I'm also using this on the 5 minute chart.
declare hide_on_daily;
declare once_per_bar;
input timeFrame = {default DAY, WEEK, MONTH};
plot high = If(GetAggregationPeriod() <= AggregationPeriod.FIFTEEN_MIN, high(period = timeFrame)[1], Double.NaN);
plot Low = If(GetAggregationPeriod() <= AggregationPeriod.FIFTEEN_MIN, low(period = timeFrame)[1], Double.NaN);
plot Open = If(GetAggregationPeriod() <= AggregationPeriod.FIFTEEN_MIN, open(period = timeFrame)[0], Double.NaN);
high.SetDefaultColor (Color.GREEN);
high.SetPaintingStrategy(PaintingStrategy.DASHES);
Low.SetDefaultColor(Color.RED);
Low.SetPaintingStrategy(PaintingStrategy.DASHES);
Open.SetDefaultColor (Color.Yellow);
Open.SetPaintingStrategy(PaintingStrategy.DASHES);